Traffic congestion studies make for quick and easy news articles, but they don’t even begin to calculate the true time lost to car culture.
The news story practically wrote itself: Toronto was ranked 7th worst among world cities for traffic congestion in 2022.
A web search showed similar stories popping up all over: “________________ [nearby city] ranks __th worst in world for traffic congestion.”
What did these traffic congestion ratings really measure? That wasn’t usually spelled out in click-bait articles. But a closer look reveals that the ratings measure and value the time spent by one particular class of urban residents – drivers – while omitting the urban mobility costs born by other citizens.
The basis for the recent round of stories was an annual report by INRIX called 2022 INRIX Global Traffic Scorecard. The company describes their work this way:
“INRIX Research uses INRIX proprietary big data, analytics and industry expertise to understand the movement of people and goods around the world. We achieve this by leveraging billions of anonymous data points every day from a diverse set of sources on all roads in countries of coverage. Our data provides a rich and fertile picture of mobility that enables INRIX Research to produce valuable and actionable insights for policy makers, transport professionals, automakers, and drivers.” (2022 INRIX Global Traffic Scorecard, page 27)
The Traffic Scorecard makes brief mentions of transportation methods such as walking, biking and public transit. But these ways of getting around cities don’t count in the Global Traffic Scorecard – even for cities in which they are the dominant types of mobility.
Instead, the Scorecard tallies and values the time supposedly lost by a particular subset of travelers, which happens to include most policymakers, politicians, the upper ranks of media, and mid- and upper-level businesspeople – that is, those who get around cities routinely by car.
For this class of people, an unobtainable ideal is a key factor in calculating the cost of lost time: the standard of “free-flow conditions.” This is the idea that when a large number of drivers are stalled in slow traffic, each one should imagine how fast they could move if most or all of the other drivers were not on the road; then there would be “free-flow conditions.”
It is nonsensical to imagine that in rush hour in a big city, when most people are commuting all at once, you could ever achieve “free-flow conditions”. Nevertheless this ideal is used as the measuring stick for calculating “time lost in traffic”. As INRIX explains their calculations,
“Total time lost is the difference in travel times experienced during the peak periods compared to free-flow conditions on a per driver basis. In other words it is the difference between driving during commute hours versus driving at night with little traffic.” (p. 10)
Using this standard, INRIX calculates that “The typical US driver lost 51 hours due to congestion in 2022.” In the UK, the typical driver lost 80 hours, and in Germany it was 40 hours.
What is this time “worth”? Using figures from the US Federal Highway Administration, INRIX calculates each hour of time lost in traffic as valued at $16.89 in the US, £8.83 in the U.K., and 10.08€ in Germany. Given the numbers of hours lost by each driver, and the large number of drivers, you can come up with large monetary sums for the cost of congestion. INRIX states that traffic congestion cost the US, for example, $81 billion in 2022. These sums will be bandied about whenever lobbyists advocate for more billions to be spent on road widening projects.

Consider the above excerpt from the INRIX report. The seven “most congested” cities all have substantial, sometimes world-famous public transit systems, and all have a substantial portion of population who don’t own or commute in cars.
How does “traffic congestion” affect all the people who don’t drive but still need to get around? Are they less affected by congestion than those poor, benighted drivers? Or are they even more affected? INRIX doesn’t tell us.
Yet in the number one city for congestion, London, only a minority own a car and a much smaller minority use a car for commuting:
“New census data has revealed that just 20 per cent of Londoners commute by car and 41 per cent of London households have no car at all. Yet despite this relatively low level of car ownership, the city is disproportionately designed to incentivise driving. At nearly 20,000 hectares, 12.4 per cent of land in the capital is taken up by roads – significantly more than the just 8.8 per cent of London currently used for housing.” (Dezeen, “Cities should not just build green transport but actively dismantle car infrastructure”, by Phineas Harper, 11 January 2020)
Statistics are similar for New York City: about 45 percent of households own a car, though fewer use cars to commute. (Source: NYCEDC) Even in Toronto, now dominated by its sprawling suburbs, about 28% of households do not own a car, and in some parts of the city non-car-owners are the majority. (Source: Toronto Star)
Do the non-car-users lose as much time to traffic congestion? For people who live close enough to workplaces or schools to walk or to bike, they might well lose much less time in traffic than the average car commuter (though they may still pay a high price in breathing polluted air, while risking being crushed by cars and trucks on unsafe roads).
[slide-anything id=’3472166′]
But one thing is clear: the time lost by non-car-users is neither counted nor valued in congestion surveys like INRIX’s. And when policymakers make important transportation systems decisions based on surveys like INRIX’s you can expect the results to be seriously flawed.

The Gardiner Expressway walls off Toronto from its waterfront on Lake Ontario, and has required ever more costly repairs. In 2021 the Toronto Star reported “The Gardiner will eat up $2 billion of the 2021-2030 capital plan — 38 per cent of total transportation-related infrastructure spending — meaning the city will spend as much rehabilitating the Gardiner as they will on upkeep on every other roadway. But a study commissioned by the Gardiner Coalition found that removing the eastern portion of the expressway could add 5 to 10 minutes to the commute times of rush-hour drivers – so the elevated expressway is still eating big chunks of the city’s budget. Photo by George Socka, from Wikimedia Commons.
Arriving at a good estimate of the time non-drivers lose to traffic congestion is difficult, but that doesn’t make the losses any less real. Take, for example, all the time pedestrians spend waiting at traffic lights while autos either speed or crawl through intersections. Think of the extra time pedestrians must spend walking out of their way to get to a relatively safe place to cross a busy road, and then doubling back to their destination. Think of the time public transit users must wait while their packed buses or trams are stalled behind private cars which each carry one person.

The Jane M. Byrne Interchange of expressways I90, I94 and I294, takes a big chunk of downtown Chicago, eating up a lot of time for non-car-drivers who need to get from one side of the tangle to another. Photo by Sea Cow, April 2022, from Wikimedia Commons.
Other lost-time costs of car culture are even harder to calculate. In many cities where car culture has hegemony, large swathes of urban landscape have been cleared and turned into car lanes plus necessary storage space, i.e. parking. That pushes actual destinations – homes, stores, schools, workplaces – farther apart. The resulting greater travel distances cost everyone more travel time. But above all the people who don’t drive, but still need to get around, lose a lot of their time in getting past expressways, multi-lane arterial roads, and parking lots on the way to their destinations. Traffic congestion studies don’t even begin to quantify the time lost to all this “induced distance”.
Studies like INRIX’s scorecard make for quotable listicles and reverse-bragging rights among the driving class. But beware when this skewed data is put forth as a basis for public policy decisions on transportation infrastructure.
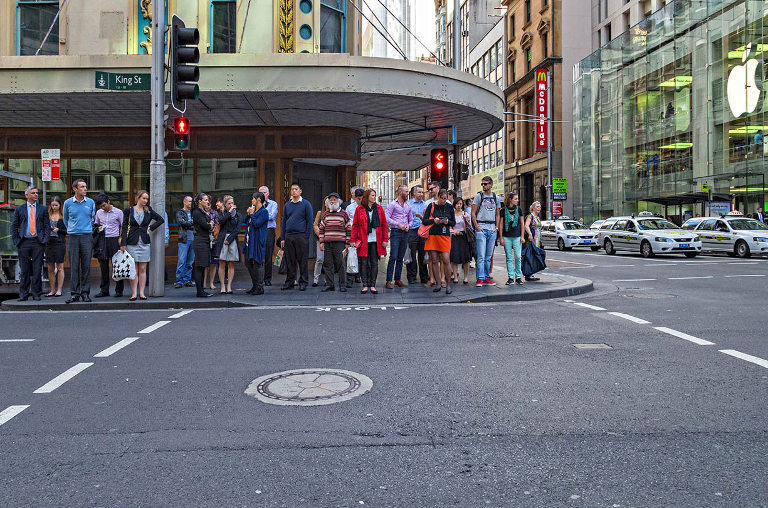
Photo at top of page: Waiting for the lights, Sydney, Australia, photo by Dave Young, license under Creative Commons 2.0, at flickr.com.


_4-1-22.jpg)