Ed. note: Parts 1, 2 and 3 of this series can be found on Resilience.org here, here, and here.
Oil Production in Russia and Asia
Oil production in the region corresponding to the Former Soviet Union (FSU) has a long history. Production started in the second half of the 1800s around Baku in what is now Azerbaijan on the Caspian Sea. In the 1800s, that region was part of Russia so Russian oil production started in the later 1800s around the Caspian Sea. In the late 1800s the Caspian Sea region was producing approximately 30% of the world’s oil. The region was a hot oil producing play from the late 1800s through World Wars I & II.
Figure 1 is a graph of the historical oil production for the FSU/Russia from 1973 through the first quarter of 2022 (Graphs in this report are personally prepared graphs from U.S. DOE/EIA data unless otherwise specified):
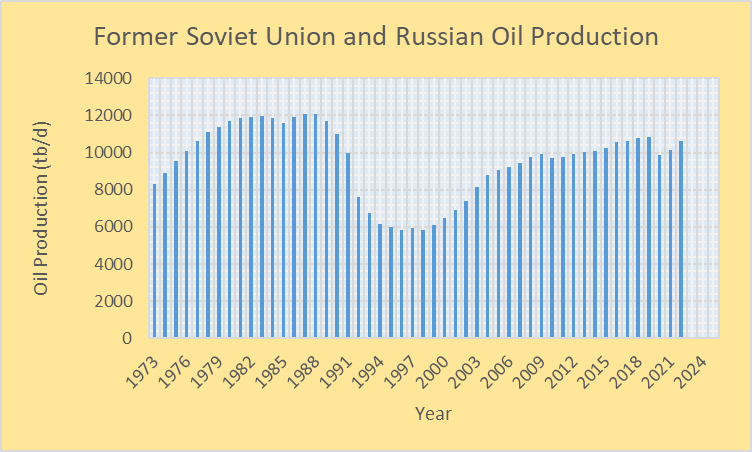
Figure 1-Oil Production from the Former Soviet Union (1973-1991) and Russia (1992-present)
Most of the FSU’s oil production from the 1970s until the breakup of the Soviet Union in the early 1990s was from what is now Russia. In 1992, after the collapse of the FSU, the Caspian Sea region produced about 10% of what Russia produced in 1992.
Production from the FSU reached its highest rate in the late 1980s at over 12 mb/d. When the Soviet Union collapsed in late 1991 it led to a steep decline in Russian oil production in the 1990s. Starting around 2000, Russian oil production picked up and has in recent years been generally over 10 mb/d with the highest rate being 10.847 mb/d in 2019. The production rate in the first quarter of 2022 was 10.618 mb/d.
Figure 2 is a graph of Russian + Caspian Sea region + Ukrainian oil production:
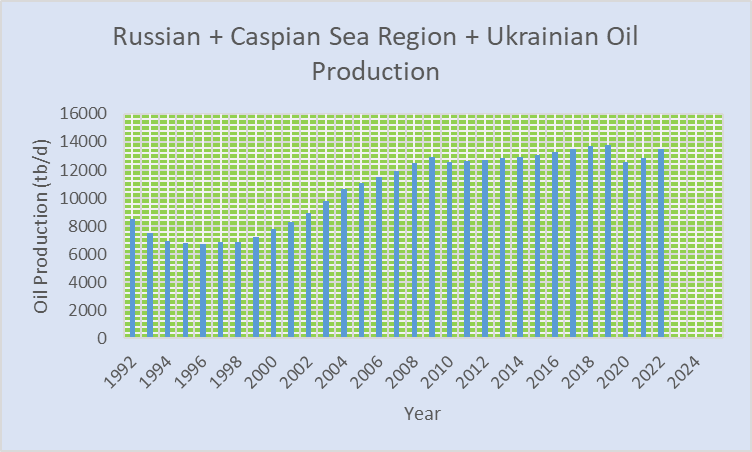
Figure 2-Russian + Caspian Sea region + Ukrainian oil production
When Caspian Sea region and Ukrainian oil production are added to Russian production, the total for the first quarter of 2022 was 13.47 mb/d. Ukraine is a minor oil producer, only producing at a rate of 27,000 b/d in the first quarter of 2022.
Since roughly the year 2000, there has been a full court press to produce oil in all of Russia. Along with expanding exploration and production within Russia, new technologies have been used in the last few decades to maximize oil production.
There are 5 key oil regions in Russia: West Siberian, Urals-Volga, Timan Pechora (Northwest & Arctic), East Siberian and Far East (Sakhalin Island area) shown in Figure 3:
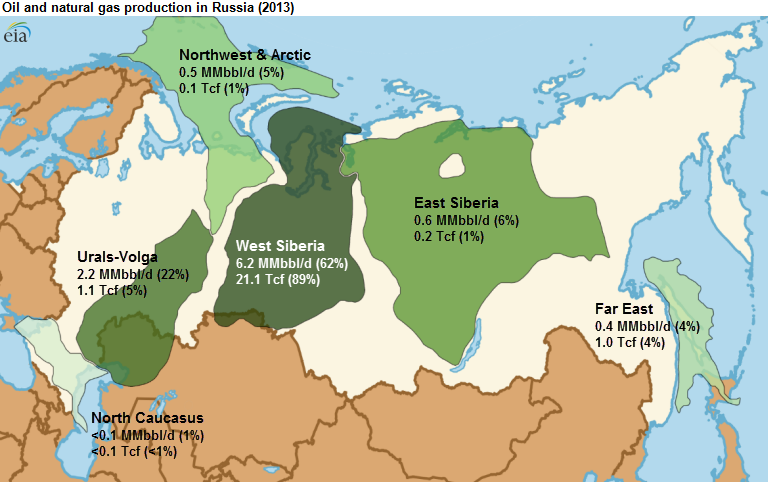
Figure 3-Oil producing regions in Russia
Many elephant fields have been discovered in these basins including Samotlor (22 Gb-seventh largest field in the world), Romashkino (16.5-17.2 Gb) and numerous others. In 2013, the West Siberian Basin produced 6.2 mb/d and the Urals-Volga region produced 2.2 mb/d. That represented 84% of Russia’s total oil production in 2013.
The West Siberian Basin is the second most prolific oil basin in the world after the Middle East. Exploration dates back to the 1950s and production dates back to the 1960s. In 2000, the West Siberian Basin was producing approximately 75% of Russian oil and gas. Approximately 60% of Russia’s oil production presently comes from the West Siberian Basin.
West Siberian Basin oil production has dropped about 10% over the last decade due to depletion and rising water levels in the oil reservoirs. The United States Geological Survey (USGS) has estimated an ultimate oil recovery for the basin at approximately 200 Gb. Realize that the USGS has a history of inflated oil reserves estimates so if anything, I would consider that the 200 Gb figure is on the high side.
The Urals-Volga region was discovered in the 1920s and has been extensively explored. Production reached a peak in the late 1960-early 1970s at approximately 1.6 mb/d. Production declined to under 300,000 b/d in the 1990s but has since rebounded with considerable advanced technology.
The Romanshkino oil field is the largest field in the Urals-Volga oil region and has produced over 15 Gb of oil. It has a EUR of 16.5-17.2 Gb so there is still oil to be extracted but a lot less than in the distant past. Approximately 87-91% of the initial amount of oil has been extracted.
International oil companies became interested in developing oil and gas in the Sakhalin Island region off the east coast of Siberia in the early 2000s. Two projects: Sakhalin I and Sakhalin II were the result of that interest. The region produced 348,000 b/d in 2018 and 258,000 b/d in the first 2 months of 2022.
ExxonMobil and Shell announced plans to exit the projects in May 2022 due to the Russia-Ukraine conflict which led to a significant oil production decline in May, particularly the Sakhalin I project. The EUR for the region is reported to be ~2.3 Gb.
Russia has only barely explored producing tight oil from fracking. In 2019, Vladimir Putin said Russia would never go the fracking route because they don’t have to and because it’s bad for the environment. That said, Gasprom (an oil and gas company based in Russia) has been working on horizontal drilling and fracking since 2016.
It appears that a EUR for Russia of approximately 300 Gb is a reasonable estimate. Cumulative oil production for all of Russia at the end of 2021 was 189.2 Gb or about 63% of 300 Gb.
Caspian Sea Region-The Caspian Sea region became a hot oil topic back in the 1990s when claims were made that the region may have oil reserves comparable to the Middle East. In approximately the year 2000, the U.S. DOE/EIA was providing an estimate of oil reserves for the Caspian Sea region of 233 Gb.
The U.S. DOE/EIA obtains their reserves estimates from the USGS which, as I’ve stated, tend to provide inflated oil reserves estimates. As of 2013, the U.S. DOE/EIA had reduced the reported estimate of Caspian Sea region oil reserves to 48 Gb of recoverable oil. A study by the oil consulting firm Wood McKenzie back in the early 2000s put the recoverable reserves for the region at 39.4 Gb.
Figure 4 is a graph of oil production from the Caspian Sea region from 1992 through the first quarter of 2022:
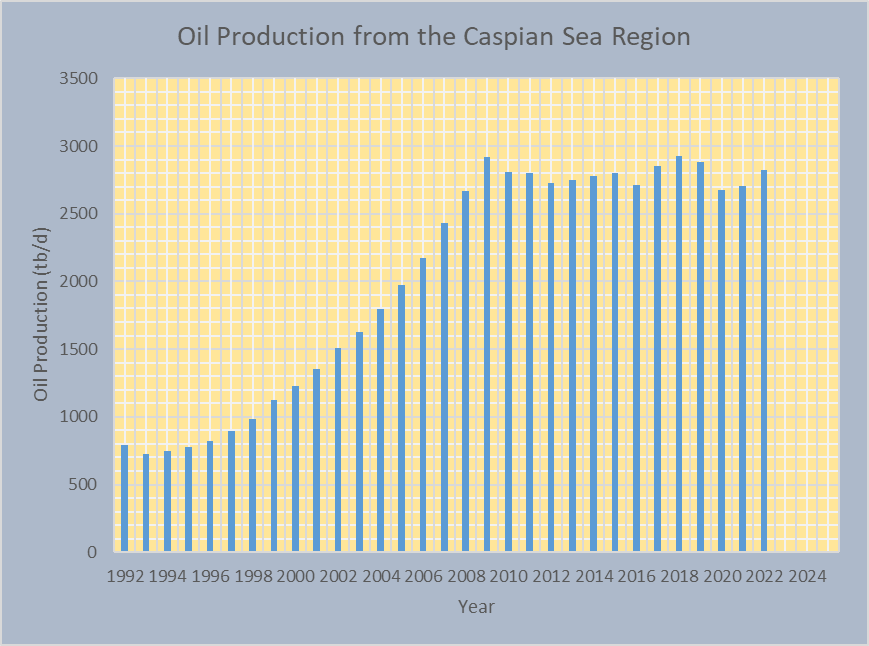
Figure 4-Oil production from the Caspian Sea region
*Countries include Kazakhstan, Azerbaijan, Uzbekistan, and Turkmenistan
The vast majority of the oil production in the graph of Figure 4 comes from Kazakhstan and Azerbaijan. In the first quarter of 2022, Kazakhstan had a production rate of 1.903 mb/d and Azerbaijan had a production rate of 0.691 mb/d. As the graph in Figure 4 illustrates, production rose fairly rapidly from the 1990s to 2009 and has since been relatively flat.
Oil production from Uzbekistan has generally declined since 1998 from 116,000 b/d to 35,000 b/d in the first quarter of 2022. Azerbaijan reached a production rate of 1.049 mb/d in 2009 and has generally declined since then to 0.691 mb/d in the first quarter of 2022. Turkmenistan has had a relatively flat oil production rate of approximately 200,000 b/d over the past decade (first quarter 2022 production rate was 195,000 b/d). Kazakhstan’s oil production rose from 0.718 mb/d in 2000 to 1.903 mb/d in the first quarter of 2022 although production has been on a general plateau since 2018.
[slide-anything id=’3472166′]
Southeast Asia-Oil production in Southeast Asia is dominated by Chinese oil production. Figure 5 is a graph of Chinese oil production from 1973 through the first quarter of 2022:
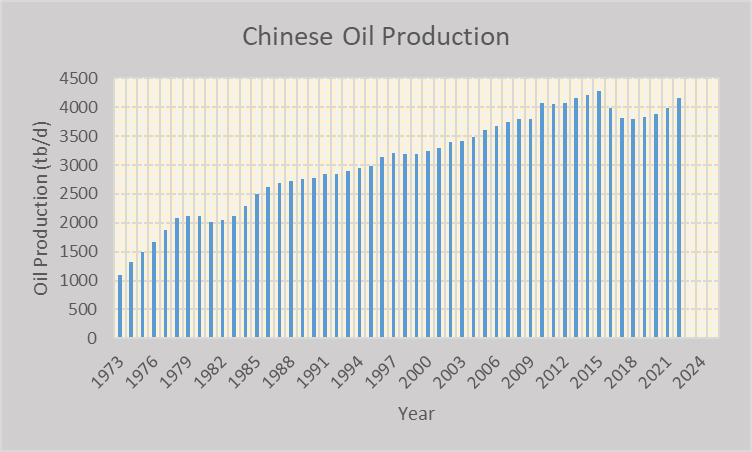
Figure 5-Chinese oil production
The maximum oil production rate for China occurred in 2015 at 4.278 mb/d. In the first quarter of 2022, the production rate was 4.152 mb/d. Oil production in China is dominated by a few oil regions shown in Figure 6:
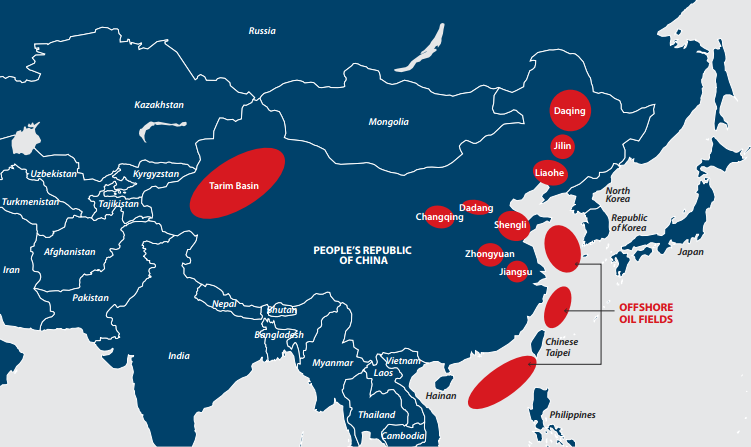
Figure 6*-Oil regions within China
*From the Internet
Oil production within China has historically been dominated by the Daqing oil region. The impression given by the media is that it is one field but there are actually many fields within the region.
Oil production for Daqing reached 1 mb/d in 1976 and remained above 1 mb/d through 2002. In 2003, the region produced approximately 970,000 b/d. In 2008, the production rate for the region was down to 794,000 b/d. In 2021, the production rate had declined to approximately 600,000 b/d. It is an oil producing region in decline.
The Shengli oil region is the second highest producing region in China and was discovered in 1961. It contains many oil fields as well. In the early 1990s, it achieved a production rate of approximately 670,000 b/d. In 2002, the production rate was 534,302 b/d. Figure 7 is a graph of Shengli’s historical and projected oil production:
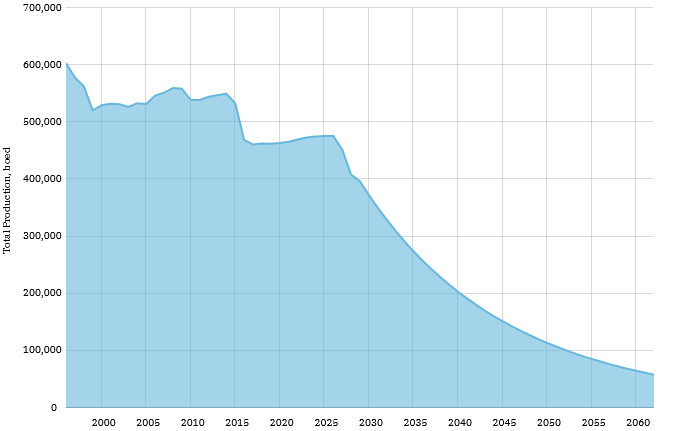
Figure 7*-Historical oil production for the Shengli oil region and projected future production
*From the Internet
Media reports indicate that the Shengli oil region is being developed for tight oil production.
The Liaohe oil region was discovered in 1968 and production started in 1971. The region’s oil production peaked in 1995 at 311,313 b/d and had declined to 277,002 b/d by 2001. Figure 8 is a graph of Liaohe’s historical and projected oil production:
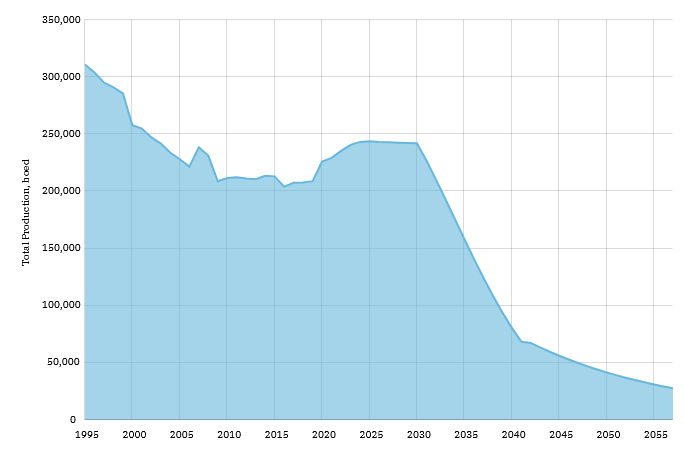
Figure 8*- Historical oil production for the Liaohe oil region and projected future production
*From the Internet
An oil producing region that has gained prominence in China more recently is the Changqing oil region. It was discovered in 1971 and started producing oil in 1975. For the period 2012-2017, it produced an average of about 475,000 b/d of crude oil and apparently has continued producing at that rate to the present.
China started to develop offshore oil in the early 1980s and production has become significant in the last few decades. The China National Offshore Oil Company (CNOOC) produces oil from the Bohai Sea, Western South China Sea, and Eastern South China Sea. Figure 9 is a graph of their production from 2010 through 2021.
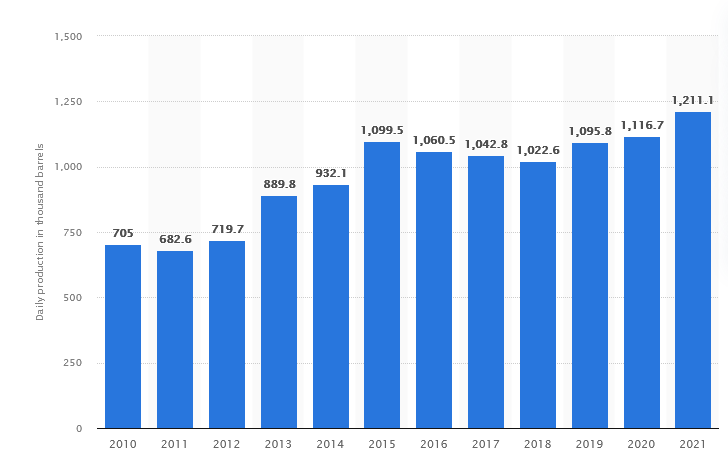
Figure 9*-China’s offshore oil production
*From the Internet
The CNOOC is projecting an oil production peak by 2030. It’s reasonable to expect offshore oil production in China to decline in a pattern similar to that of the North Sea.
China is heavily dependent on oil imports. Because of that, there is a strong push to produce as much oil as possible within China. The oil industry in China is projecting to spend approximately $125 billion on oil exploration and development for the period 2020-2025 and drill approximately 118,000 wells. Maybe the Chinese oil industry can hold off declining production for a while with an extreme effort but there are too many regions within China where production is declining to hold it off for long.
China has the second highest rate of oil consumption in the world behind the U.S. Figure 10 is a graph of China’s historical oil consumption:
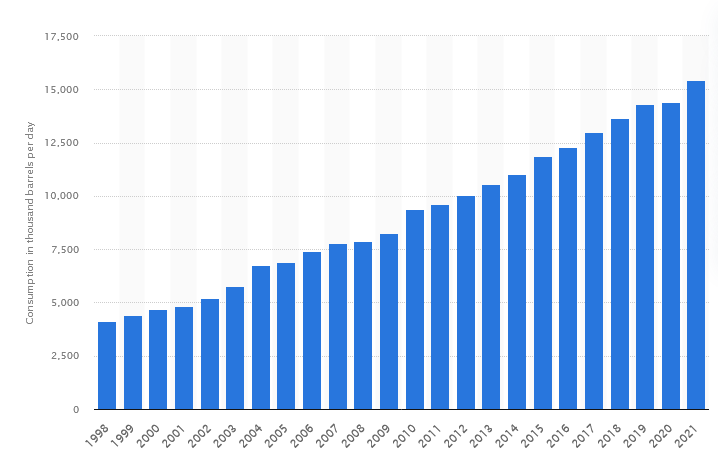
Figure 10*-China’s historical oil consumption
*From the Internet
In 2021, China consumed 15.4 mb/d of oil, up from 14.41 mb/d in 2020. Since 2019, China has imported over 10 mb/d of crude oil, by far the world’s highest rate of oil imports.
Figure 11 is a graph of Southeast Asian oil production from 1980 through the first quarter of 2022:
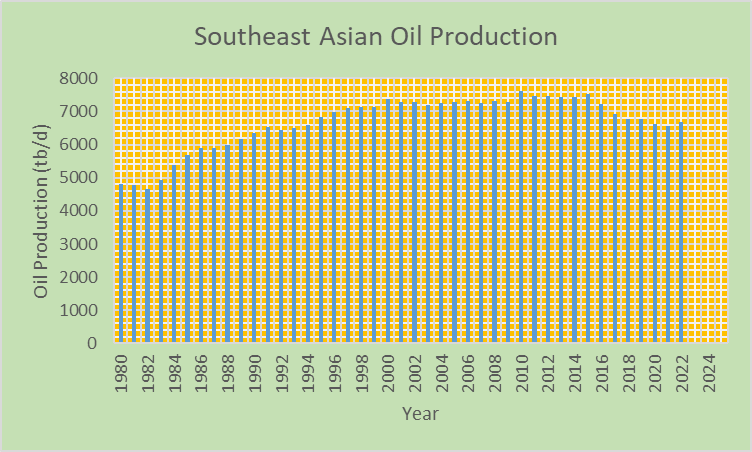
Figure 11-Southeast Asian oil production*
*Countries include China, India, Indonesia, Australia, Malaysia, Vietnam, Thailand, Burma, Brunei and the Philippines
For the countries in Figure 11, summed oil production reached a maximum of 7.616 mb/d in 2010. In the first quarter of 2022, production was 6.679 mb/d, a difference of 0.937 mb/d or 12.3% relative to 2010.
The only country that had more than a trivial increase in oil production from 2021 to the first quarter of 2022, more than a 2,000 b/d increase, was China, with an increase of 196,000 b/d. Most of the countries experienced production declines from 2021 to the first quarter of 2022 including Indonesia, India, Australia, Brunei, Thailand, Burma and the Philippines.
Five of the countries associated with the Figure 11 graph have been in decline since before 2006: Indonesia, Australia, Brunei, Malaysia, and Vietnam. Figure 12 is a graph of production for this group of countries from 1980 through the first quarter of 2022:
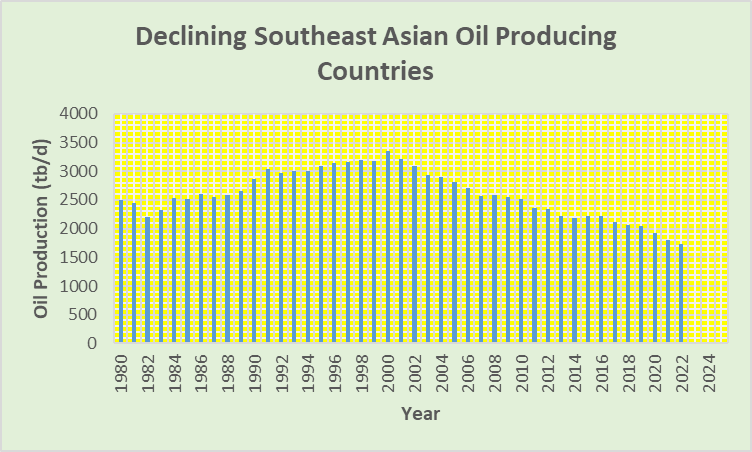
Figure 12-Declining Southeast Asian Oil Producing Countries*
*Countries include Indonesia, Australia, Brunei, Malaysia, and Vietnam
Production for the countries in the graph of Figure 12 reached a maximum in 2000 at 3.361 mb/d. In the first quarter of 2022, the production rate was 1.739 mb/d, a decline of 1.622 mb/d or 48.3% from the year 2000 value.
Besides the countries associated with the graph in Figure 12, India has been on a downward slide since 2011 when the production rate was 782,000 b/d. In the first quarter of 2022, the production rate for India was 606,000 b/d, a decline of 176,000 b/d or 22.5% relative to the 2011 value. Figure 13 is a graph of Indian oil production from 1980 through the first quarter of 2022:
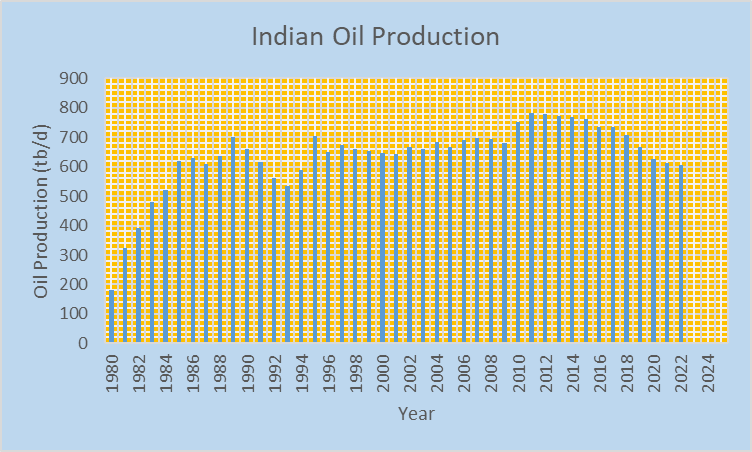
Figure 13-Indian oil production
A significant percentage of India’s domestic oil production over the years has come from the Bombay High field, now called the Mumbai High field. In Nov. 2009 it produced 347,197 b/d or about 50% of India’s total oil production that month. By 2020, production from the Mumbai High field was down to approximately 170,000 b/d. Without new sources of oil production within India, India’s oil production will continue to decline as the Mumbai High field declines along with other fields within India.
Indonesia has a long history of oil production with the discovery of oil occurring in 1883. Since roughly 1950, much of Indonesia’s oil production has come from two large fields: Duri and Minas. In 1974, the Minas field produced 420,356 b/d. By 2001, production was down to 126,316 b/d. The Duri field reached a production rate of approximately 300,000 b/d in 1994. It’s presently producing at a rate of approximately 185,000 b/d.
Indonesia’s oil production reached a maximum of 1.69 mb/d back in 1977. Indonesia has been on a fairly steady downward trajectory since the late 1990s as Figure 14 illustrates:
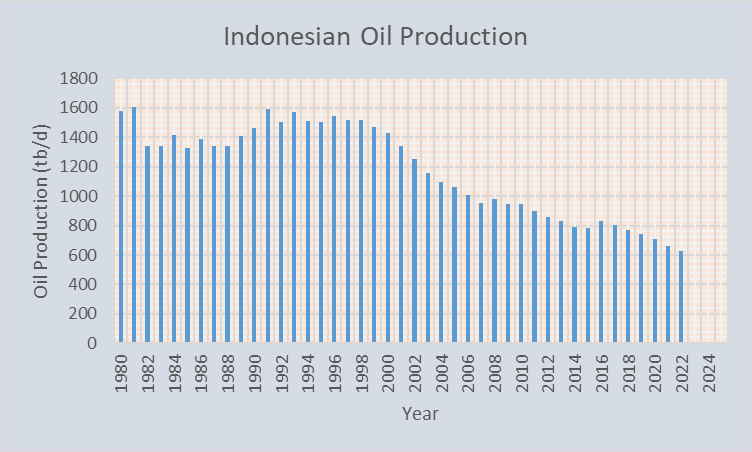
Figure 14-Indonesian oil production*
*2022 data is for the first quarter
In 1996, a more recent high point for production, Indonesia produced 1.547 mb/d of oil. In the first quarter 2022, it produced 0.628 mb/d, a decline of 59.4% relative to the 1996 oil production rate. Indonesia is a country in decline when it comes to oil production.
Australia has been in general oil production decline since the year 2000. Figure 15 is a graph of Australian oil production from 1980 through the first quarter of 2022:
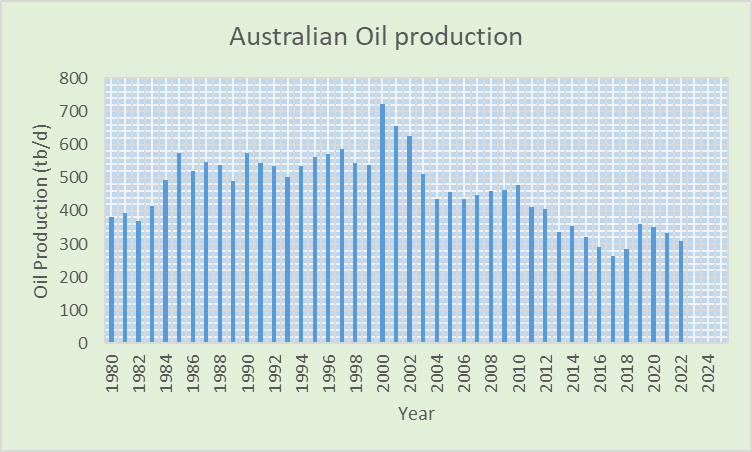
Figure 15-Australian oil production
Australia reached a production rate of 722,000 b/d in 2000. In the first quarter of 2022, the production rate was 310,000 b/d, a decline of 412,000 b/d relative to the year 2000 production rate or 57.1%.
Oil companies are actively fracking wells within Australia but it hasn’t translated into increased oil production. It appears that a lot of the fracking activity is associated with natural gas.
Another country that has fallen into decline in recent years is Malaysia. Figure 16 is a graph of Malaysian oil production from 1980 through the first quarter of 2022:
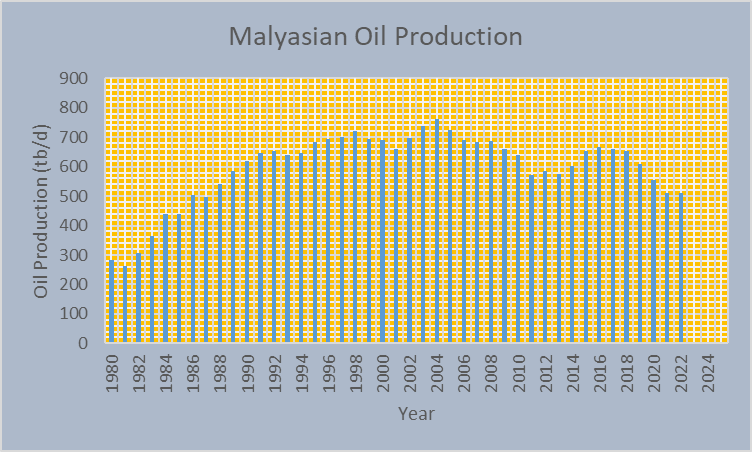
Figure 16-Malaysian oil production
The most recent high point for Malaysian oil production occurred in 2016 when the production rate reached 667,000 b/d. In the first quarter of 2022, the production rate was 512,000 b/d, a decline of 23.2% relative to the 2016 production rate.
The most significant oil regions in the world have been highlighted in the first 4 parts of this report. Hopefully sufficient evidence has been presented to argue that there are serious oil depletion problems in numerous regions around the world and that there is significant likelihood that global oil production will decline further from the 2018 maximum and possibly decline at a fairly rapid rate in coming years. I expect to see significant upward pressure on oil prices in the future as well. So how do the alternatives to oil look? We’ll see in Part 5 of this report.
Teaser photo credit: Stando de Vostokgazprom en teknoparko en Tomsko, Rusio. By RG72 – Own work, CC BY-SA 4.0, https://commons.wikimedia.org/w/index.php?curid=76716573