Ed. note: Parts 1 and 2 of this series can be found on Resilience.org here and here.
Oil Production in the Americas
South America-Oil production in South America started in the early 1900s but prior to 1950, essentially all of the production was from Venezuela. At this point in time, oil production is down considerably in Venezuela relative to its maximum production rate and the prime conventional oil fields within Venezuela are seriously depleted.
The hot areas now within South America are two deep water plays in Brazil: Campos and Santos Basins. A reported 94% of Brazil’s total oil reserves are located in those two basins. In recent years, there has been intense oil development within those basins.
Figure 1 is a graph of historical Brazilian oil production from 1980 through the first quarter of 2022 (Graphs in this report are personally prepared graphs from U.S. DOE/EIA data unless otherwise specified):
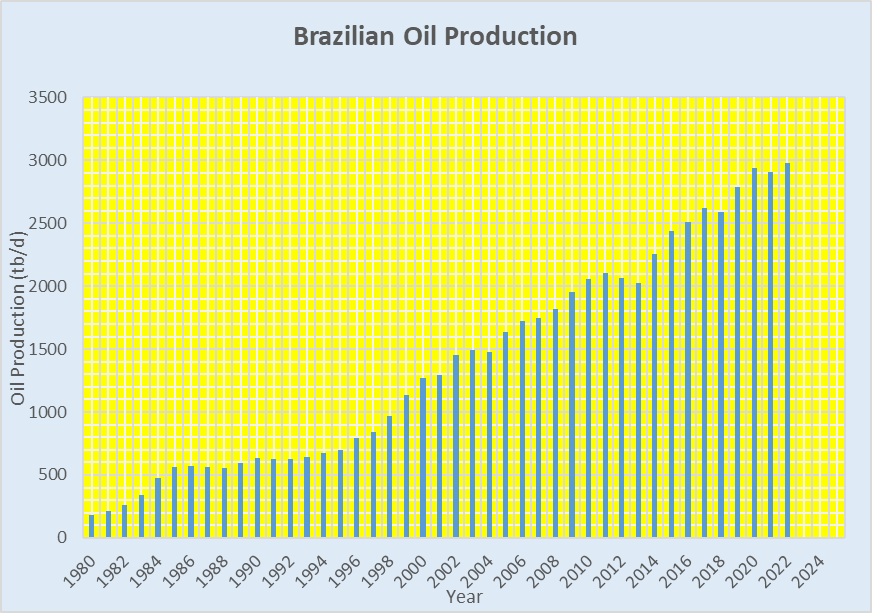
Figure 1-Brazilian Oil Production
The first oil discovery in the Campos Basin was in 1974 but it wasn’t until the 1980s that a string of elephant fields were found in the deep waters of the basin. Those fields include Albacora, Marlim, Roncador, Barracuda, Caratinga, Jubarte, Cachalote and Peregrino.
Based upon the data available, the sum of oil production from Albacora, Marlim, Roncador, Barracuda, Caratinga, Jubarte, Cachalote and Peregrino is approximately 1.4 mb/d or about 46% of Brazil’s total oil production. Based upon media statements, the Campos Basin produces about 60% of Brazil’s total production. That would put the Campos Basin oil production rate at approximately 1.7 mb/d.
One of the largest fields in the Campos Basin is the Marlim field. It achieved a production rate of 650,000 b/d in 2002. In 2019, the Marlim field had declined to a production rate of 75,000 b/d but satellite fields were producing on the order of 190,000 b/d in 2019. Note that the satellite fields have not brought the production rate up to anything approaching the 2002 rate for the Marlim field.
Santos basin oil development started later than that of the Campos Basin. The first big discovery was the Lula field, later named the Tupi field, with an Estimated Ultimate Recovery (EUR) of as much as 8 Gb. The field is reported to be producing at a rate of 922,000 b/d.
The production rate for the Santos Basin is reported to be approximately 1.4 mb/d so the sum of Campos + Santos oil production rates is on the order of 2.8-3.1 mb/d or essentially all of Brazil’s production.
What I see for Brazilian oil production is a pattern similar to that of the North Sea. The elephant fields are producing at very high production rates that translates into early production peaks. I believe it won’t be too many years before total Brazilian production reaches a peak and then goes into decline.
Figure 2 is a graph of South American oil production minus Brazilian oil production from 1980 through the first quarter of 2022:
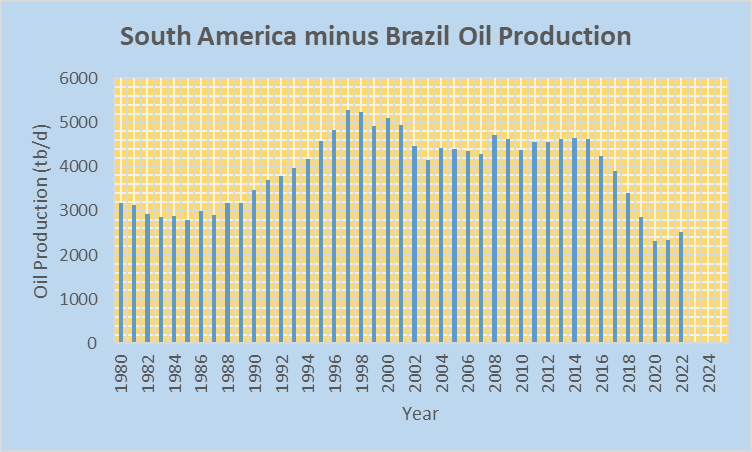
Figure 2-South American oil production minus Brazilian oil production
*Figure 2 includes oil production from Argentina, Venezuela, Colombia, Peru and Ecuador
The graph in Figure 2 includes all South American countries that reached a production rate of at least 150,000 b/d at some point in their history, of course excluding Brazil. Production for the countries in Figure 2 reached a high in 1997 at 5.272 mb/d. In the first quarter of 2022, the oil production rate was 2.532 mb/d, a decline of 2.740 mb/d or about 52% from the 1997 rate.
Figure 3 is a graph of South American oil production minus (Brazilian + Venezuelan) oil production, or another way of stating it is oil production from Peru/Colombia/Argentina/Ecuador from 1980 through the first quarter 2022:
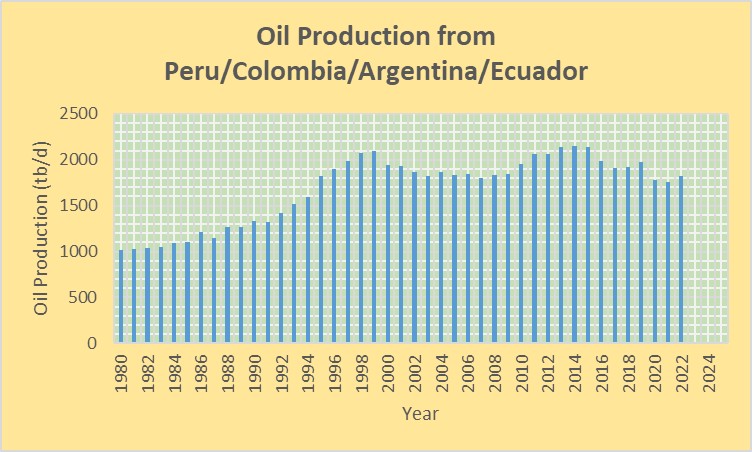
Figure 3-Oil Production from Peru/Colombia/Argentina/Ecuador
Total oil production for the countries in Figure 3 reached its highest rate in 2014 at 2.145 mb/d. In 2021, the production rate was 1.820 mb/d.
Table I has data for the individual countries corresponding to the graph in Figure 3:
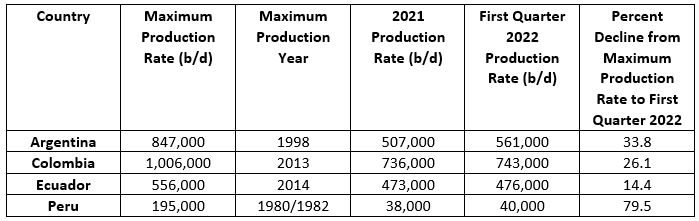
Table I
I used the percent decline from the maximum production rate to the first quarter of 2022 in the last column of Table I because the price of oil is up over 2021 and the first quarter 2022 values should correspond to a maximum effort to produce oil in those countries. The only country with a significant increase in production over 2021 was Argentina.
It appears that the increase in production for Argentina is associated with the shale play identified as Vaca Muerta. Production from the play started in 2012/2013 and represents 39% of Argentina’s oil production. The hope is to increase Argentina’s oil production to 1 mb/d with shale oil development.
In terms of Colombia, there has been growing investment in petroleum in recent years. Industry spending increased 46% year-over-year to $3.1 billion in 2021 yet petroleum production declined 6%. In 2022, investment in the oil industry is planned to be $4.4 billion and expectations aren’t great that oil production will increase by more than a trivial amount. The amount of reserves in Colombia is reported to be 1.8 billion barrels, which is very low.
Social unrest in Ecuador is used to explain production problems within the country in 2022. In May 2022, Ecuador’s production rate dropped to 456,000 b/d, less than the first quarter value given in Table I. Extended unrest could lead to further declines of production in 2022. Ecuador has a reported 8 Gb of oil reserves which suggests, assuming the 8 Gb figure is valid, that production could be higher than what has been the production rate in recent years.
Figure 4 is a graph of the summed oil production rate for all the countries of South America:
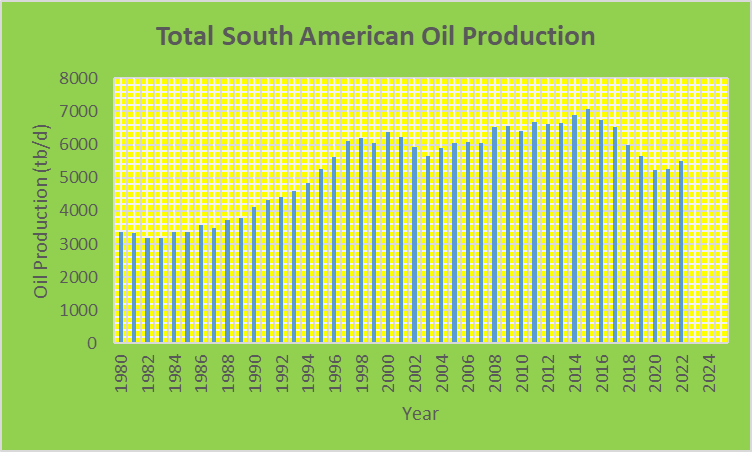
Figure 4-Total South American oil production
Total South American oil production reached its highest rate in 2015 at 7.062 mb/d. In the first quarter of 2022, the production rate was 5.511 mb/d, a difference of 1.551 mb/d or about 22% relative to 2015.
The most prominent oil producer by far historically in South America has been Venezuela. Historically oil production in Venezuela was concentrated around Lake Maracaibo and particularly along the eastern shore of the lake, a region known as the Bolivar Coastal fields.
Three of the fields within the Bolivar Coastal fields had EUR values of 5.0 Gb or more: Lagunillas (14.0 Gb), Bachequero (8.0 Gb) and Tia Juana (5.0 Gb). There were numerous other fields in the 1-5 Gb range as well. At this time the fields around Lake Maracaibo are seriously depleted.
Figure 5 is a graph of Venezuelan oil production from 1973 through the first quarter of 2022:
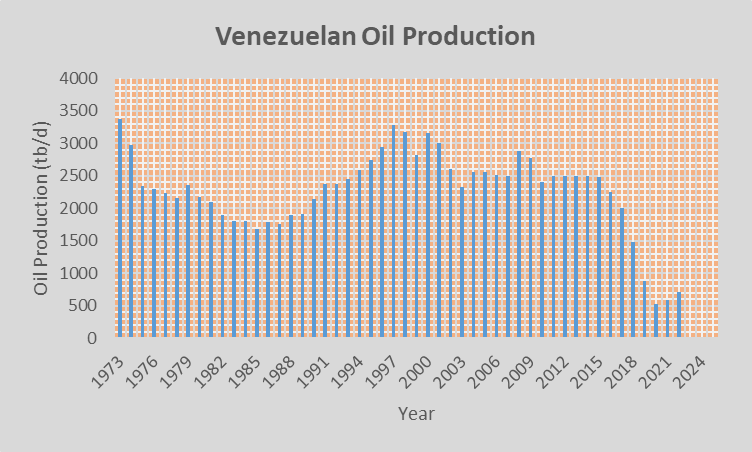
Figure 5-Venezuelan oil production
Venezuela reached its highest production rate in 1970 at 3.71 mb/d. Production declined in the 1970s and early 1980s before a rebound in the 1990s to reach the 3 mb/d range again in the late 1990s and early 2000s.
The production surge in the 1990s was associated with a large increase in the number of producing fields, from 68 in 1979 to 240 in 1999. After the surge, production generally remained flat or declined. I associate the decline to declining oil production from the smaller fields that were added through the late 1980s and 1990s.
In recent years, Venezuelan oil production fell below 1 mb/d. The large drop off in Venezuelan oil production can no doubt be attributed to political problems within Venezuela, U.S. sanctions, the pandemic and reduced global oil demand. I think a realistic production rate of 1-2 mb/d is possible for Venezuela but probably not above that level in the foreseeable future.
Much of what Venezuela has remaining is extra heavy oil from the Orinoco Oil Belt. Media sources like to push the idea that Venezuela has the world’s largest reserves of oil and can thus dramatically increase its oil production with the right political environment. Venezuela may have the world’s largest oil reserves but that hasn’t translated into a high production rate and won’t anytime soon. Extra heavy oil is more difficult to produce and it takes a long time to increase production.
According to media sources in the early 2000s, the Venezuelan state oil company was projecting a national oil production rate of 5.8 mb/d by 2012. That didn’t happen and it won’t happen anytime in the foreseeable future.
North America-I have previously covered the status of U.S. oil production in my report “The Status of U.S. Oil Production”:
https://www.resilience.org/stories/2022-05-04/the-status-of-u-s-oil-production/
I don’t care to repeat what I covered in that report except to provide an update of U.S. tight oil and Gulf of Mexico (GOM) oil production. About 92% of the increase in U.S. oil production from 2008 to 2019 was from tight oil production and the rest was from deep water GOM production. What happens with tight oil and deep water GOM production in the future will determine the future of U.S. oil production.
The U.S. DOE/EIA in their Annual Energy Outlook 2021 projected that tight oil production from shale plays will maintain a production rate of over 9 mb/d from 2025 through 2050, as shown in Table II.
U.S. DOE/EIA Projections in their Annual Energy Outlook 2021
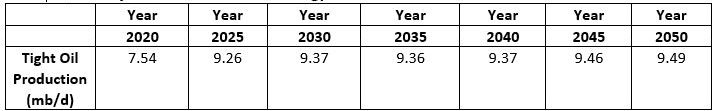
Table II
Based upon U.S. DOE/EIA projections, total tight oil production from 2020 through 2050 would be approximately 100 billion barrels. That would be comparable to the EUR of the Ghawar oil field, the largest conventional oil field in the world. Even with all that production from 2020 through 2050, the tight oil production rate would remain high in 2050 and beyond. I don’t see that projection as being within the realm of possibility.
What the U.S. DOE/EIA is saying is that there is an infinite, or near infinite, amount of tight oil that can be obtained through fracking. It appears that the objective of the U.S. DOE/EIA is to comfort the public, not provide a realistic assessment of future tight oil production.
Essentially all of the tight oil production in the U.S. comes from 5 shale plays: Permian Basin, Eagle-Ford, Bakken, Niobrara and Anadarko. As of 2021, the production rates from 4 of those 5 plays was down considerably from their highest production rates, ~200,000 b/d or more (the Permian Basin is the play in which oil production continues to increase). The problem with those 4 plays is that they have largely been saturated with wells and to expect them to produce at an elevated rate through 2050 and beyond is delusional.
Data are readily available for 2 of those 4 plays: Bakken and Eagle-Ford. How has oil production been doing recently for the two plays considering the elevated price of oil in 2022 compared to 2021 (for the first 3 months of 2021 the average price of West Texas Intermediate was $57.75/barrel while it was $94.55/barrel in 2022)?
Those two shale plays rank 2nd and 3rd behind the Permian Basin in terms of oil production rates among U.S. shale plays. Table III has oil production rate data for the North Dakota Bakken region for January-March + May of 2021 and 2022. I didn’t include April in Table III because blizzards in April 2022 reduced the oil production rate by about 20% compared to March 2022. Data are from the state of North Dakota:

Table III
If April data for the North Dakota Bakken is included in the January-May period, the production rate was down by 60,086 b/d relative to 2021.
Table IV has oil production rate data for the Eagle-Ford shale play in January and March of 2021 and 2022. I didn’t include February data in Table IV because of the freaky cold weather in Feb. 2021 which significantly reduced Texas oil production during that month and I didn’t include April and May data because the Railroad Commission of Texas revises preliminary data upward for several months.

Table IV
In the case of Bakken and Eagle-Ford, the elevated price of oil in 2022 compared to 2021 hasn’t translated into higher oil production rates and I don’t expect a big surge in either play as we move along in 2022. The problem is that wells have largely saturated the plays.
With higher oil prices, production from the Texas Permian Basin increased from 2.899 mb/d for January + March 2021 to 3.006 mb/d in January + March of 2022, an increase of 107,000 b/d. I did not include February because of the freaky cold weather of Feb. 2021 in Texas which significantly affected oil production.
Even better than the Permian Basin in Texas, New Mexico’s oil production, mostly from the Permian Basin, increased from 1.122 mb/d for January-May 2021 to 1.444 mb/d for January-May 2022, an increase of 322,000 b/d. It appears to me that the objective of oil producers in New Mexico is to see how quickly they can achieve a peak production rate.
[slide-anything id=’3472166′]
The increase in Permian Basin oil production was to be expected because the play has not been completely saturated with wells, but in the not-too-distant future the increase in production can’t be maintained. The play will ultimately be saturated with wells and production will decline.
The production increase from shale plays in the U.S. in early 2022 has come essentially exclusively from the Permian Basin, by far the largest shale play in the U.S., so I found this recent quote of interest:
“The supply chain seems stretched to the max in the Permian Basin. There really is not much ability to increase drilling activity.”-An executive at an oilfield service company, quoted by Oilprice.com
With higher oil prices, producers accelerate well development which can increase production. Producers have also been re-fracking wells. Re-fracking can lead to a short term increase in production. At some point, re-fracking isn’t worth the money and effort required to do it.
The increase in U.S. oil production from 2008 to 2019 was mostly due to an increase in tight oil production from shale plays but there was also an increase in production from the Gulf of Mexico (GOM), specifically the deep water GOM.
How is oil production doing in the Gulf of Mexico in 2022? Table V has oil production data for the Gulf of Mexico for the period January-May:

Table V
High oil prices haven’t helped GOM oil production so far in 2022.
In the first quarter of 2022, the oil production rate in the U.S. was 11.448 mb/d. That was 0.263 mb/d higher than the 2021 average. The previous quarterly high for the U.S. was in the fourth quarter of 2019 at 12.777 mb/d, a difference of 1.329 mb/d compared to the first quarter of 2022. I don’t see the U.S. again producing at a rate of 12.777 mb/d for a quarter.
Canada-Essentially all of Canada’s oil production comes from Alberta, Saskatchewan, and Newfoundland with minor amounts in other provinces, particularly British Columbia and Manitoba.
Figure 6 is a graph of Canadian oil production from 1973 through the first quarter of 2022:
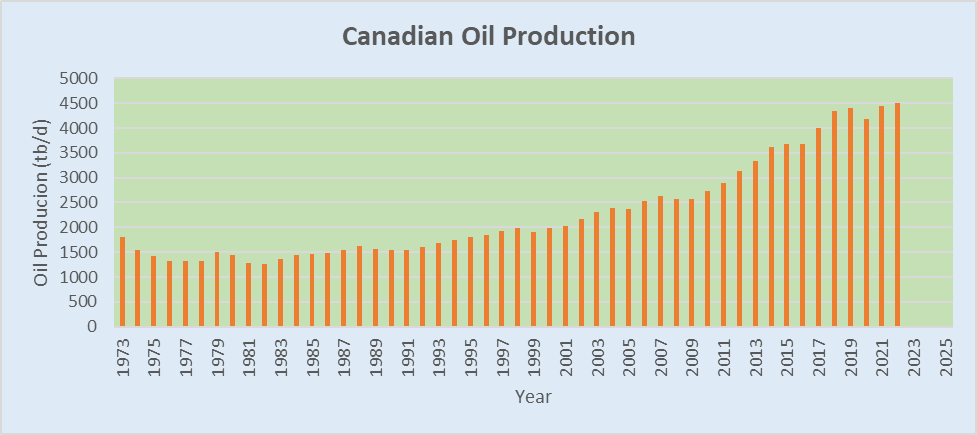
Figure 6-Canadian Oil Production
In 2021, the Canadian oil production rate was 4.44 mb/d. The majority of Canadian oil production comes from the Athabasca Oil Sands in Alberta. In December 2021, total Canadian oil production was 4.96 mb/d and oil sands oil production was on the order of 3.5 mb/d. That means that oil sands production represents roughly 70% of Canada’s total oil production.
Figure 7 is a graph of oil sands oil production over time:
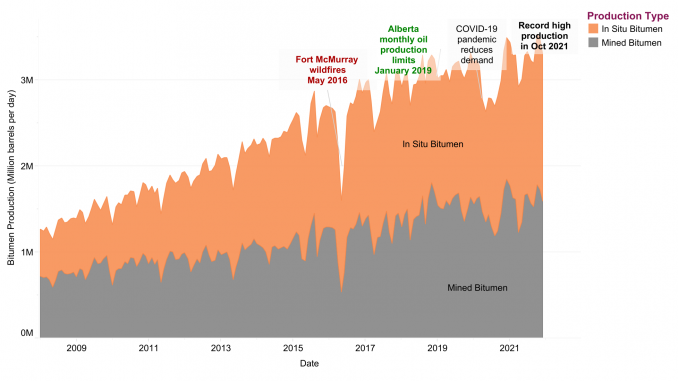
Figure 7*-Alberta oil sands oil production
*From the Internet
A question to be asked is how high can oil sands production go and how fast? Here is what the Canadian government expects:
“The Canadian Energy Regulator forecasts oil sands production to peak at around 4.3 million bpd in 2039, and expects most of that growth to come from expansions to existing facilities.”
That is only ~0.8 mb/d higher than the present production rate so it appears that the yearly production increase from oil sands will be considerably less than in the recent past.
Conventional oil production in Alberta has been in general decline since 1998. There is no reason to expect that trend to change.
Saskatchewan is the second largest oil producing province in Canada behind Alberta accounting for ~10% of Canada’s crude oil production. In 2020, Saskatchewan produced 487,200 b/d. Saskatchewan produces mainly heavy oil, about 87% of its total oil production. Most of the oil production increase in recent years within Saskatchewan has been from tight oil.
Hydraulic fracking has been around for a long time in Canada, dating back to the 1950s. In recent years, horizontal drilling has been combined with fracking and has been used extensively on certain shale plays within Canada. Canada has more than 200,000 horizontal oil and gas wells that have been fracked, mostly in the western provinces. It’s estimated that 80% of new wells in Canada are fracked.
One hears a lot about fracking in the Bakken shale play of North Dakota. The play extends into Saskatchewan and fracking activity has been strong there as well. By 2021 there were on the order of 7,200 fracked wells within the Bakken play of Saskatchewan. To put that in perspective, the Bakken region of North Dakota has 14,000-15,000 producing fracked wells.
As of Dec. 2012, the Bakken oil production rate in Saskatchewan was 71,000 b/d. For comparison purposes, the Bakken region in North Dakota produced 703,840 b/d in Dec. 2012. The sweet spot for oil production in the Bakken region of North Dakota is well south of the boundary between Saskatchewan and North Dakota. I assume there is no corresponding sweet spot in Saskatchewan.
Oil production from Newfoundland comes from 5 fields: Hibernia, White Rose, Hebron, Terra Nova, and North Amethyst although Terra Nova has been shut down since December 2019. Terra Nova needs some major upgrades to the tune of $600 million to start producing again. An agreement was reached in 2021 to re-start the field and start-up is planned for fall 2022.
Newfoundland’s oil production rate from January through May of 2022 averaged 245,000 b/d, about 5% of Canada’s total oil production. That was a decline of about 10% from the same period in 2021. The problem with Newfoundland’s oil production is that 4 of 5 of their oil fields are in decline and Newfoundland’s oil production should, in general, continue to decline even with the addition of smaller fields to the production base.
Table VI contains data for the 5 fields in Newfoundland:
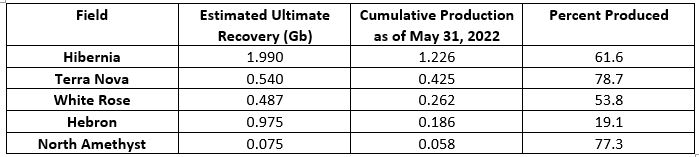
Table VI
*Data from the Canada-Newfoundland and Labrador Offshore Petroleum Board
**Data includes satellites of the main fields
The Hibernia oil field is the largest oil field in Newfoundland. In the early 2000s, it was producing on the order of 200,000 b/d. Even as of 2017, it was producing on the order of 150,000 b/d. The Hibernia field had a production rate of 99,100 b/d in 2021, 16% less than in 2020. The field is in production decline and will, in general, decline in the future.
In the early 2000s the Terra Nova field was producing on the order of 130,000 b/d. Presently it’s producing no oil but the field will start up again this fall. It will be interesting to see what the production rate is when production returns.
The main White Rose field started producing oil in November of 2005. The main field is in decline but planned expansion of satellite fields is expected in the near future.
The Hebron field is a relatively new addition to Newfoundland’s production. It produced its first oil in late 2017. It is now the highest producing field in Newfoundland with a production rate of approximately 135,000 b/d.
Figure 8 is a graph of recent oil production from Newfoundland’s oil fields:
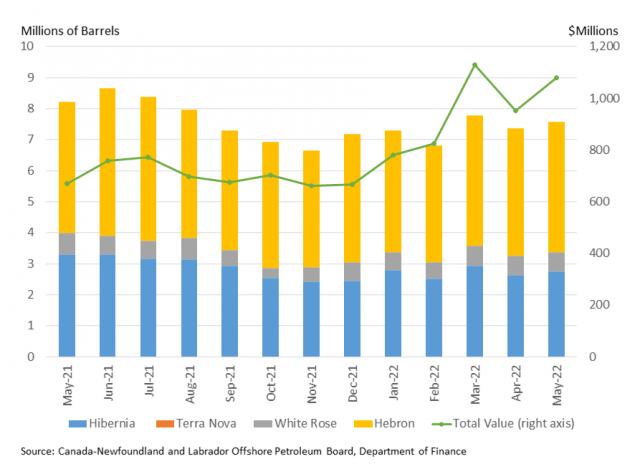
Figure 8*-Oil Production from Newfoundland’s oil fields
*From the Internet
Mexico-Figure 9 is a graph of Mexico’s oil production from 1973 through the first quarter of 2022:
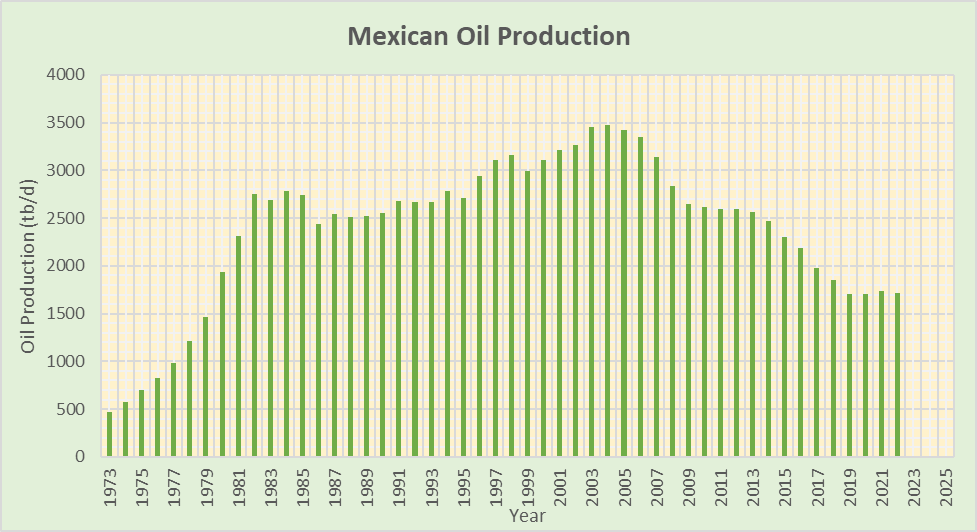
Figure 9-Mexican Oil Production
Mexican oil production reached its highest rate in 2004 at 3.476 mb/d. In 2021, production was down to 1.734 mb/d, a decline of 50.1% from the 2004 rate. In the first quarter of 2022, production was down to 1.716 mb/d. The decline in Mexican oil production is due to the decline of both the Cantarell and Ku-Maloob-Zaap Complexes.
The Cantarell Complex was the first huge oil complex in Mexico to be developed. It is located in the Bay of Campeche. The production rate reached a maximum in 2004 of 2.1 mb/d. Presently the Cantarell Complex is producing approximately 0.160 b/d, a decline of about 92% from the 2004 production rate.
To replace declining production from the Cantarell Complex, production was ramped up for the Ku-Maloob-Zaap Complex. Production reached a high of 839,200 b/d in 2010 and 853,000 b/d in Nov. 2015. The production rate was down to 770,000 b/d in July 2019 and 719,000 b/d in 2021. In early 2022, the production rate was down to ~700,000 b/d.
Fracking hasn’t had a significant impact on Mexican oil production. The state oil company, Pemex, was expected to spend $262 million on operations involving hydraulic fracking in 2021 and $788 million in 2022. Mexico has shale plays, the most noteworthy of which is the Burgos Basin, a gas play. It doesn’t appear that tight oil production will be a significant factor in Mexican oil production any time in the near future.
I expect Mexican oil production, in general, will decline in coming years. There have been some recent offshore oil discoveries in Mexico but those discoveries aren’t going to change the trajectory of Mexican oil production because they aren’t sufficiently large enough to make a difference.
What is happening in terms of oil production in Russia and Asia? We’ll look at that in Part 4.
Teaser photo credit: By Nestor Galina – https://www.flickr.com/photos/nestorgalina/1163020351/, CC BY 2.0, https://commons.wikimedia.org/w/index.php?curid=4272750