After the price of oil collapsed in April of 2020, U.S. oil producers reduced drilling new wells and completing drilled wells, which contributed to a production declined to 11.28 mb/d on an annual basis in 2020. Beyond the pandemic problems endured by oil producers, there were depletion problems as well, particularly for tight oil production. Tight oil comes from the fracking of shale plays.
Government data for oil field production may represent crude oil or crude oil + condensate. If graphs and tables in this report only include crude oil, that will be specified otherwise the data can be assumed to be crude oil + condensate. Typically, condensate represents less than 20% of the total crude oil + condensate production for a field or play.
U.S. crude oil + condensate production increased significantly between 2008 and 2019. That increase was due to tight oil and deep water Gulf of Mexico (GOM) production increases. Tight oil production increased approximately 7.3 mb/d from 2008 to 2019 and deep water GOM production increased approximately 0.67 mb/d. To put 7.3 mb/d in perspective, only 2 countries, other than the U.S., produce over 5.0 mb/d of oil (Saudi Araba and Russia).
In 2021, the price of West Texas Intermediate (WTI) oil increased significantly over 2020 and even beyond the value of 2019 (2019/2020/2021 average prices were $56.99/$39.16/$67.99/barrel) but the average annual U.S. crude oil + condensate production rate was only 11.19 mb/d, down 1.10 mb/d relative to 2019. National Public Radio (NPR) news programs put an interesting spin on the low U.S. oil production rate for 2021 even though the price of oil was significantly higher than in 2020 and even 2019.
The spin from NPR is that the U.S. oil industry is showing great discipline in holding production down to prop prices up. The implication in the spin is that the U.S. oil industry could crank production up to whatever level they desire if that was their goal. But their goal is actually to maintain higher oil prices.
Of course the oil industry prefers higher prices to increase profitability. The most effective measure to maximize price increases would be to stop all new U.S. oil development. The problem with a measure like that is that U.S. oil production would decline because much of the production comes from tight oil wells that decline rapidly.
The industry has to drill and complete new wells at a brisk pace just to maintain production at a constant rate. With increasing oil prices in 2021, the industry was projected to increase the number of new U.S. wells in 2021, versus 2020, by 15.4% with the number of Permian Basin wells increasing by 27.8% (the Permian Basin is the most prolific U.S tight oil play).
I would attribute the extent to which the industry is showing discipline in limiting the number of new wells to the lack of profitabilty within the tight oil industry, in general, during the heyday of development from 2008 to 2019. Reports put the fracking industry financial losses at over $300 billion from 2010 through 2020. I never heard NPR and other media sources ever present that angle of the tight oil industry during the heyday period.
[slide-anything id=’3472166′]
A taboo word for NPR news programs is depletion. In their world, oil production can always be made to go up irrespective of how much oil has been extracted from a field, play or region I suppose they get that idea from government agencies like the U.S. Department of Energy/Energy Information Administration (U.S. DOE/EIA).
Oil Production Projections from the U.S. DOE/EIA – A Trip into Fantasyland
The U.S. DOE/EIA has a history of exaggerated oil production projections which news organization, such as NPR, never look at. As an example, Table I contains projections of future oil production I made for the North Sea in 1999 and what the U.S. DOE/EIA was projecting in their Annual Energy Outlook 1999.
North Sea Oil Production Projections
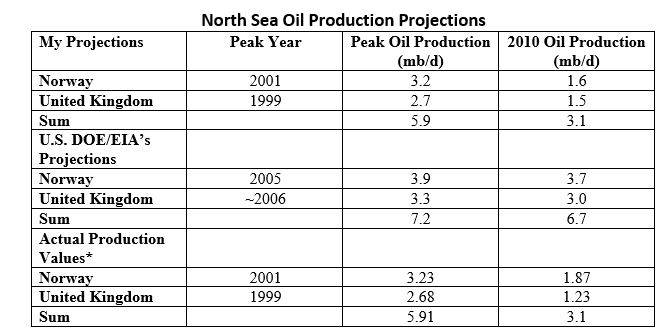
Table I
*Actual production values are from the U.S. DOE/EIA
The governments of Norway and the United Kingdom provide excellent oil field production data so it was not difficult to make reasonable projections of what future oil production would be from those two countries. It’s obvious that the U.S. DOE/EIA did not care to look at that data.
My impression is that projections from the U.S. DOE/EIA represent their political desires for future oil production, not an analysis of resource availability. They seem to prefer a comforting message as opposed to an accurate message.
In their Annual Energy Outlook 2010 (AEO2010), the U.S. DOE/EIA forecasted the future U.S. 48 States offshore oil production listed in Table II. Also in Table II are actual production values and the difference between the AEO2010 values and actual production values.
U.S./48 Offshore Oil Production Projections
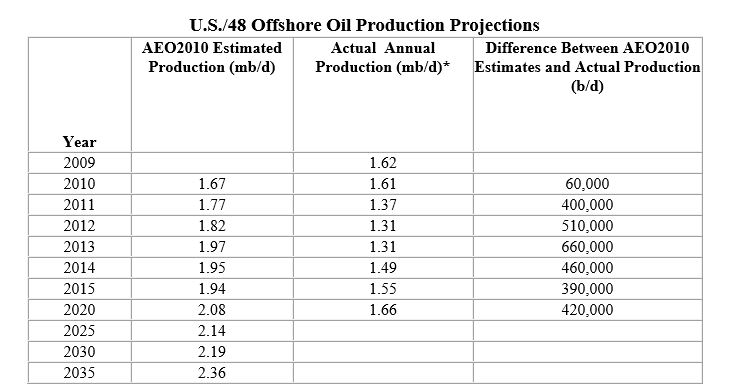
Table II
* Production data from the US DOE/EIA
To be fair to the U.S. DOE/EIA, oil production in the GOM went down in 2020 at least in part due to the pandemic but I think their projections for 2025, 2030 and 2035 are wildly optimistic.
Table III is a summary of the U.S. DOE/EIA oil production projections from their Annual Energy Outlook 2021.
U.S. DOE/EIA Annual Energy Outlook Oil Production Projections
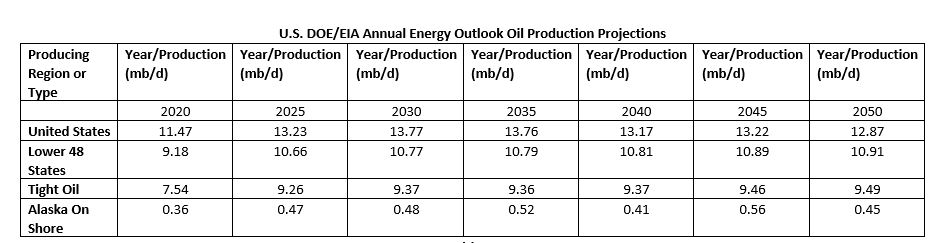
Table III
The numbers in Table III are incredible. Total U.S. oil production from 2020 to 2050 would be approximately 145 billion barrels and total tight oil production would be approximately 100 billion barrels. That is a lot of oil. Even with all that production from 2020 to 2050, the total U.S. and tight oil production rates would remain high in 2050 and beyond. I don’t see those projections as being in the realm of possibility.
For comparison purposes, the Bureau of Ocean Energy Management (BOEM) estimated as of Dec. 31, 2016 that the Gulf of Mexico Outer Continental Shelf, a fairly prolific oil province, had an estimated 23.73 billion barrels of oil in 1,315 fields.
Fracking of Shale Plays – NPR’s Oil Production Fantasy
Figure I illustrates the location of shale oil and gas plays in the U.S. so you have an idea where these plays are located. Several of the plays on the map are gas plays, specifically Marcellus, Utica and Haynesville.
Shale Oil and Gas Plays in the U.S.
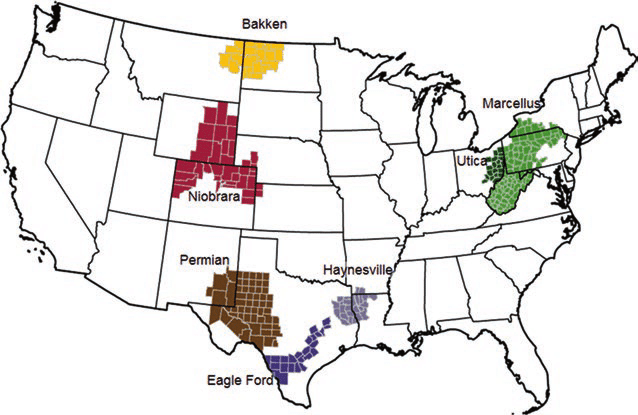
Figure I
Essentially all of the tight oil production increase from shale plays in the U.S. has come from 5 plays: Permian Basin, Eagle-Ford, Bakken, Niobrara and Anadarko. There was an intensive effort during the period 2008 through 2019 to increase production from those shale plays. But the question that must now be asked is “How are those shale plays doing, in terms of production, and what is their future?”
During the period 2008 through 2019, oil industry representatives, politicians, government bureaucrats and media sources pushed the narrative that the U.S. oil supply was nearly infinite due to the huge reserves of tight oil. I’m sure that was a very popular narrative with most of the American populous whose lifestyle is predicated on copious quantities of oil distillates.
A prime example of that narrative can be found in a Time magazine article of Jan. 3, 2019 titled “How an Oil Boom in West Texas Is Reshaping the World”. In the article, it states that “by 2025, U.S. oil production is expected to equal that of Saudi Arabia and Russia combined, according to the International Energy Agency.” Holy, moly that is impressive, Russia and Saudi Arabia have a combined oil field production of approximately 21 mb/d.
The tone of the Time article mirrored the statement from the International Energy Agency and mirrored numerous segments on NPR news programs. Since the start of the tight oil boom, NPR news programs have implied that there are huge reserves of tight oil that will maintain a high production level for many, many decades to come. What NPR news segments have never stated concerning tight oil is that the sweet spots within the plays are much less extensive than the overall play area and that tight oil wells decline rapidly, 70-90% by the end of their 3rd year (Trivial issues indeed).
Before going into detail concerning the 5 shale plays that produced essentially all of the increase in tight oil production from 2008 to 2019, let’s look at a Texas gas play, the Barnett shale. It was one of the truly hot plays in the early days of shale oil/gas development in the 2005-2010 period. At the peak of those early days, there were approximately 200 rigs drilling lots of holes in the Barnett shale.
Figure II is a graph of Barnett shale gas production for the period 2008 through 2021.
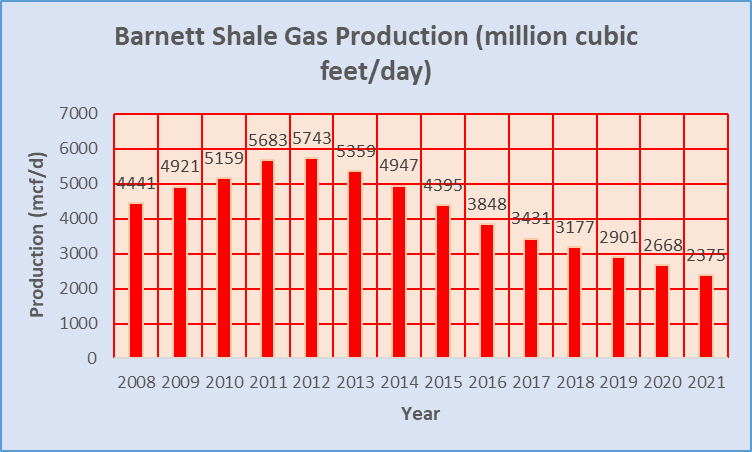
Figure II
*Data from the Railroad Commission of Texas as of May 3, 2022
Barnett shale gas production declined 58.65% from 2012 to 2021. The Barnett shale has been pretty thoroughly drilled up so there isn’t much need now for drilling rigs. As of early 2020, there was 1 drilling rig working in the Barnett shale play. What happened in the Barnett shale play is that the sweet spot was drilled up relatively quickly. Gas production has consistently declined since 2012 as wells get depleted.
In my opinion, 4 of the top 5 shale oil plays in the U.S.: Bakken, Eagle-Ford, Anadarko and Niobrara will not again reach previous production levels and will, in general, decline like what has happened in the Barnett shale.
I have followed oil production in the Bakken region of North Dakota closely over the years. Most of Bakken production is in North Dakota with a minor amount in Montana. Historically, of the 16 counties in the Bakken region of North Dakota, approximately 90% of oil production came from 4 counties: Williams, Mountrail, McKenzie, and Dunn (In Nov. 2021 the percentage was 92.8%).
Figure III is a graph of North Dakota Bakken oil production and the number of oil wells in December of each year*100 from 2008 through 2021.
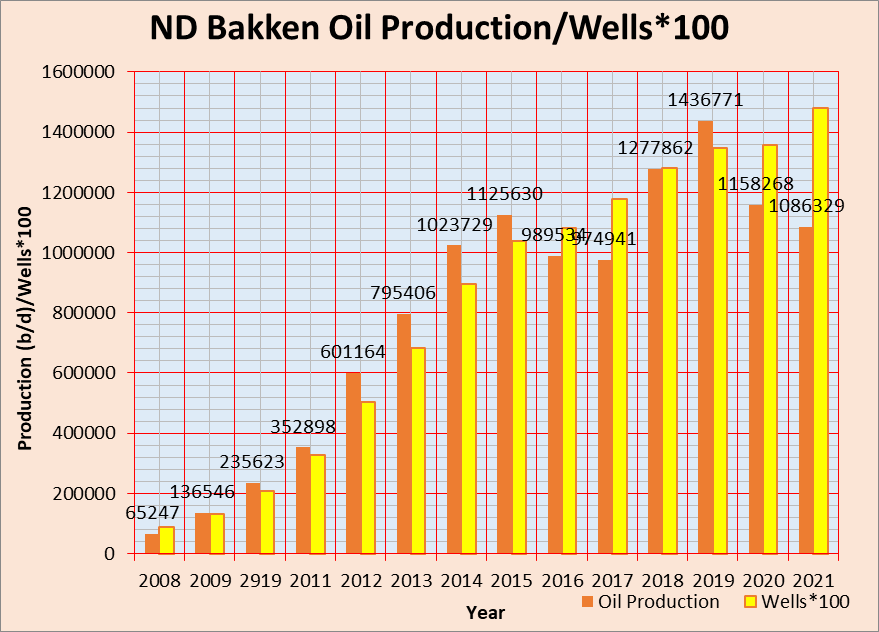
Figure III
*Oil Production values are labeled
**The number of wells are for the December of each year
***Data are from the state of North Dakota
Note that North Dakota Bakken oil production in 2021 was down 350,442 b/d (24.39%) relative to 2019 while the number of producing wells went up by 1,314 wells. Also worth noting is that the production rate in December of 2021 was lower than in January of 2021 and for the first 2 months of 2022, North Dakota Bakken production was down about 38,000 b/d relative to the 2021 average. These are not good signs for future Bakken oil production.
According to past published well data from the Bakken Weekly, it was common for wells in the sweet spot counties of the Bakken region of North Dakota to have initial well production rates of >500 b/d and frequently over 1,000 and 2,000 b/d back in the heyday (Some were even over 5,000 b/d). It was also common for wells outside of the sweet spot counties, but in the Bakken shale region, to have initial well production rates of <100 b/d.
The problem in the Bakken region of North Dakota is that the sweet spot counties have been largely saturated with wells and the economics of well development in the non-sweet spot counties is, to put it mildly, not good.
Figure IV is a graph of Eagle-Ford shale crude oil production for 2008 through 2021.
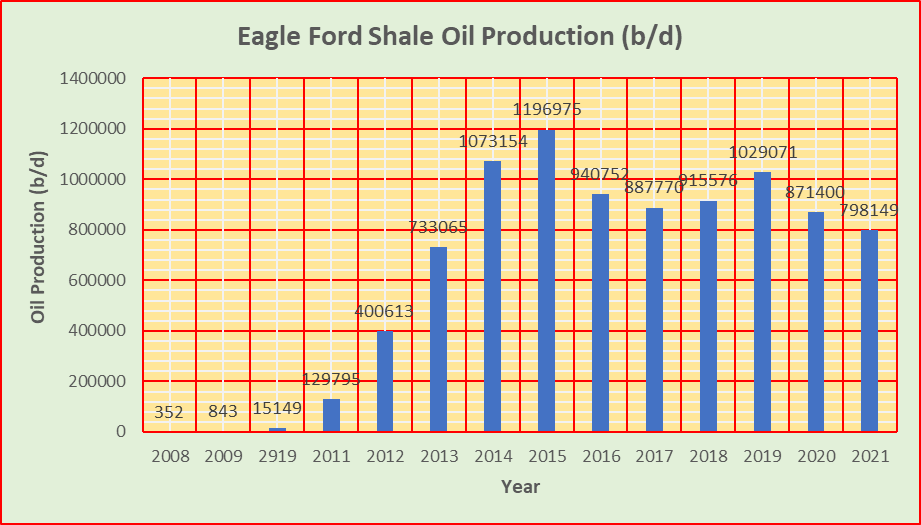
Figure IV
*Data from the Railroad Commission of Texas as of May 3, 2022
Crude oil production from the Eagle-Ford shale play was down approximately 400,000 b/d (~33.3%) in 2021 relative to 2015 according to data from the Railroad Commission of Texas, the entity that maintains oil production data in Texas. The Eagle-Ford shale region has largely been saturated with oil wells, resembling the Bakken play. Today there are over 16,000 horizontal oil wells in the Eagle-Ford shale play with total well numbers increasing at a similar rate compared to Bakken while production is not increasing.
Figures V and VI are graphs of Niobrara and Anadarko shale plays. In both cases it appears likely that production will not again reach the levels they had once attained.
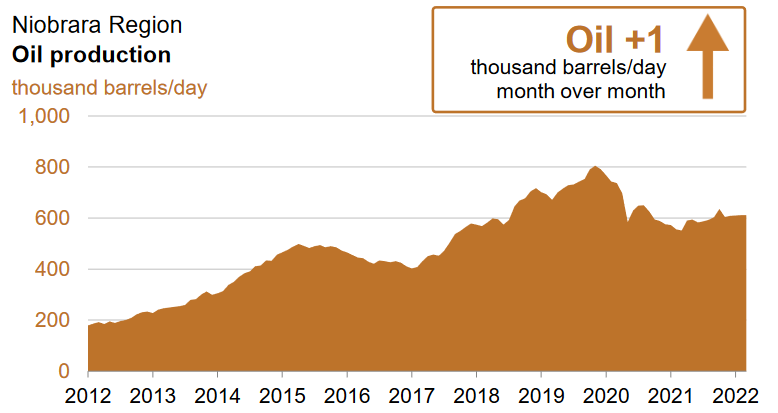
Figure V
*Graph from the U.S. DOE/EIA

Figure VI
*Graph from the U.S. DOE/EIA
In both Niobrara and Anadarko, the oil production rates, at present, are down approximately 200,000 b/d from their highest production levels.
Figure VII is a graph of Texas Permian Basin crude oil production. Data are from the Railroad Commission of Texas.
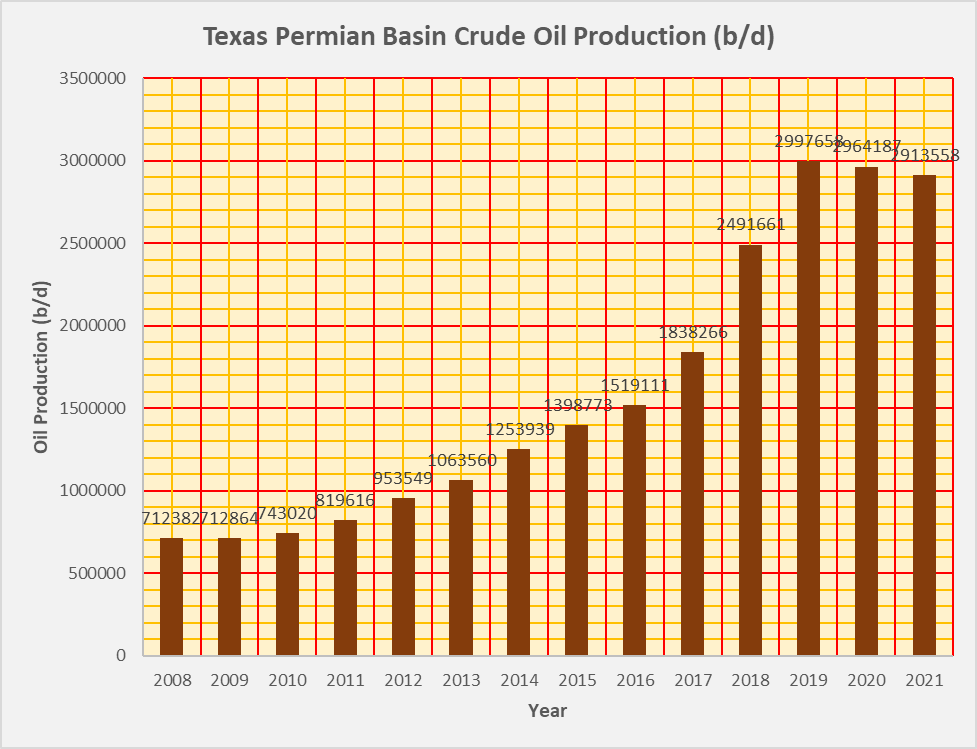
Figure VII
*Data from the Railroad Commission of Texas as of May 3, 2022
In 2021, Texas Permian Basin crude oil production was down approximately 84,000 b/d relative to 2019. With the elevated price of oil (presently ~$104/barrel), it is possible for Texas Permian Basin oil production in 2022 to exceed that of 2019 as development activity accelerates by sacrificing future production to the near term. But what is happening in the Texas Permian Basin is that the oil industry has to run faster and faster to stay in place.
It appears that Texas Permian Basin crude oil production is around its peak. I would consider the possibility of peak oil production in the Texas portion of the Permian Basin a serious matter because the Texas Permian Basin produces so much of the U.S. tight oil supply.
An interesting aspect of Permian Basin oil production is that in the last 4 years, production has ramped up rapidly in New Mexico by 788,000 b/d (See Table IV). The fact that Texas Permian Basin oil production has stopped its rapid rise while New Mexico’s production has ramped up rapidly in the last few years suggests that oil producers are looking more favorably to New Mexico than Texas. That isn’t a good sign for Texas.
New Mexico Oil Production

Table IV
How long can production continue to increase in New Mexico? I suspect it won’t be long before a peak is reached.
NPR news segments from 2008 through 2019 dealing with tight oil production came to look like cheerleading for the oil and gas industry. NPR highlighted oil industry representatives who were cheerleaders for fracking. Had they wanted to, NPR could have found petroleum geologists, petroleum engineers or other oil experts who could have provided a more tempered message for the future of fracking in the United States. But their tight oil news segments seem to have been designed to give their listeners what they wanted their listeners to hear. Basically it was happy talk.
A basic tenet of journalism is that everything should be questioned. Unfortunately for NPR news journalists, that isn’t the approach they took when it came to U.S. tight oil production.
The petroleum geologist Art Berman has stated that “the fracking boom is a retirement party for petroleum geologists”. I think that is an accurate characterization of what the fracking boom represents. What goes up rapidly can also go down rapidly. Don’t be surprised to see a fairly rapid decline of U.S. tight oil production in the future.
The Gulf of Mexico – When will the Party be over?
Figure VIII is a graph of oil production rates for the shallow and deep water Gulf of Mexico as well as total production from 1985 through 2021.
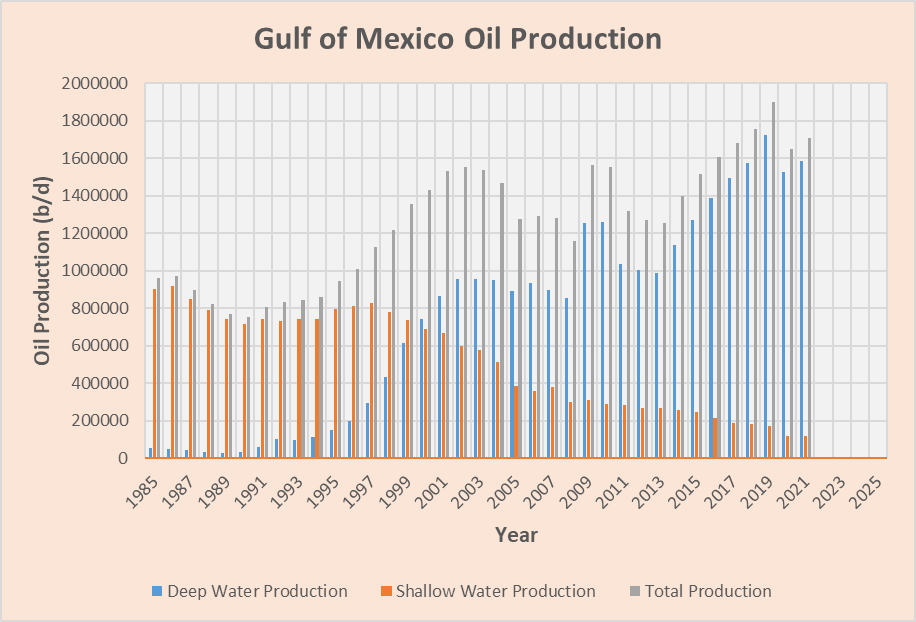
Figure VIII
*Data from the Bureau of Ocean Energy Management
From 1986 to 2021, shallow water GOM production declined by 86.9%. Depletion is the cause of the decline and no magic technology has prevented that from happening.
Deep water production reached its highest level in 2019 at 1.72 mb/d on an annual basis. A case can be made that the industry throttled back production in 2020 and possibly delayed new projects due to the pandemic.
Fields within the deep water GOM do not compare in size with fields like Prudhoe Bay, in Alaska, or the larger fields in the North Sea. Almost all fields are less than 400 million barrels of oil and most less than 200 million barrels. That sounds like a lot of oil but compared with the Prudhoe Bay field, with an Estimated Ultimate Recovery of ~12.3 billion barrels of crude oil, the deep water GOM fields are not large.
To maximize profitability of deep water fields, the industry cranks up production rapidly to a high production level, say 100,000 b/d or more, but peak production is reached within a year or two and generally followed by rapid decline.
In 2022, several fields will be brought on-line, most notably Mad Dog 2 and Vito. Those fields will ramp up rapidly but their fresh production will be superimposed on many declining older fields. We will have to wait and see how the production rate for the deep water GOM is influenced by those new fields in 2022 and 2023.
The deep water GOM is moving into an elevated state of maturity. I wouldn’t be surprised if production doesn’t again achieve the rate in 2019 but we should wait a few years and see what happens.
Alaska – Looking for another Heyday
Alaskan oil production started around 1960 in the Cook Inlet/Kenai Peninsula area. Oil production surged in the late 1970s with the development of the Prudhoe Bay and Kuparuk fields. Prudhoe Bay is much larger than Kuparak but both are large fields. Production peaked from the Prudhoe Bay field in 1988 and Alaskan production has gradually declined since then even with the addition of multiple smaller fields to production.
Figure IX is a graph of Alaskan oil production from 1973 through 2021.
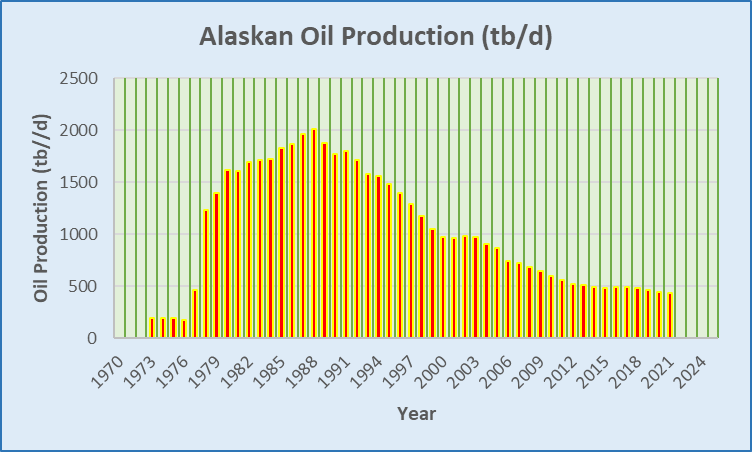
Figure IX
*Data from the U.S. DOE/EIA
Alaskan oil production in 2021 was down 1,580,000 b/d (78.3%) relative to the peak in 1988. The Prudhoe Bay field still produces approximately 230,000 b/d, a significant share of current Alaskan North Slope production. That is a long way from the approximately 1,500,000 b/d production rate at its peak (about 15% of peak production).
Production will continue to drift down in the presently producing fields so the desire of the oil industry is to add new production from the National Petroleum Reserve-Alaska (NPR-A), west of Prudhoe Bay, and conceivably the Arctic National Wildlife Refuge-Alaska (ANWR-A), east of Prudhoe Bay.
A few discoveries in the NPR-A have been made in recent years such as Willow, Willow West and Peregrine which explains the U.S. DOE/EIA projection in Table III for future Alaskan oil production. The Willow field is projected to start production in 2024/2025. Production from new fields will be superimposed on declining production from old fields which will limit any production rate increases for the state of Alaska.
Total U.S. Oil Production
Figure X is a graph of total U.S. oil production from 1930 through 2021.
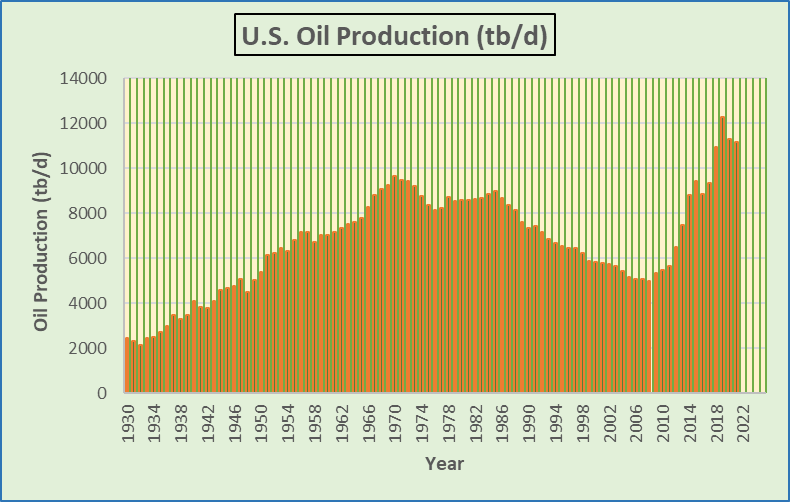
Figure X
*Data from the U.S. DOE/EIA
In 2021, U.S. oil production was down 1.10 mb/d relative to 2019. Higher oil prices in 2022 will increase oil development activity but 1.10 mb/d is a large hill to climb to get back to the 2019 level. Based upon weekly oil production data through May 1, 2022 from the U.S. DOE/EIA, it appears extremely unlikely that U.S. oil production in 2022 will exceed that of 2019.
What remains for possible oil development in the U.S. that is at least somewhat favorable in terms of geology are some areas of the Gulf of Mexico and the Arctic National Wildlife Refuge in Alaska.
The Biden administration opened another 80 million acres within the Gulf of Mexico to oil and gas development in 2021. Shell, BP, Exxon Mobil and Chevron offered $192 million for drilling rights on about 1.7 million acres. The 80 million acres has an estimated 1.1 billion barrels of recoverable oil. That is a fairly trivial amount when you consider that in 2021 the U.S. consumed approximately 7 billion barrels of liquid hydrocarbons. Right now the 80 million acres is in judicial limbo and will be for some time.
It’s hard to tell when, or if, ANWR-A will ever be developed for oil and gas. In my view, it will probably be comparable in production potential to the NPR-A. I think 3-4 billion barrels is about the best to be expected for economic recoverability. That would have a minor impact on total U.S. oil production in the future.
Over the years I have seen estimates of recoverably oil in ANWR-A of up to 300 billion barrels. It’s amazing the degree to which some people in the oil industry can exaggerate. The objective of the exaggeration is to make ANWR-A sound so good that it can’t be passed up as a place for oil development.
Conclusion
Since 2019, the cheerleading of the fracking boom by the mainstream U.S. media has gone silent. It’s not unusual that there wasn’t media coverage in 2020 because of the downturn in oil production due to low oil prices but with prices increasing substantially in 2021 and 2022, there is still no cheerleading coverage of tight oil production that I have encountered. I attribute that to the fact that production is no longer booming.
In response to the Russian/Ukraine conflict, I have heard several politicians and media personalities’ state that the U.S. should crank up U.S. oil production. The individuals I have heard made it sound like all the industry had to do is open some valves and U.S. oil production would surge. It doesn’t quite work like that.
Due to the elevated price of oil at present it’s realistic that U.S. production will increase this year as future development is shifted into the near term. That doesn’t mean that depletion has disappeared, just masked a bit.
Making up 1.10 mb/d to get back to the 2019 production level will be a considerable challenge and I think there is a significant possibility that 2019 will be the peak year of U.S. oil production associated with tight oil development. A few more years of production below the 2019 level would confirm that conclusion.
Teaser photo credits: By Antandrus at English Wikipedia, CC BY-SA 3.0, https://commons.wikimedia.org/w/index.php?curid=16373401


