An Overview
At this point in time, probably all American adults are aware that the price of oil, or at least gasoline and diesel fuel, are much higher than they have been in recent years. Human nature being what it is, it’s necessary to find a scapegoat for the high prices.
From the conservative point of view, it’s obviously the president, a Democrat, who is the cause of the high prices. The president must be impeding oil development throughout the U.S. even though almost all geologically fruitful areas for oil development in the U.S. are open for development and have been for a long time. It should be pointed out that the president hasn’t prevented U.S. oil production from going up 263,000 b/d in the first quarter of this year compared to the 2021 average.
It appears that a significant portion of the 263,000 b/d increase has been due to the fracking industry completing thousands of drilled but uncompleted (DUC) wells in recent months. Most of the production increase from shale plays has come from the Permian Basin, by far the largest shale play in the U.S., so I found this recent quote interesting:
“The supply chain seems stretched to the max in the Permian Basin. There really is not much ability to increase drilling activity.” An executive at an oilfield service company, quoted by Oilprice.com
Secondly, the president must have instituted regulations that are impeding gasoline and diesel fuel production. Whatever the president may be doing, he hasn’t prevented the refinery industry from exporting large amounts of gasoline and diesel fuel.
According to U.S. Department of Energy/Energy Information Administration (U.S. DOE/EIA) data for the week ending 6/10/22, U.S. refiners exported 926,000 barrels/day (b/d) of gasoline and 1.379 million barrels/day (mb/d) of distillate fuel oil (diesel fuels and fuel oils are included in this term).
From the liberal/progressive point of view, it’s clear that it’s the oil industry with their nefarious machinations’ that are causing the high prices. Petroleum corporations are obviously colluding to limit production of oil, gasoline and diesel fuel that is leading to high gasoline and diesel fuel prices.
From an international perspective, the war in Ukraine and the sanctions on Russia or countries like Saudi Arabia that don’t increase oil production significantly are causing the high oil prices.
Could it be that there is a politically less appealing but a more realistic explanation for what is causing high oil prices?
The basic view I hear from Americans is that oil production can go up, whether in the U.S. or throughout the world, because there are an innumerable number of oil containing regions that can be drilled if the U.S. government, and other governments, would just get out of the way. I hear the same basic view expressed by media commentators, whether conservative, liberal or something in between.
Many Americans appear to think that oil can be found anywhere. All an oil company has to do is drill a hole deep enough and oil will come out. Although that sounds appealing, the problem is that specific geologic circumstances are required to create and trap oil. That is why oil is found in specific locations. Because many Americans, including politicians, don’t want to accept that fact there are political debates about opening areas in the U.S. that at best contain trivial amounts of oil.
Interestingly, I have not seen nor heard any news stories from the mainstream media, or non-mainstream media for that matter, that have suggested that depletion may be a factor for high oil prices.
The Elephants in the Room
For this report I will focus on crude oil + condensate, what most people think of when they think of oil that comes out of the ground. The data for graphs representing oil production of countries comes from the U.S. DOE/EIA.
Most of the oil that has been produced up to now has been conventional oil (oil that comes out of the ground due to reservoir pressure or that is pumped out) from conventional oil fields and most of that oil has come from what are termed elephant fields. I will consider an elephant oil field as one that falls into one of three categories:
1). A giant field with an Estimated Ultimate Recovery (EUR) of 0.5-5.0 billion barrels (Gb) of oil
2). A supergiant field with an EUR of 5.0-50.0 Gb of oil
3). A megagiant field with an EUR of 50.0+ Gb of oil
There are several megagiant fields (Ghawar-Saudi Arabia and Burgan-Kuwait) globally and less than 50 conventional supergiant fields. Elephants are typically found early is the exploration process because they are large and easy to find.
A mere 120 of the world’s largest oil fields produced ~32 mb/d of oil in 2000, almost half of the world’s daily production that year. The world’s 15 largest oil fields produced approximately 22% of the world’s daily oil production in 2000. The point here is that a small number of large conventional oil fields make up a significant proportion of our oil supply.
Most of the world’s conventional oil has been found, and most of that oil was found in elephants. Figure 1 is a graph of global oil discoveries as a function of time:

Figure 1*-Oil discoveries and production *From the Internet
The large spikes in Figure 1 are associated with the discovery of large elephants, fields like Ghawar, Burgan, Samotlor, etc. For quite a while now, global oil production and consumption have been considerably higher than the rate of new discoveries.
Elephants can produce oil for an extended period of time, often decades, at very high rates. The problem with having a high production rate is that even a large oil field has a limited amount of oil. At some point even the largest oil fields will go into decline and when they do, they can decline at impressive rates.
Figures 2-7 are examples of prominent elephant fields that have gone into decline:


Figures 2-7*-Graphs of elephant oil fields that are in decline *From the Internet
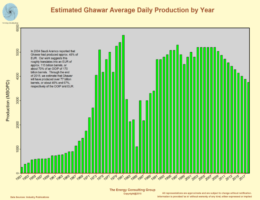
Figure 2 is a graph of Ghawar oil field production (Saudi Arabia), the largest conventional oil field in the world. It has a EUR of 110-120 Gb and had a maximum production rate of over 5 mb/d. According to a recent report (2019) out of Saudi Arabia, it was producing ~3.9 mb/d as of 2019.
Figure 3 is a graph of Samotlor field oil production (Annual versus Cumulative), the largest field in the Former Soviet Union and 7th largest oil field in the world. At its peak, it was producing at a rate of approximately 3.2 mb/d. The EUR for Samotlor is approximately 22 Gb.
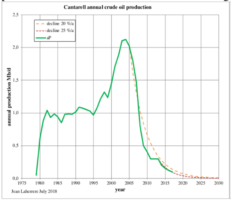
Figure 4 is a graph of Cantarell Complex oil production (Mexico), the largest complex in the western hemisphere. Cantarell consists of 4 fields-Akal, Nohoch, Chac and Kutz. Akal is by far the largest of the 4 fields. Production reached its highest rate in 2004 at 2.1 mb/d. Today it produces at roughly 1/10th of the peak production rate. The EUR for Cantarell is approximately 19 Gb.
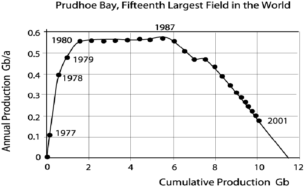
Figure 5 is a graph of Prudhoe Bay field oil production (Annual versus Cumulative), the largest field in the United States at ~12 Gb. Maximum production occurred in 1988 at 1.5 mb/d. Today the production rate is approximately 0.2 b/d.
Figure 6 is a graph of Statfjord field oil production, the largest field in the Norwegian sector of the North Sea, with a EUR of ~4.2 Gb. The production rate peaked at 646,000 b/d in 1991. The production rate in 2021 was approximately 15,000 b/d, a decline of approximately 98%.
Figure 7 is a graph of Forties field oil production (annual versus cumulative), the largest field in the U.K. sector of the North Sea with a EUR of ~2.5 Gb. Forties field oil production peaked in 1980 at 523,000 b/d. In 2021, the production rate was approximately 20,000 b/d, a decline of approximately 96%.
After the Arab oil embargo of the 1970s, there was an intense effort globally to increase oil production outside of OPEC nations. The effort was particularly intense in Alaska, the North Sea and Mexico but it went well beyond those regions.
The Impact of Declining Elephants
If an elephant produces a significant portion of the total production for a region, say over 30%, then when the field goes into decline that can lead to the region going into decline even if smaller fields are added to the production base within the region. Three obvious examples of this are Alaska, the North Sea, and Mexico.
Alaska-Figure 8 is a graph of Alaskan oil production from 1973 through 2021:

Figure 8-Alaskan oil production
Alaskan oil production surged in the 1970s with the addition of the Prudhoe Bay field (EUR ~12 Gb). Since 1988, when the Prudhoe Bay field reached its maximum production rate, many smaller fields have been added to the North Slope of Alaska but that hasn’t stopped the inevitable decline of Alaskan oil production. Alaskan oil production reached a peak of 2.02 mb/d in 1988. As of 2021, it was producing 0.437 mb/d, a decline of 78.4%.
North Sea-North Sea oil production surged in the 1970s and 1980s. There are a large number of oil fields in the North Sea, many of them elephants. Impressive production rates were achieved for those elephants but it didn’t take long before production declined in those fields.
Figure 9 is a graph of North Sea oil production from 1973 through 2021:

Figure 9-North Sea oil production
North Sea oil production peaked in 1999 for the sum of Norway, United Kingdom and Denmark at 6.003 mb/d. The production rate plateau in recent years is due largely to the addition of the Johan Sverdrup field (EUR 1.9-3.0 Gb).
As of 2021, North Sea oil production was 2.649 mb/d, a decline of 55.9% from the 1999 rate. North Sea oil production will start to decline again in a few more years as the Johan Sverdrup field goes into decline.
Mexico-Figure 10 is a graph of Mexican oil production:

Figure 10-Mexican oil production
Mexican oil production increased rapidly in the 1970s with the addition of the Cantarell Complex. Nitrogen injection of the Cantarell reservoirs in the late 1990s/early 2000s led to Cantarell achieving a production rate of 2.1 mb/d in 2004.
Cantarell Complex oil production declined rapidly after 2004. The state oil company, Pemex, to a degree replaced declining production from Cantarell with new production from the Ku/Maloob/Zaap (KMZ) project, brought on-line in 2002, but that didn’t prevent Mexican oil production from peaking in 2004 at 3.476 mb/d and then going into decline. As of 2021, the production rate for Mexico had declined to 1.734 mb/d, a decline of 50.1% from the 2004 value.
The Ku-Maloob-Zaap Complex reached a production rate of 839,200 b/d in 2010 and 853,000 b/d in Nov. 2015. The production rate was down to 770,000 b/d in July 2019 and 719,000 b/d in 2021. The Ku-Maloob-Zaap Complex is a complex in decline.
To address the decline of conventional elephants, the oil industry has taken 4 measures. A problem with those measures is that they tend to be more expensive per unit of oil produced. A second problem is that they generally come with more extensive environmental problems.
First, smaller fields are developed in an attempt to replace declining production from elephants.
Second, the oil industry has gone into deeper and deeper offshore areas. Deep water oil development is defined as oil extraction in water depths >1000 ft. Deep water offshore development mainly occurs in 4 countries: U.S., Brazil, Norway and Angola but the impact of deep water development has mainly been in the U.S. and Brazil. Interestingly, oil production in Angola has generally declined since 2008 when the production rate was 1.951 mb/d. In the first quarter of 2022, Angola’s oil production rate was 1.168 mb/d.
In 2021, offshore oil discoveries fell to a 75 year low. The argument put forward is that low oil prices inhibited exploration. That said, there is a problem in that the most fruitful offshore areas have now been pretty extensively explored, including the deep water areas.
Third, extra heavy oil and oil sands can be developed in countries like Venezuela and Canada. Extra heavy oil is oil that has a high viscosity (it doesn’t flow well). Venezuela has a region called the Orinoco Oil Belt that contains a considerable amount of extra heavy oil. Canada is the most prominent country with regard to oil sands. The oil sands in Canada are located in the Athabasca region of Alberta.
Fourth, in the U.S. and a few other countries, the oil industry has pushed a process called fracking. Fracking involves using high pressure fluid to break up shale formation rock to release oil and gas. Fracking is combined with horizontal drilling in which a well can have a horizontal deviation of miles. A well pad may have on the order of 10 horizontal wells that go off in various directions.
Fracking has been very effective in the U.S. Between 2008 and 2019, tight oil production from fracking increased ~7.3 mb/d in the U.S. The downside of fracking is that the well production rate declines 70-90% by the end of the third year of production, the sweet spots within shale plays are typically much smaller than the overall play extent and fracked wells are quite expensive. According to media reports in the U.S., the shale industry lost over $300 billion during the 2010-2020 period.
Fracking combined with horizontal drilling has been going on in the U.S. for over 15 years but it hasn’t been a significant factor increasing oil production in other countries for a variety of reasons from environmental, technical, political, economic, property and mineral rights issues, and infrastructure limitations. It’s not clear when, or if, fracking will play a major role for oil production in other countries.
Today it is highly unusual to find a conventional oil field of a billion barrels of oil or more (I’m aware that Iran is claiming a recent find of over 50 Gb. I am always wary of exaggerated claims and this article highlights problems with the Iranian claim: https://oilprice.com/Energy/Crude-Oil/The-Truth-Behind-Irans-Massive-Oil-Find.html).
Global Oil Production
Figure 11 is a graph of global oil production from 1973 through the first quarter of 2022:

Figure 11-Global oil production
Global oil production increased approximately 8 mb/d from 2008 to 2019. Almost all of that production increase was due to an unconventional oil production increase within the U.S., most of it from fracking. The remainder of the increase in the U.S. was from deep water Gulf of Mexico oil production.
The decline in global oil production in 2020 relative to 2019 (6.15 mb/d) was due to the COVID pandemic that caused a significant decline in oil demand. Since then, demand has picked back up to the point where oil prices have risen significantly.
It will be difficult to increase global oil production back to the rate of 2019 in 2022 and beyond because some of the decline that has occurred since 2019 is associated with declining oil fields and second, it will be difficult to raise U.S. tight oil production significantly beyond the 2019 level.
First quarter 2022 global oil production has picked up but it’s considerably below the production rate prior to the pandemic. The difference between the first quarter 2022 and fourth quarter 2018 production rates is 4.074 mb/d. Fourth quarter 2018 was the quarter with the maximum global production rate achieved before the pandemic.
In a separate report, ”The Status of U.S. Oil Production”, https://www.resilience.org/stories/2022-05-04/the-status-of-u-s-oil-production/, I made the case that 4 of the top five oil shale plays in the U.S. will not again produce at the maximum rate they had achieved in the past. The Permian Basin, the fifth play, can exceed the maximum rate of 2019 because of the present elevated price of oil but there are serious future problems for the Permian Basin that will lead to a production decline in the not-too-distant future.
Figure 12 is a graph of global oil production – U.S. oil production from 1973 through the first quarter of 2022:

Figure 12-Global Oil Production – U.S. Oil Production
What is evident from Figure 12 is that global oil production outside of the U.S. did not increase much from 2008 to 2019. In 2008, global oil production – U.S. oil production was 69.30 mb/d. In 2019, global oil production – U.S. oil production was 69.86 mb/d, an increase of 0.56 mb/d over 2008.
Global oil production outside of the U.S. increased only marginally from 2008 to 2019. Some countries, such as Canada, Brazil, United Arab Emirates (UAE), and Kuwait had oil production increases from 2008 to 2019 as shown in Table I:
| Country | Canada | Brazil | United Arab Emirates | Kuwait |
| Oil Production Increase (tb/d) | 1,829 | 969 | 666 | 235 |
Table I
The sum of the increase for the countries in Table I is 3.699 mb/d.
Other countries had production decreases. Figure 13 is a graph of oil production from 1980 through the first quarter of 2022 for countries that had their maximum oil production rate prior to 2006, achieved a maximum production rate of at least 150,000 b/d and have declined at least 25% since their maximum production rate.

Figure 13-Summed Oil Production for Countries in Decline with a Production Peak prior to 2006*
*Mexico, Norway, United Kingdom, Denmark, Indonesia, Argentina, Syria, Australia, Brunei, Chad, Egypt, Equatorial Guinea, Gabon, Malaysia, Romania, Trinidad/Tobago, Vietnam, Yemen, Peru
For the countries in the graph of Figure 13, summed oil production reached its highest rate in 1997 at 17.60 mb/d. In the first quarter of 2022, the summed production rate had declined to 10.26 mb/d, a decline of 7.34 mb/d or 41.7%.
Syria and Yemen are included in the graph of Figure 13 even though both have been involved with wars in recent years. Their peak production rates occurred well before the wars started and they were both in steady decline prior to the wars so they were included in the graph.
Other countries started declining after 2005. Examples include Azerbaijan (-31.30% from 2010 to 2021), Angola (-42.23% from 2008 to 2021) and Algeria (-33.55% from 2007 to 2021).
According to the U.S. DOE/EIA oil production data page for countries on their website, over 150 countries had a 2021 oil production rate of less than 20,000 b/d and most of those countries produced no oil at all. For countries where the geological past didn’t involve the generating and trapping of oil, the countries have little or no oil to produce.
Figure 14 is a graph of historical conventional oil production and a prediction of future production:

Figure 14*-Historical conventional oil production (blue) and a prediction of future production (red) *From the Internet
Conventional oil production has trended down in recent years as Figure 14 illustrates. If the prediction of the graph for future conventional oil production is reasonably accurate, the production rate will decline at a higher rate in the not-too-distant future.
Estimates of the global ultimate recovery of conventional oil have historically fallen in the range of 2000-2500 Gb. By my calculations, global cumulative oil production through 2021 was 1460 Gb. The 1460 Gb figure would also include some unconventional oil production as well. In 2022, global oil extraction will be approximately 29 Gb.
For the purposes of this report, I will consider unconventional oil production to include extra heavy oil/oil sands, deep water oil, and tight oil from fracking. Oil production from these sources has been increasing in recent years and some people argue that unconventional oil can replace a decline from conventional sources.
Is that realistic? We will explore that in future parts of this report under the countries that conceivably have unconventional oil resources worth exploiting and we’ll also look at what’s happening in important specific regions of the globe such as the Middle East. Let’s explore the Middle East in Part 2.
Teaser photo credit: An oil platform in Mittelplate, Wadden Sea. By Ralf Roletschek – Own work, CC BY-SA 3.0 de, https://commons.wikimedia.org/w/index.php?curid=16338452


