Ed. note: You can find Part 1 and Part 2 of this series on Resilience.org here and here.
Coming closer to consumption
Almost 3,000 kcal per person per day is made available for consumers, who “need” in the range of 2,100 kcal per person per day. “Made available” should be understood as carried from the shop (if you are a consumer in a market society), brought into the household from your farm (if you are a self-sufficient homesteader, or the raw materials used in a restaurant (if you eat out). Of the difference food waste and metabolic food waste (causing obesity) probably contribute in a similar way (i.e. people waste >400 kcal per day and eat 400 kcal “too much” in average).
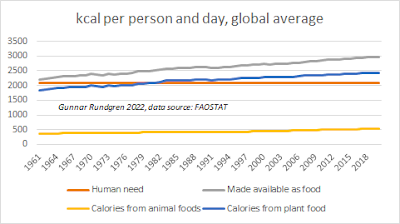
The graph above shows what is made available as food. Now let’s look at the total output of crop production and compare that with what is made available as food. Now we stick only to crops and leave out animal foods. I’ll come back to the animal foods in the end.
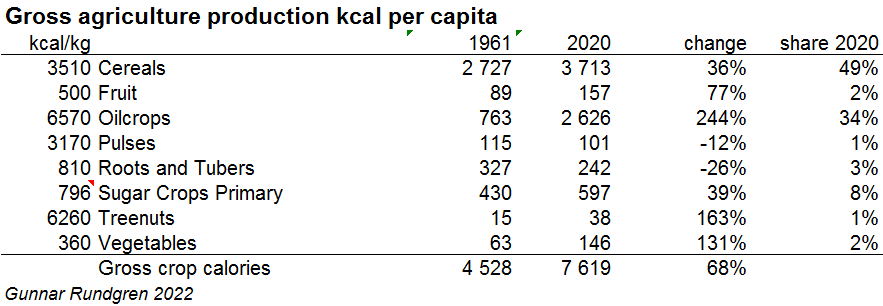
The gross crop output in energy per capita increased from 4,528 kcal 1961 to 7,619 kcal 2020, an increase with 68 percent. The biggest increase came from oilcrops while the total contribution is still dominated by cereals. The gross output is 2.5 times bigger than what is made available to humans. One could be tempted to claim that we could feed 20 billion people on the vegan diet. But then humans can’t really eat all those crops even if they wanted to. Many crops have a theoretical energy content which is quite different from the edible energy content. Oil crops like rape seed and sunflower could theoretically be edible directly, but in reality humans consume the oil directly and while the seed cake is fed to animals. The same goes for many grains where one can calculate the energy harvest based on the full kernels but most wheat is consumed as white flour, which is just around 80% of the wheat kernel (I elaborated on this in my previous article).
[slide-anything id=’3472166′]
Of the gross output in weight 6% is lost in the production, trade and processing, not including consumer waste, 2% is used as seed, 14% is used directly as feed, 37% is processed into various products such as biofuel, beer, spirits, candy, cosmetics, starch, biodegradable plastics, cotton, vegetable oil and sugar – of which biofuels, vegetable oil and sugar are most important. Much of the leftovers are used as feed (more about that here and here), a lot is used as fuel (e.g. the leftovers from the sugar cane processing) and 41% is used as food.
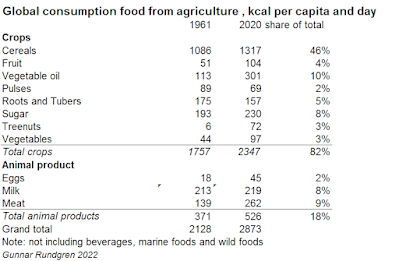
In the end we get a supply of 2,837 kcal per capita from crops (82%) and animal products (18%), not including marine foods and beverages. It is also quite notable that despite all the fuss about consumption of animal products they contribute around 18% of the calories 2020 compared to 17% 1961. The “enormous increase in meat consumption” is caused by three factors: population growth explains half of the increase, and the increase of food consumption in general one quarter and actual increase in share of meat the last quarter.
In my next article in this series I will discuss how the enormous increase in production has been possible.
Teaser photo credit: By OpenIDUser2 – http://trashwiki.org/en/File:Luxembourg_dumpster.jpeg, GFDL, https://commons.wikimedia.org/w/index.php?curid=26747239