It’s common to hear from old time residents of the Eastern Upper Peninsula (EUP) of Michigan that the winters just aren’t what they used to be. That can be said for recent complete years and decades as the data for Sault Ste. Marie in Table I illustrates:
Decadal Temperature Averages for Sault Ste. Marie
| Decade | Average Temperature (oF) | |
| 1890-1899 | 39.47 | |
| 1900-1909 | 39.86 | |
| 1910-1919 | 39.40 | |
| 1920-1929 | 39.56 | |
| 1930-1939 | 40.84 | |
| 1940-1949 | 40.36 | |
| 1950-1959 | 40.23 | |
| 1960-1969 | 39.86 | |
| 1970-1979 | 39.77 | |
| 1980-1989 | 40.18 | |
| 1990-1999 | 40.85 | |
| 2000-2009 | 42.14 | |
| 2010-2019 | 42.82 | |
| 2020 | 44.44 | |
| Table I | ||
Sault Ste. Marie ended the year 2020 with an average temperature of 44.44oF, 4.87oF above the 1971-2000 average. That is a long way from the typical year In the 1960s or 1970s.
Figure I is a graph of the data in Table I:
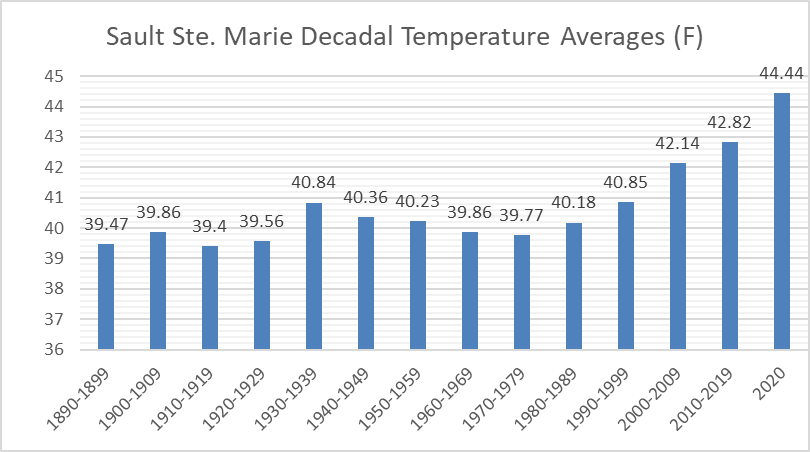
Figure I
Last year (2020) turned out to be a relatively warm year, the 5th warmest year on record (since 1888), as Table II highlights:
Warmest Years on Record for Sault Ste. Marie
| Rank | Year | Average Annual Temperature (oF) |
| 1 | 2012 | 45.71 |
| 2 | 1998 | 45.52 |
| 3 | 2016 | 44.91 |
| 4 | 2010 | 44.77 |
| 5 | 2020 | 44.44 |
| 6 | 1931 | 44.28 |
| 7 | 2006 | 43.82 |
| 8 | 2017 | 43.80 |
| 9 | 2001 | 43.77 |
| 10 | 1987 | 43.38 |
| Table II | ||
Back when I was a kid, in the good old days when we had to walk 2 miles to school and 2 miles back home uphill both ways (an interesting historical phenomenon), I can distinctly remember in winter often thinking I had a frostbitten nose, fingers or toes. That is not so much an issue anymore.
Of course we can still have cold periods as the winters of 2013/2014 and 2014/2015 illustrate (2014 was the last year in which the annual average temperature was below the 1971-2000 average). You may remember during that period hearing the term “polar vortex” more than you cared to hear it. Those cold winters were the result of a persistent jet stream flow pattern in which the flow came out of the Arctic into this region. What was interesting about those winters was the persistence of the pattern, which lasted for months.
A jet stream flow pattern like that involves a wave in the jet stream in which warm air from the south flows up to the Arctic into Alaska and cold air flows down from the Arctic into this region. In a pattern like that when this region is cold relative to average, northern Alaska is generally warm relative to average. As an example, in December 2013 when the average temperature deviation of Sault Ste. Marie, relative to the 1971-2000 average, was -7.65oF, the deviation in Prudhoe Bay, Alaska was +7.90oF.
[slide-anything id=’3472166′]
Even when we have relatively warm years such as 2020, there can be months when the monthly average temperature is below the 1971-2000 average as Table III illustrates:
Monthly Temperature Deviations in 2020 for Sault Ste. Marie
Relative to 1971-2000
| Month | Temperature Deviation (oF) | |
| January | +11.89 | |
| February | +5.24 | |
| March | +5.60 | |
| April | -0.45 | |
| May | +0.60 | |
| June | +3.92 | |
| July | +6.40 | |
| August | +3.82 | |
| September | +1.45 | |
| October | -2.18 | |
| November | +8.12 | |
| December | +7.42 | |
| Table III | ||
For those who pay attention to the weather, it was fairly obvious that October and to a lesser extent April were relatively cold last year. Again, it was due to a jet stream pattern in which the flow was coming from the north or northwest.
Three months for the year 2020 had monthly average temperatures within the top 5 in recorded history (1888 to present):
January 2020, at an average temperature of 25.06oF, was the second warmest January on record behind January 1932 at 27.39oF.
July 2020, at an average temperature of 70.31oF, was the fourth warmest July on record behind July 1931 (74.20oF), 1955 (70.63oF) and 2011 (70.53oF).
November 2020, at an average temperature of 40.52oF, was the second warmest November on record behind 1931 at 40.72oF.
As the data above for January, July and November indicate, something must have been going on in 1931-1932. During 1931-1932 there was a strong El Nino. An El Nino involves a warming of the waters of the equatorial Pacific Ocean. Generally when there is an El Nino, the average temperature in this region will be among the warmer years on record as warm air from the Pacific Ocean region migrates over to this region.
Generally when there is a La Nina, the average temperature in this region will be among the colder years on record. A La Nina involves a cooling of the waters of the equatorial Pacific Ocean. What was unique about 2020 was that a La Nina developed during the year, mainly from June on and got progressively stronger. In spite of the La Nina, later months of 2020 were relatively warm in this region.
Table IV highlights the temperature changes per decade from the 1970s on as a function of season for Sault Ste. Marie.
Seasonal Changes by Decade for Sault Ste. Marie
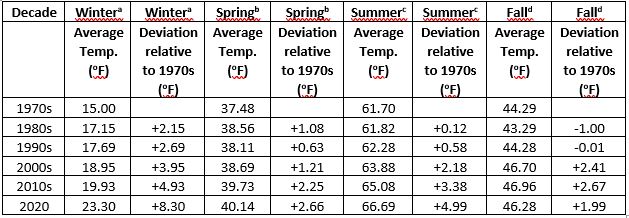 Table IV
aWinter-December, January and February. The December is for the previous year so winter 2020 represents December 2019, January 2020 and February 2020
bSpring-March, April and May
cSummer-June, July and August
dFall-September, October and November
What is obvious from the data in Table IV is that the largest deviations have occurred in winter and summer. The trend doesn’t bode well for winter outdoor activities such as ice fishing. Considering how warm it has been so far this winter, as of mid-January, I would be hesitant to walk around on the ice of a large, or even small, lake.
Table V contains the 10 coldest years on record for Sault Ste. Marie.
Coldest Years on Record for Sault Ste. Marie
| Rank | Year | Average Annual Temperature (oF) |
| 1 | 1917 | 35.34 |
| 2 | 1904 | 36.65 |
| 3 | 1907 | 37.02 |
| 4 | 1926 | 37.25 |
| 5 | 1893 | 37.55 |
| 6 | 1912 | 37.57 |
| 7 | 1950 | 37.64 |
| 8 | 1924 | 38.02 |
| 9 | 1980 | 38.38 |
| 10 | 1943 | 38.42 |
| Table V | ||
The late 1800s and early 1900s were relatively cold in this region compared to today.
Annual average temperatures vary from year to year due to such phenomena as the general flow direction of the jet stream in this region through the year, whether from the north, south or west, as well as El Nino’s or La Nina’s. I expect the next El Nino to occur in 2022-2023 at which time there is a reasonable possibility of breaking the annual high temperature record for Sault Ste. Marie.
Based upon the temperature data for January-March, 2021 could be a warm year for Sault Ste. Marie because it was the sixth warmest January-March period on record for the Soo.
Of course the climate data above for Sault Ste. Marie, MI is only one point on the globe. What’s happening at other locations in northern North America?
Northern North American Climate Data
Table VI contains temperature (oF) deviation data for 8 other northern North American locations for the period 2010-2020, relative to 1971-2000 averages.
Temperature Deviation Data (oF) for Northern North American Locations Relative to 1971-2000 Averages
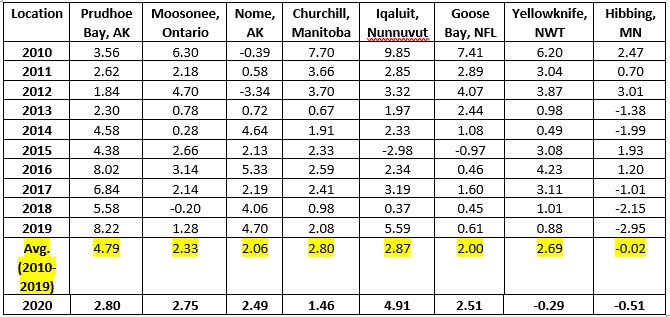 Table VI
A noteworthy aspect of the data in Table VI are the averages of temperature deviation for 2010-2019, which are highlighted. All locations but one have positive deviations and the one location with a negative deviation, Hibbing, is only negative by 0.02oF. Prudhoe Bay is noteworthy for having a positive deviation of 4.79oF.
Northern North America was relatively warm during the later months of 2020 in spite of a La Nina that got progressively stronger during the year, as can be seen in Figure II below for Dec. 2020:
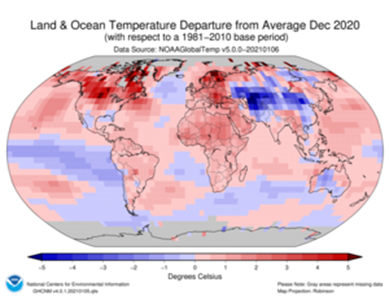
Figure II
Note the band of cooler water, relative to average, in the Pacific Ocean along the equator signifying the La Nina.
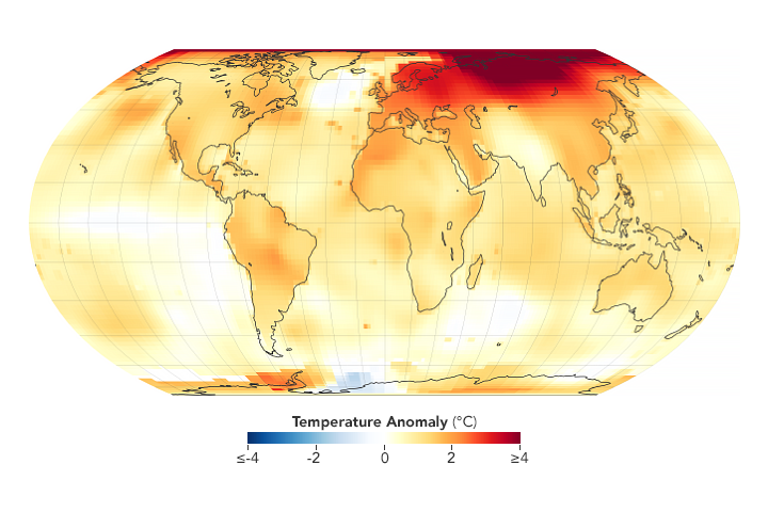
Of course the data in Table VI is only for one region of the globe. Figure III is a temperature deviation map of the globe for 2020, relative to the 1951-1980 average (note not 1971-2000).
Temperature Deviation Map for 2020 from NASA Relative to 1951-1980 Average
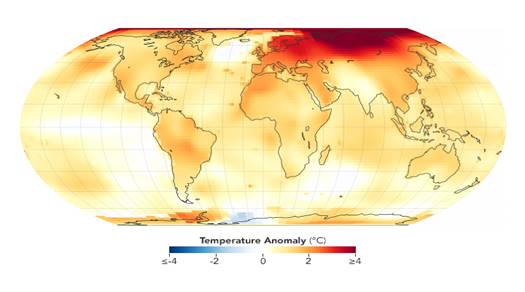
Figure III
The La Nina, which isn’t clearly delineated in Figure III due to its later development and the baseline being used, started to form around June 2020 and got progressively stronger as the year progressed. In spite of the La Nina, 2020 was tied for 2016 as the warmest year on record based upon NASA data and the 2nd warmest year on record based upon data from NOAA.
Figure IV has global temperature deviation data by year based upon NASA data.
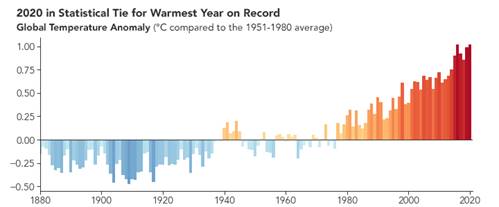
Figure IV
An interesting region worth looking at in Figure III is northern Siberia which is deep red, meaning it was well above the 1951-1980 average temperature in year 2020.
Note in Figure V that ice cover over the Arctic Ocean above Siberia was well away from the Siberian coastline for a significant period of the summer and fall of 2020.
Arctic Ocean Ice Cover for Sept. 15, 2020
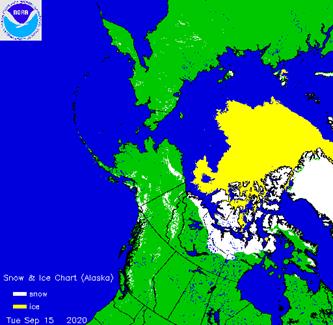
Figure V
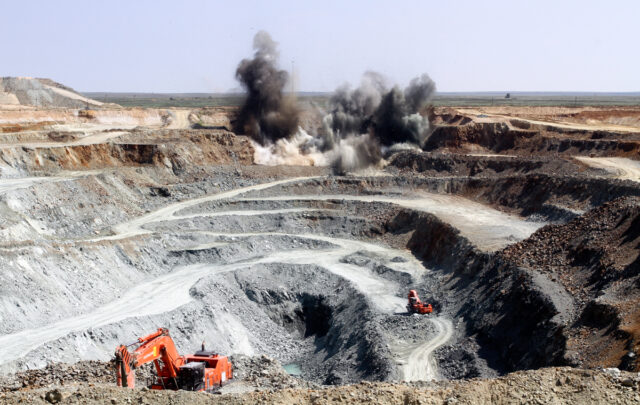
The implication of the lack of ice near the Siberian coastline is that the waters in that region warmed significantly in 2020 and in recent previous years as well. The East Siberian Continental Shelf has a huge amount of methane trapped in what is termed methane hydrate. That is methane trapped in ice crystals in the sea bed.
When the seabed ice melts due to warmer Arctic Ocean water temperatures, the methane can come out and migrate up to the atmosphere. Methane has a heat trapping capacity in the atmosphere of ~86 times that of CO2 over a 20 year time horizon and ~ 28 over a 100 year time horizon.
Some Arctic climate experts, such as Peter Wadhams, think a huge amount of methane could be released from the region within the next 20 years due to warming Arctic Ocean waters. If not the next 20 years, then at some point in the not-too-distant future beyond 20 years.
By a huge amount, a release could entail tens of gigatons of methane, enough to cause significant warming in a short time frame. That would represent a strong positive feedback to global warming. Interestingly, that is not something I hear about from the mainstream media.