My frequent co-author, Samuel Foucher, and I started warning, in January, 2006, about an imminent decline in world net oil exports. EIA data show that we are almost certainly going to see three years of world net oil exports below the 2005 rate, primarily because of collective declines by the top five net oil exporters—Saudi Arabia; Russia; Norway, Iran and the UAE—which account for about half of world net oil exports. Kenneth Deffeyes predicted that world crude oil production would peak in a range from 2004 to 2008, most likely in 2005. EIA show world crude oil production of about 74 mbpd (million barrels per day) in 2005, slightly less in 2006 and 2007, and 74 mbpd in 2008 (through September). Total liquids production is up slightly in 2008, which Matt Simmons attributes to increased natural gas liquids production, as the gas caps in many large oil fields are produced, in the last stages of depletion for these fields.
Part of the problem is that price information is instantaneous and accurate. Production data tend to be noisy (especially in the short term), delayed and subject to revision, so price, at least a falling price, is frequently used as a proxy for production (as noted above, rising prices are generally attributed to speculation, and not to fundamental supply/demand factors).
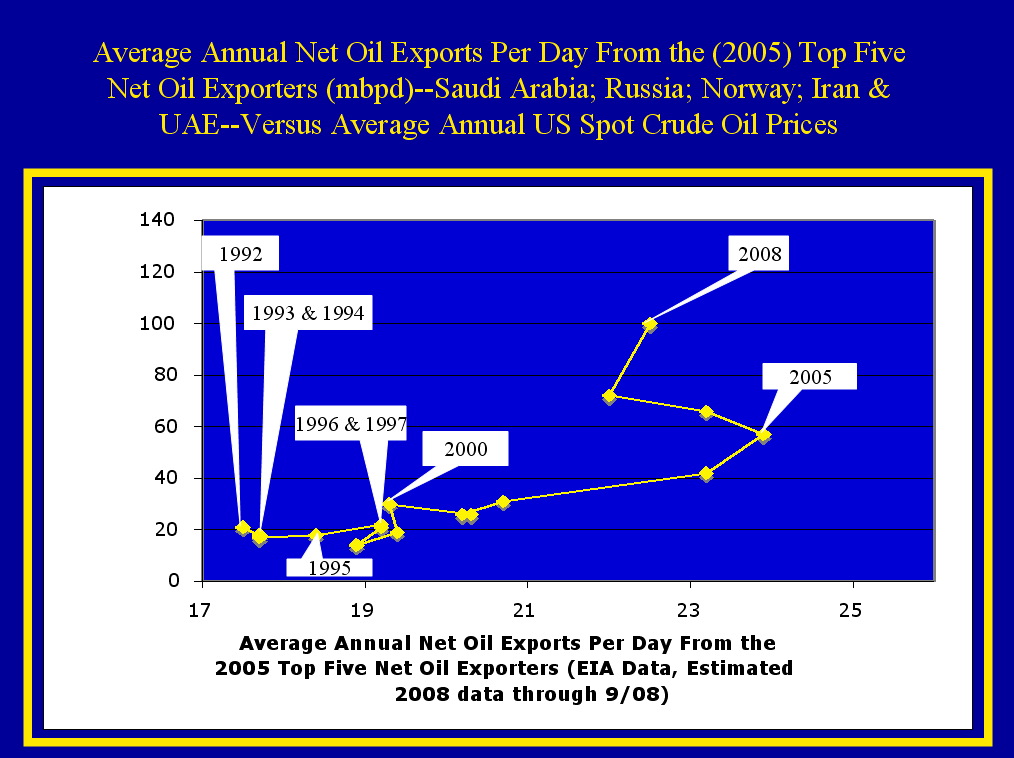
I have an alternative point of view. I believe that the increase in annual oil prices from 2005 to 2008 was largely due to importers bidding for declining net oil exports. As noted above, my co-author and I started warning about declining net oil exports in early 2006. Our most detailed work, a quantitative analysis of the top five net oil exporters was presented to ASPO-USA in 2007 and published in early 2008:
Our middle case is that the top five net oil exporters will collectively approach zero net oil exports around 2031, within a time frame from 2024 to 2039.
Our intermediate outlook is that the top five net oil exporters will be down to about 12 mbpd in 2015 (middle case) within a range from 7 mbpd to 18 mbpd, versus about 24 mbpd in 2005.
We have two years of EIA data for net oil exports from the top five, and we have monthly production data through September, 2008. The annual data for net oil exports from the top five are as follows:
| 2005 | 23.9 mbpd |
| 2006 | 23.2 |
| 2007 | 22.0 |
| 2008 | 22.5* |
mbpd= Million barrels per day. *Estimate based on data through 9/08
While we have evidence for a slight increase in net oil exports in 2008, it is to a level that is well below the 2005 rate, and other exporters in terminal decline, such as the UK and Indonesia, showed year over year increases, in their terminal decline phases.
We can only hope for an outbreak of rational thinking in the months and years ahead.
Jeffrey J. Brown is an independent petroleum geologist in the Dallas, Texas area. His e-mail address is westexas @aol.com. The Net Oil Export slide was prepared by A. B. Silveus.