There is increasing concern worldwide about global oil supplies, especially in the context of a global oil production peak. However, what really matters to oil importing countries is world net oil export capacity, and we are deeply concerned that the top five net oil exporting countries, Saudi Arabia, Russia, Norway, Iran and the UAE (United Arab Emirates), collectively accounting for about half of current world net oil exports, in aggregate are going to show an ongoing decline in net oil exports, continuing an aggregate net export decline that began in 2006.
Some recent net export decline rates in other countries, such as Indonesia and the UK, have been quite severe.
Indonesia exported 780,000 bpd (Total Liquids) in 1996. Eight years later, Indonesia was a net oil importer.
In a similar fashion, the United Kingdom in 1999 was a major net oil exporter, exporting more than one million barrels per day (mbpd). Seven years later, the UK was a net importer.
Figure 1 shows UK liquids production (crude oil, condensate and natural gas liquids), versus net liquids exports. Note how quickly that net exports went to zero, even as the UK continued to produce significant quantities of liquids.

Figure 1. UK oil production and Exports.
In this paper, we will discuss our mathematical export model and two case histories. We will then discuss the conventional wisdom regarding Saudi Arabia, the world’s largest net exporter. Finally, we will present our quantitative assessment of the future net exports by the top five net oil exporters and discuss the validity of our quantitative methods.
Note that we are building directly on prior work by many people, including but not limited to Matthew Simmons and Kenneth Deffeyes, and indirectly on pioneering work by M. King Hubbert.
Our Mathematical Model and Recent Case Histories
Figure 2 is a graph of the Export Land Model (ELM), for a hypothetical net exporter with peak production of 2 mbpd and consumption of one mbpd. Production (top line) starts declining at -5%/year, while consumption (middle line) climbs at +2.5%/year. While this sounds relatively benign, it results in oil exports (bottom line) going from peak to zero in nine years.
Figure 2 Export Land Model.
While the ELM is a simplistic model, there are three key points: exports decline faster than production declines, the export decline rate accelerates with time and only a small portion of the post-peak production is exported (about 10% for the ELM).
The overall ELM exponential net export decline rate, about -29%/year over the eight year net export decline period, is much more rapid than the production decline rate of -5%/year because net exports in a given year represent the net difference between two exponential functions: exponentially declining production and (generally) exponentially increasing consumption.
The ELM net export decline rate accelerates with time, from an initial year over year change in net exports of -12.5% to a final year over year change in net exports of -47.6% (last year of net exports).
So, how does the simplistic ELM compare to real world case histories?
Actually, two case histories, Indonesia and the UK, showed, as described above, sharper net export declines than the ELM. Figure 3 shows the year-over-year changes in net exports, from the start of the most recent production declines to the (apparent) final year of net exports (EIA, Total Liquids) for the ELM, the UK and Indonesia.
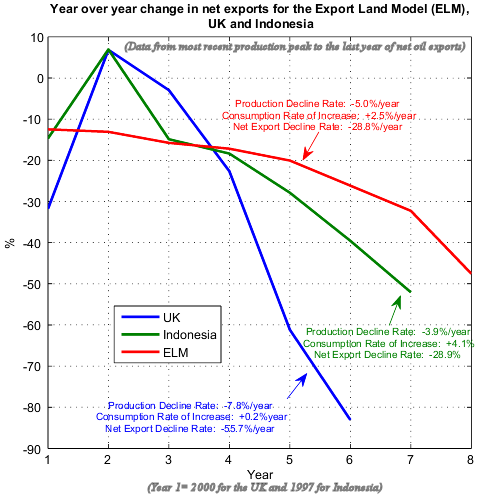
Figure 3. ELM, UK and Indonesia, Year over Year Changes in Net Exports.
It’s also interesting that the UK and Indonesian net export declines were so similar, given the radical differences between the two regions.
The UK is characterized by high per capita income, high consumption energy taxes and a minimal increase in consumption (+0.2%/year over the net export decline period).
In contrast, Indonesia is characterized by low per capita income, energy consumption subsidies and a fairly rapid increase in consumption (+4.1%/year over the net export decline period).
We believe that most net oil exporting countries fall between Indonesia and the UK in terms of per capita incomes, rates of change in energy consumption and energy consumption taxes versus energy consumption subsidies.
Note that once production in a given exporting country starts a long term decline, the net export decline rate is a function of: (1) consumption as a percentage of production at peak production; (2) The production decline rate and (3) The rate of change in domestic consumption.
The UK and Indonesia net export declines were similar to the ELM because of their relatively high consumption as a percentage of production at the most recent peak, in the 50% to 60% range. However, regions with lower percentages of consumption, relative to production, will almost certainly also show similar accelerating net export decline rates, once production starts declining.
Conventional Wisdom
The Economist magazine, in an article about Saudi Arabia published in August, 2006, had the following remarkable statement:
Saudi Aramco’s proved reserves alone could keep the world supplied for several decades. But it is only exploiting ten of its 80 or so fields, so will be able to pump at the present rate for about 70 years even if it never discovers another drop of oil.
It was remarkable that the Economist would make a 70 year projection without even considering the effect on net exports of increasing domestic Saudi consumption. The Wall Street Journal published last week this chart showing the rapid rise in domestic consumption for Saudi Arabia as well as for Iran and Russia :

From The Wall Street Journal. Click to Enlarge
Based on EIA data, Saudi Arabia showed a +5.7%/year increase in consumption from 2005 to 2006. Figure Four shows a flat line production of 11 mbpd (total liquids) versus a +5.7%/year increase in consumption which would result in Saudi oil exports ceasing in about 2036. The long term net export decline rate (2005 to 2030) would be about -10%/year. As noted above, the year to year net export decline rate would start out slowly and accelerate with time.
For what it’s worth, at +5.7%year, the Saudis would be consuming 108 mbpd in 2075, which seems “somewhat” unlikely, since this is about 40% more than current total world liquids production..
Figure 4. Saudi Arabia: Constant production at 11 mbpd, versus consumption increasing at +5.7%/year.
Quantitative Assessment
The current top five net oil exporters—Saudi Arabia, Russia, Norway, Iran and the UAE—account for about half of world net oil exports. From 2000 to 2005, they showed a combined 3.7% per year increase in consumption. From 2005 to 2006, they showed an accelerating rate of increase in consumption, to +5.3% per year. From 2005 to 2006, the top five showed an aggregate net export decline rate of -3.3% per year. Based on year to date data, it is a near certainty that this net export decline rate will accelerate from 2006 to 2007. (EIA, Total Liquids)
We have generated a range of projected future production curves for the top five net exporters, using the logistic method, which is commonly referred to as “Hubbert Linearization” or HL, a term coined by Stuart Staniford on The Oil Drum blog. For more information on the method, see “Texas and Lower 48 Production as a Model for Saudi Arabia and the World”.
Consumption curves were generated using a Monte Carlo analysis based on the observed growth rates over the last 10 years. For historical production and consumption data, we primarily relied on the BP liquids data base (crude oil, condensate and natural gas liquids).
The most likely cases for both production and consumption curves are shown, within the 95% probability limits. In effect, this results in a low case, middle case and high case for both production and consumption.
Figures 6 through 9 show the production and consumption plots for each country. The initial 10 year projected production decline rate for each country are shown. The projected net exports for each country are shown on Figures 10 through 14, and the initial 10 year projected net export decline rate for each country are shown
Saudi Arabia’s initial 10 year projected production decline rate is -2.7%/year ±2% per year. The projected rate of increase in consumption is +4.4%/year ±2% per year. Their initial 10 year projected net export decline rate is -4.7%/year ±4%. Our middle case shows Saudi Arabia approaching zero net exports in 2031, within a range from 2024 to 2037.
A swing producer regulates its production in order to keep oil prices within a defined range. After Texas peaked in 1972, Saudi Arabia emerged as the new swing producer. In 2005, Matt Simmons argued, in his book “Twilight in the Desert,” that Saudi oil reserves were vastly overstated.
In January, 2006, we noted, based on the HL models, that Saudi Arabia was at about the same stage of depletion at which Texas peaked, and we followed that up with our Texas/Lower 48 article published in May, 2006, which made a more detailed quantitative case for a near term Saudi oil production peak. In that article, we showed 2005 Saudi crude + condensate production lined up with Texas 1972 crude + condensate production. Figure 5 shows this graph, updated with the 2006 and 2007 to date production data. While this graph could suggest that Saudi Arabia is in terminal decline, the evidence for a long term decline is not yet conclusive. We do know that annual Texas oil production in the Seventies fell against a backdrop of rising oil prices and a rapid increase in drilling activity, which is the same pattern that we are now seeing in Saudi Arabia, at least on an annual basis. In any case, Saudi Arabia will have to show an annual production rate of about 9.6 mbpd or more (crude + condensate) in order to refute the 2005 peak. We can say that at a minimum the preponderance of the data suggest that the conventional wisdom estimates of remaining recoverable Saudi oil reserves are significantly overstated.
Recently, Sadad al-Huseini the former head of exploration and production at Saudi Aramco, has stated that he believes total world oil production will not increase, that world proved oil reserves are significantly overstated and that key oil fields in the Middle East are significantly depleted. While he is cautiously optimistic about future Saudi production, he points out that it is heavily dependent on the production performance from new fields.
Russia’s initial 10 year projected production decline rate is -5.1%/year ±2%. The projected rate of increase in consumption, which is heavily weighted toward recent consumption and therefore on the low side, is +0.3% ±0.8%. The initial 10 year projected net export decline rate is -8.2%/year, ±4%. Our middle case shows Russia approaching zero net exports in 2024, within a range from 2018 to 2029.
We believe that Russia’s recent rebound in production was primarily a result of Russia making up for what was not produced following the collapse of the Soviet Union, and based on our mathematical model, Russia has now “caught up” to where its post-1984 cumulative production should have been.
This summer Alfa Bank warned of problems with mature Russian oil fields because of rapidly rising water cuts. Just recently, Renaissance Capital brokerage said that excluding the Sakhalin-1 Field, daily crude output in Russia has been down year-on-year since May. There have been recent warnings that new fields in Eastern Siberia are too small and being developed too slowly to offset the production declines in Western Siberia, and the most recent Russian oil export data show a 6.7% decline in total Russian oil exports in December, 2007 versus December, 2006.
Norway is fairly straight-forward. Our 10 year projected decline rate is -11%/year ± 2%, with a projected rate of consumption increase of 0.7%/year ±2.7%.. The 10 year projected net export decline rate is -12%/year ±2.5%. Our middle case shows Norway approaching zero net exports in 2025, within a range from 2022 to 2028.
Iran’s initial 10 year projected production decline rate is -1.5%/year ± 2%. The projected rate of increase in consumption is +2.9%/year ± 1.8%. The initial 10 year projected net export decline rate is -4.9%/year, ± 7%. Our middle case shows Iran approaching zero net exports in 2029, within a range from 2020 to 2042.
Note that our low case net export decline is consistent with some media reports that suggest that Iran may cease exporting oil within 10-15 years.
The UAE’s initial 10 year projected production decline rate is -2.9%/year ± 4%. The projected rate of increase in consumption is +5.0%/year ± 5.0%. The initial 10 year projected net export decline rate is -4.0%/year, ± 7%. Our middle case shows the UAE approaching zero net exports in 2037, within a range from 2020 to 2056.
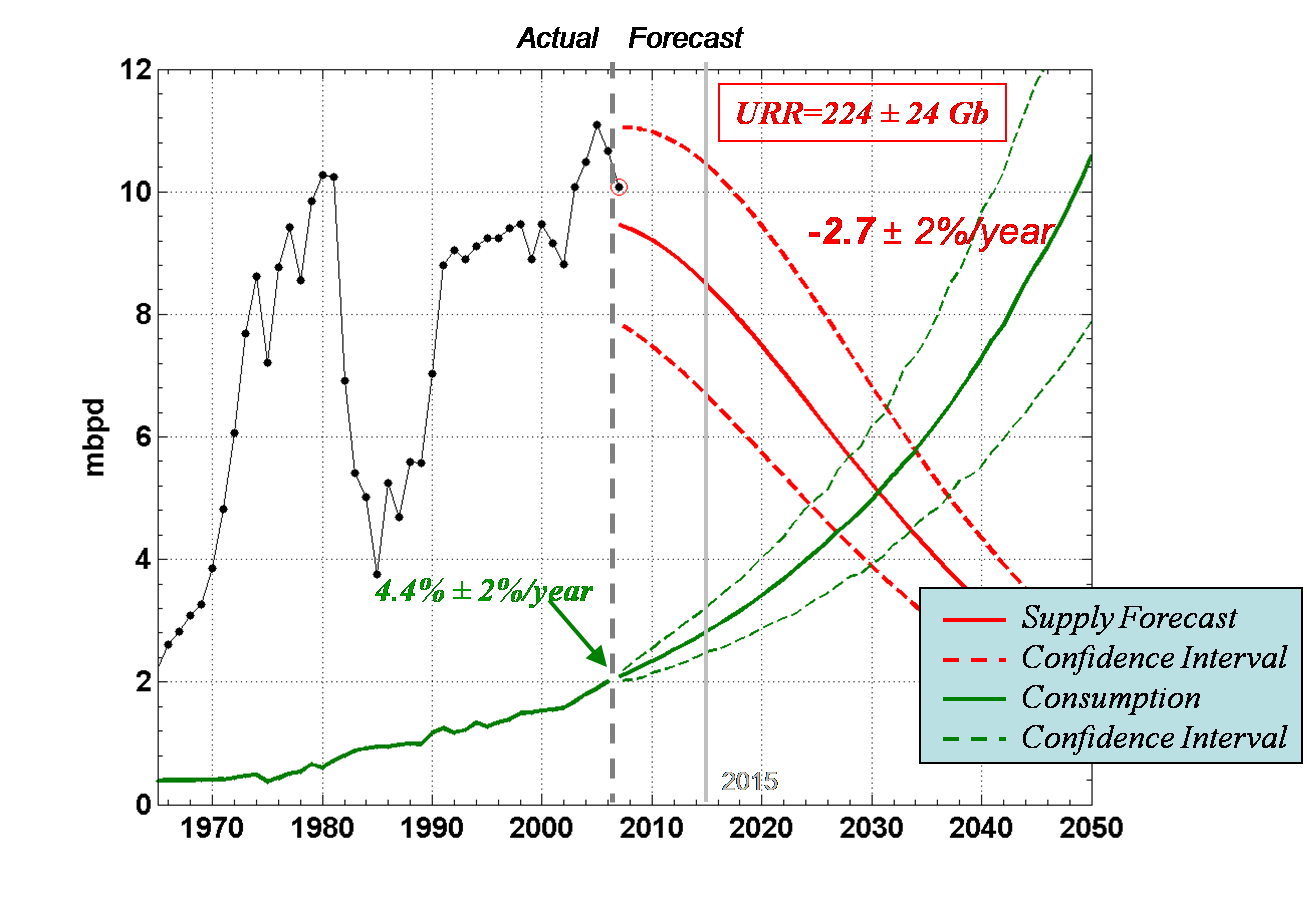
Figure 6. Saudi Arabia production and consumption.
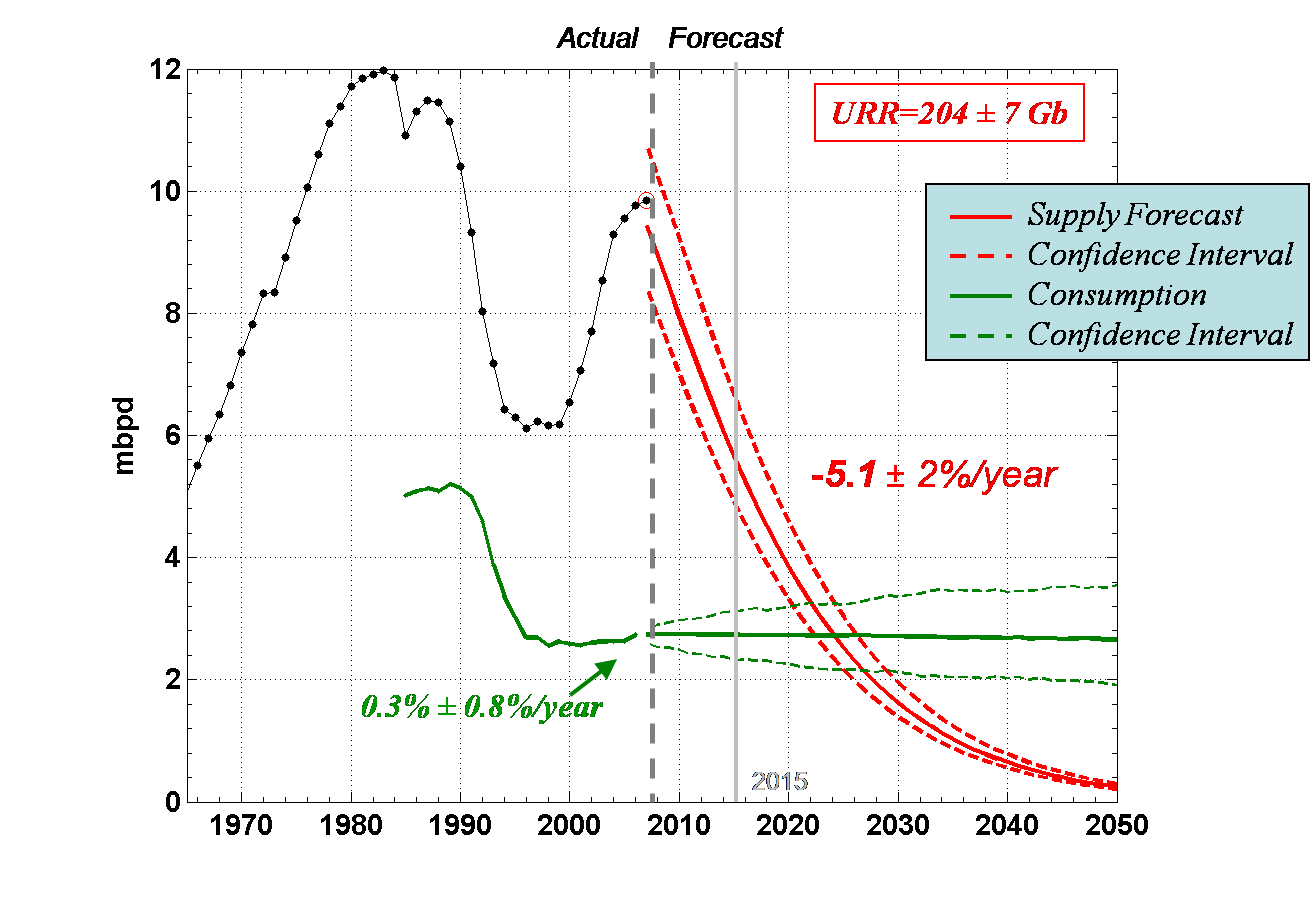
Figure 7. Russia production and consumption.
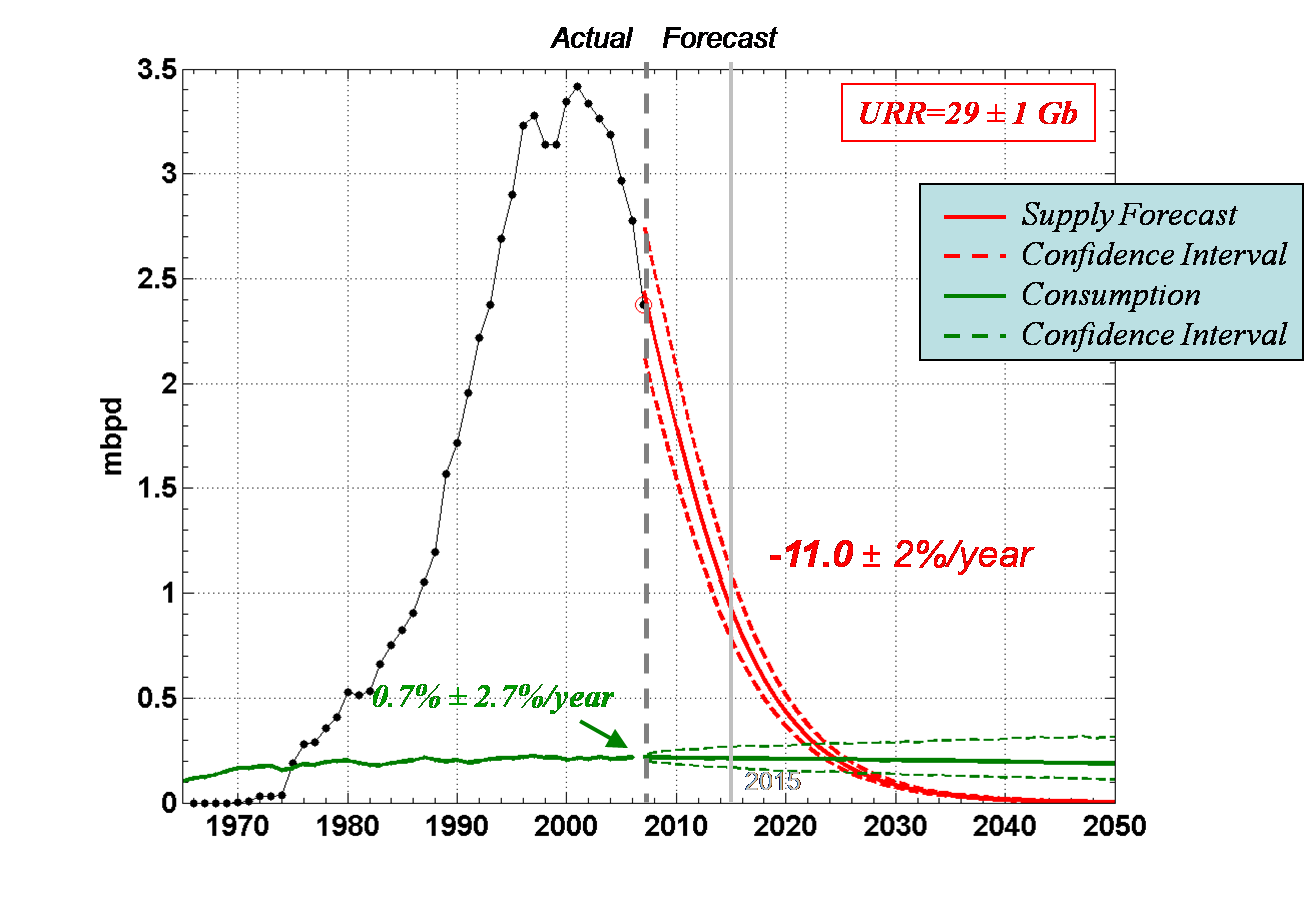
Figure 8. Norway production and consumption.
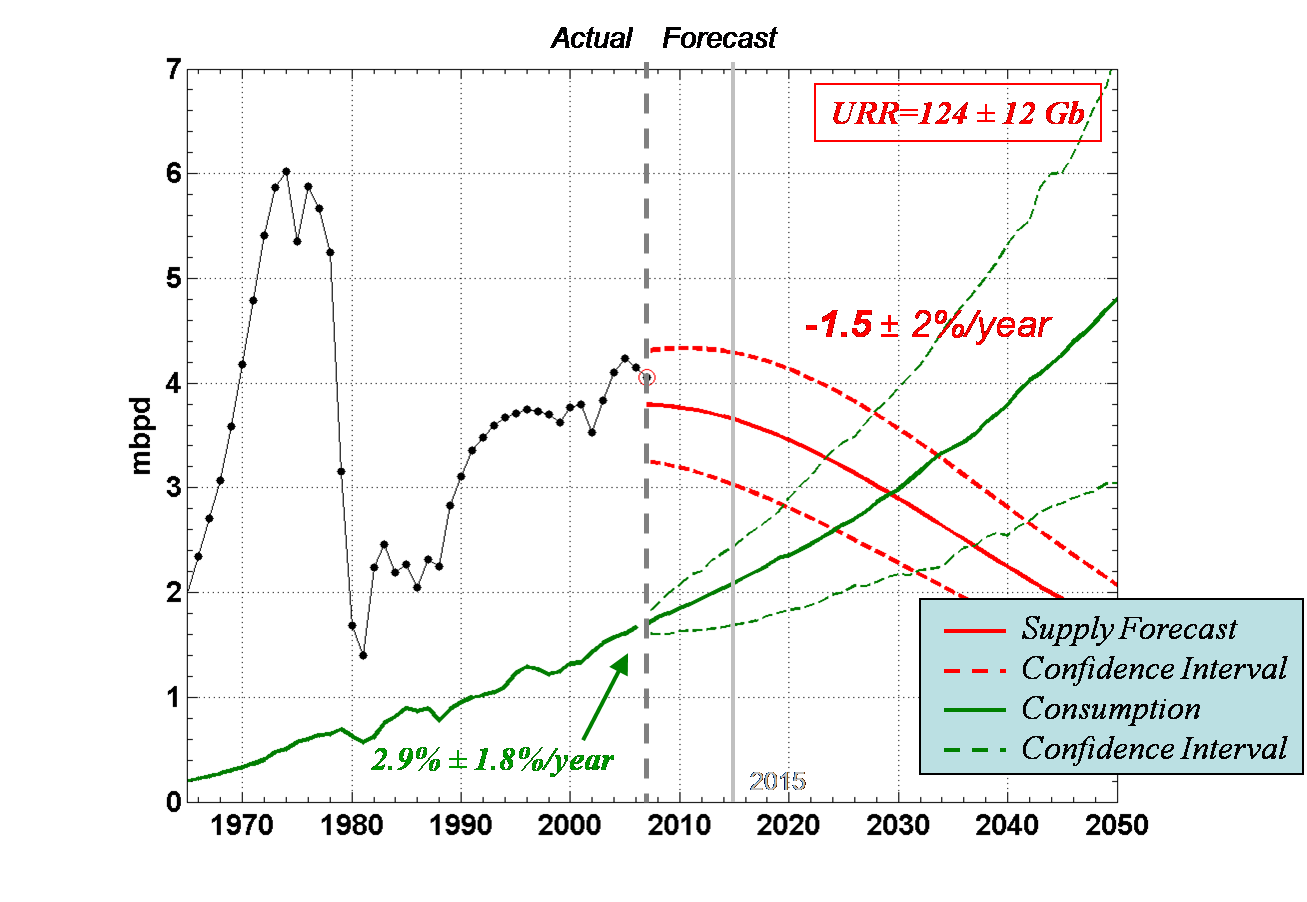
Figure 9. Iran production and consumption.
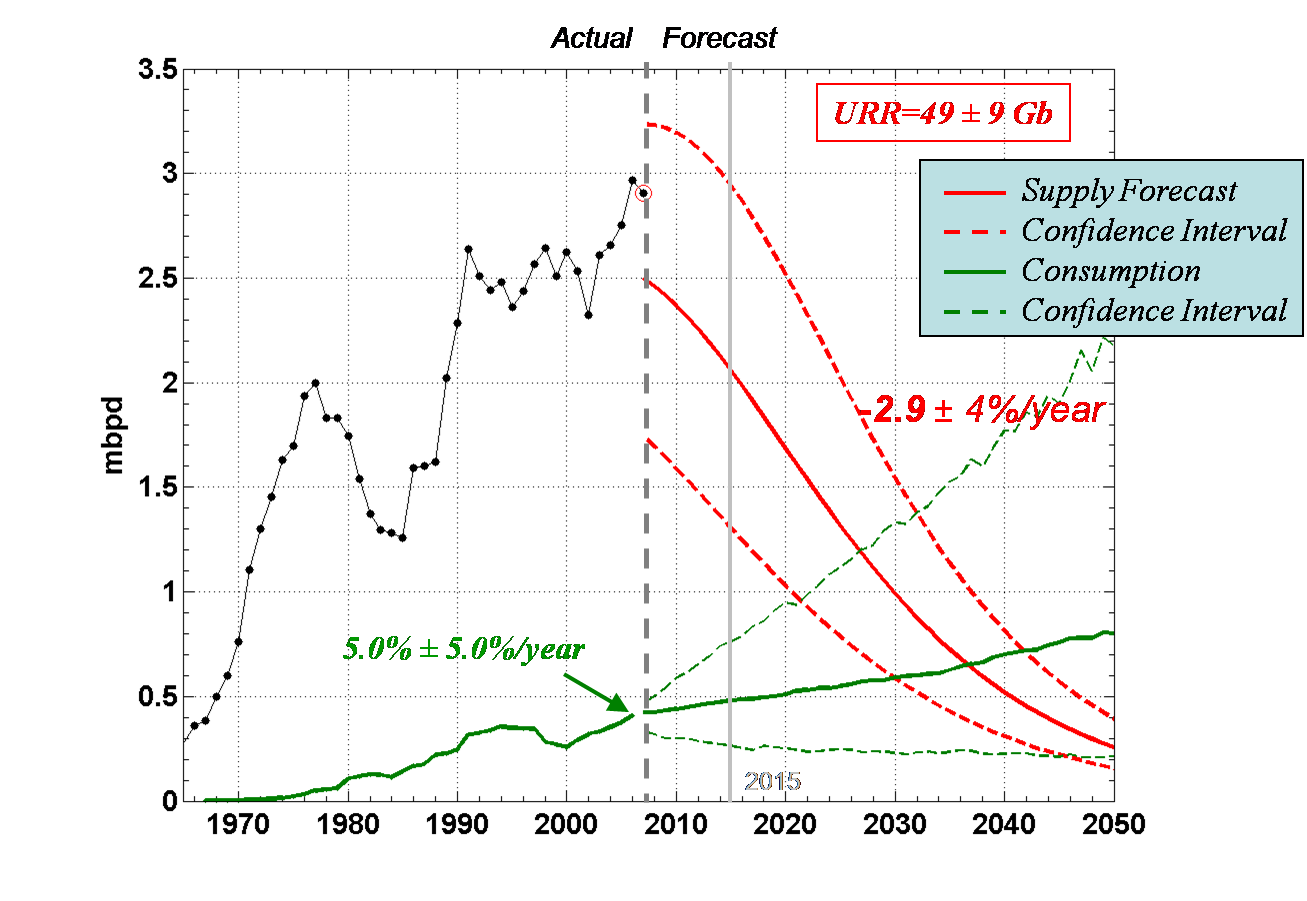
Figure 10. UAE production and consumption.
Figure 13. Norway Exports.
Figure 14. Iran Exports.
Figure 15. UAE Exports.
Finally, we summed the projected production and consumption for the top five, Figure 16, which shows an initial 10 year production decline rate of -3.8%/year ±2%, with a projected rate of increase in consumption of +1.8%/year ±0.9%. Note that this is heavily influenced by the Russian projection.
Projected net exports from all five net exporters are shown in Figure 17, with an initial 10 year projected net export decline rate of -6.2%/year ±4%. Our middle case shows the top five approaching zero net exports in 2031, within a range from 2024 to 2039.
Note that it is a near certainty that the top five are going to show an accelerating aggregate net export decline rate in 2007, relative to 2006, which is what our model and recent case histories suggest that we should see.
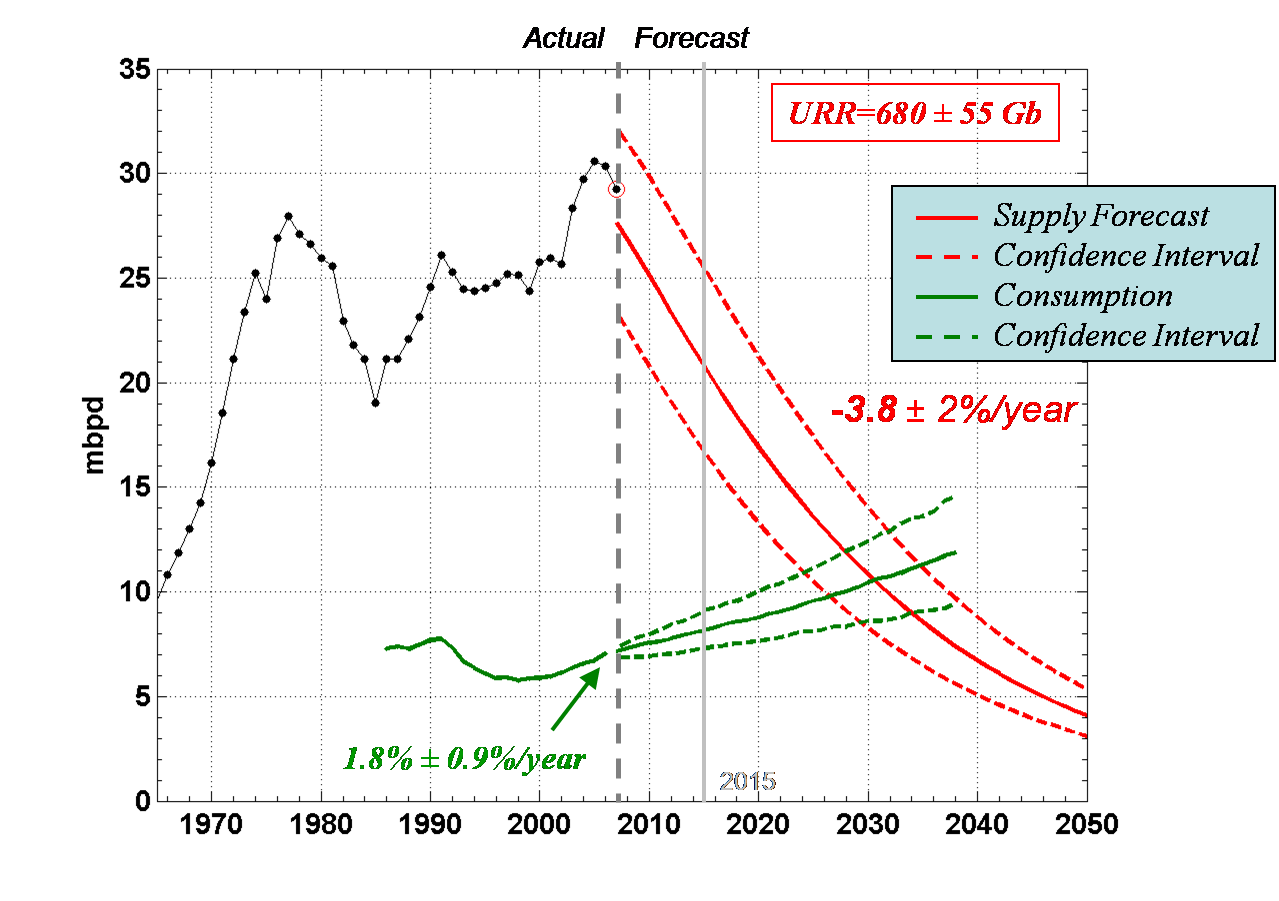
Figure 16. Top five exporters (production and consumption).
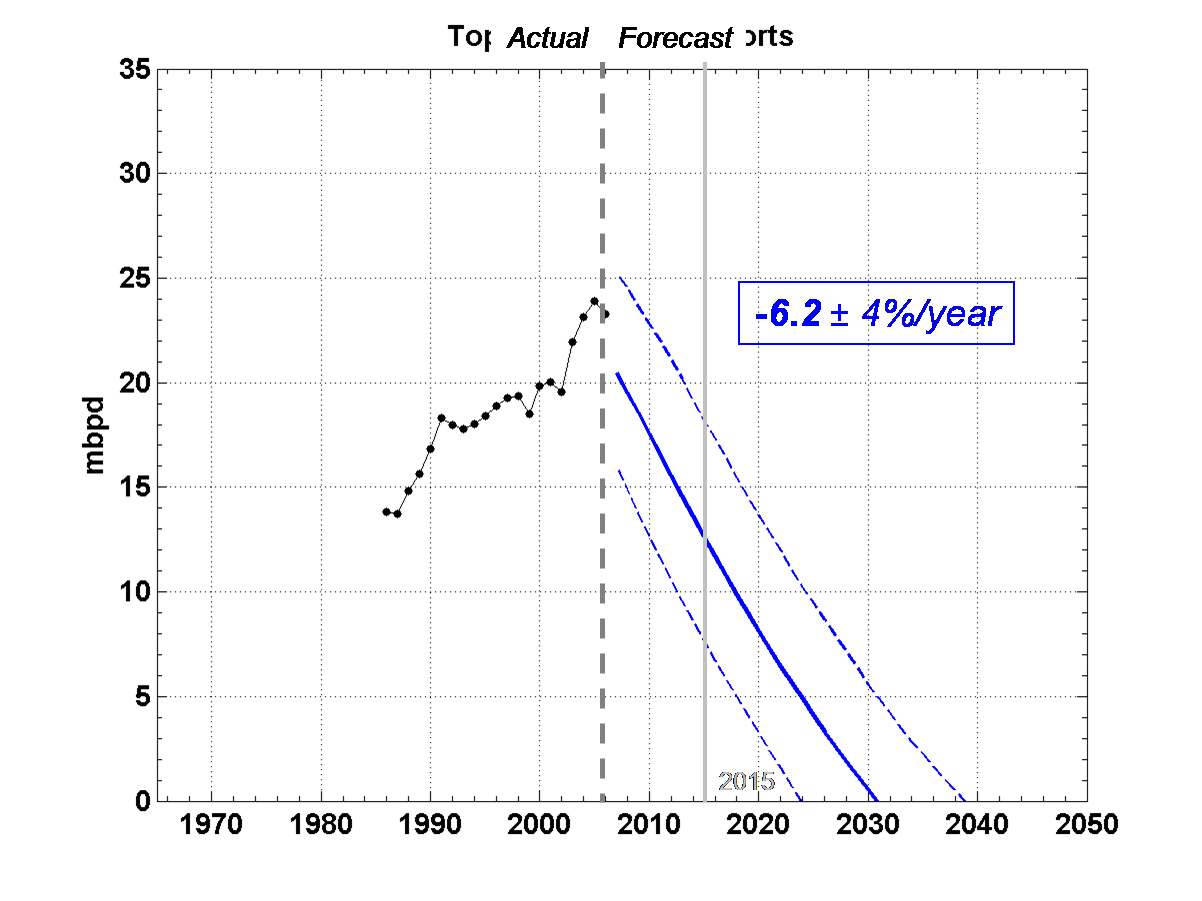
Figure 17: Top five exports.
Summary
Our simple mathematical model and recent case histories have shown that once oil production in an oil exporting country starts declining, the resulting decline in net oil exports can be quite rapid, and the oil exporter tends to show an accelerating net export decline rate.
We have used some additional mathematical methods to forecast future production and consumption for key oil exporting countries.
Our middle case forecast is that the top five net oil exporting countries, accounting for about half of world net oil exports, will approach zero net oil exports around 2031—going from peak net exports to zero in about 26 years, versus seven years and eight years respectively for the UK and Indonesia. In our opinion, the only real difference between the top five and the UK and Indonesia is that the top five net exporters in 2005 had a lower rate of consumption relative to production.
Extrapolating from year to date 2007 data, it appears likely that the top five will show an average aggregate net export decline of about one mbpd per year in both 2006 and 2007, putting them on track to go from about 23 mbpd in net exports in 2005 to close to zero in the 2030 time frame.
Smaller oil exporters like Angola can and will increase their net exports, but smaller exporters, just like smaller oil fields, tend to have sharper production peaks and more rapid net export declines than do the larger net exporters. And offsetting many of the gains by some smaller exporters will be sharp declines in net exports from other smaller exporters like Mexico, the #2 source of imported crude oil into the US, which will probably approach zero net oil exports by 2014.
Declining net oil exports will inevitably result, absent a severe decline in demand in importing countries, in continued rapid increases in oil prices, as oil importing countries furiously bid against each other for declining oil exports.
In simplest terms, we are concerned that the very lifeblood of the world industrial economy—net oil export capacity—is draining away in front of our very eyes, and we believe that it is imperative that major oil importing countries like the United States launch an emergency Electrification of Transportation program–electric light rail and streetcars–combined with a crash wind power program.
As Alan Drake has pointed out, the United States–with roughly 1/3rd its current population, 1/25th of its current inflation adjusted GDP and with primitive Technology –built subways in its largest cities and streetcars in 500 cities, towns and villages in just 20 years (1897-1916), which does not even take into account numerous interurban systems.
If we could do it in 1908 with mules, manual labor and with minimal fossil fuel input, why can’t we do it 2008?
Electrified Transportation in San Angelo, Texas, Circa 1908