
In Friday’s post, I argued that the likely pattern of human response to climate change would be characterized by very limited action until manifestly serious consequences were clear by looking out the window; then, and only then would serious action ensue. In other words, the pattern would be one of panic and repentance.
Of course, some action is occurring on the fringes now: we are installing some wind turbines, we are installing some solar panels, we are making new vehicles more energy-efficient than in the past, new houses likewise. If you think back ten years to 2003, there were no usable electric cars on sale, fuel economy regulations were far more lax, there was a tenth the amount of wind power deployed, ductless minisplit heat-pumps were unknown in the US, and solar panels cost over twice as much as they do now. So in some ways we have made a lot of progress on the technology required to be carbon neutral.
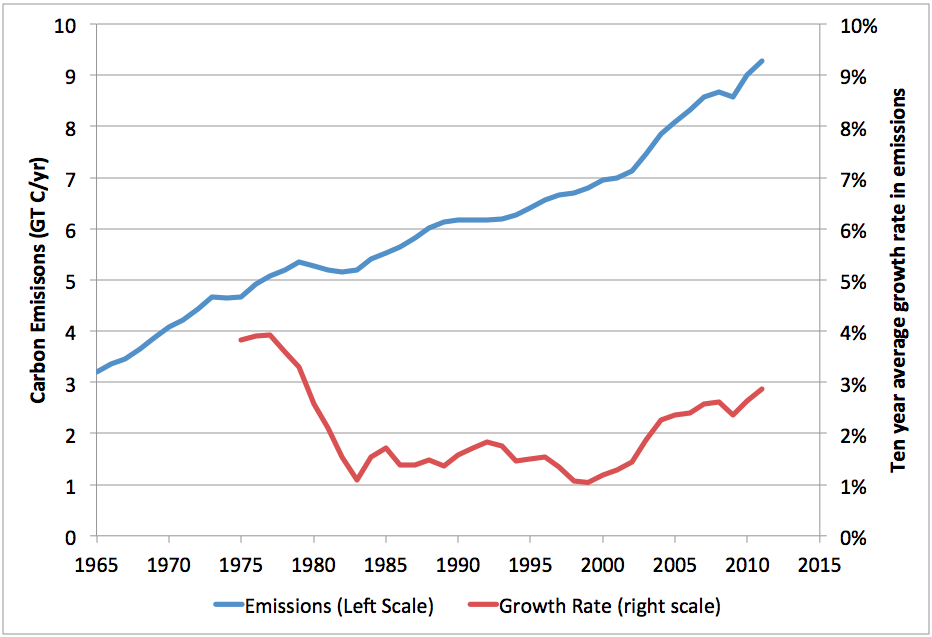
But at the same time, developing countries are rapidly coming into the fossil-fuel age, and the overall result is that the global carbon emissions curve, rather than declining, is going up faster than it has in decades (data from BP):
So lets define the moment that real repentance begins as that time when we start to noticeably bend the global emissions curve relative to its historical trajectory. In my scenario on Friday, I had this begin in 2020, with global emissions peaking ten years later in 2030. Then I assume emissions actually begin to fall as we deploy renewables and efficiency measures fast enough to overwhelm the growth in fossil fuel usage that would otherwise occur. Eventually, human carbon emissions become negative as we suffer the very serious consequences of the accumulated warming that is in the pipeline and start actively extracting carbon from the atmosphere in an attempt to stabilize the situation.
Obviously, it makes a big difference when we start to take the situation very seriously. In this post, I wanted to look at the consequences for the atmospheric mixing ratio of carbon dioxide (usually expressed in parts-per-million – ppm). In pre-industrial times, but during the current interglacial (the Holocene), this was fairly stable around 280ppm (it was a lot lower during the last ice age). We have gotten it up to about 394ppm by 2012 and it continues to rise on a fairly smooth quadratic curve. So that’s 114ppm above the pre-industrial level.
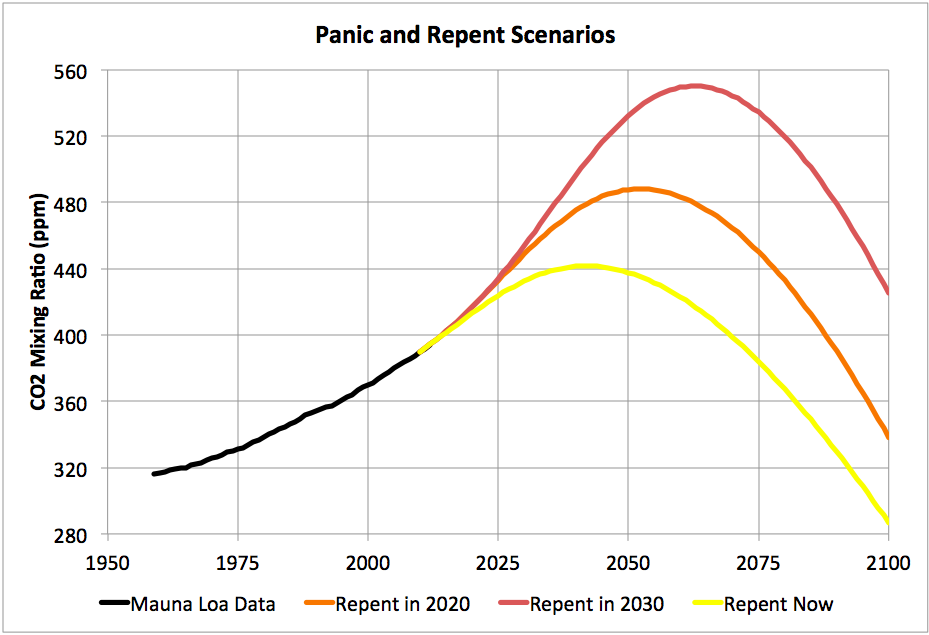
The following chart shows scenarios for the future:
Here, the orange curve represents Friday’s scenario where we start to bend the curve in 2020 and then emissions peak in 2030. As you can see, concentration of CO2 in the atmosphere doesn’t peak until after 2050, with a level around 490ppm (210ppm above pre-industrial). Given that we have already almost melted the north pole in summer with the increases so far, and gotten extreme weather raging around the world as a result, it’s pretty nerve-wracking to imagine taking it up to 490ppm before it starts to come down. Given that it’s fairly clear that most of the Arctic is going to be free of ice and snow in summer, and given how little scientists know about ice dynamics, you have to worry about whether that’s enough to trigger an irreversible collapse of the Greenland ice sheet.
It’s worth saying something about the assumptions that go into the declining phase. So far, not all emissions that we produce go into increasing atmospheric concentration. Because the ocean and biosphere are out of equilibrium with the high concentration in the atmosphere, they pull carbon out of the latter each year. Knowing the mass of the atmosphere, you can compute the size of this carbon sink by knowing emissions, knowing how much the amount of carbon in the atmosphere has increased, and calculating the difference. So far, the sink has been roughly linear in the difference between the current concentration and the pre-industrial concentration:
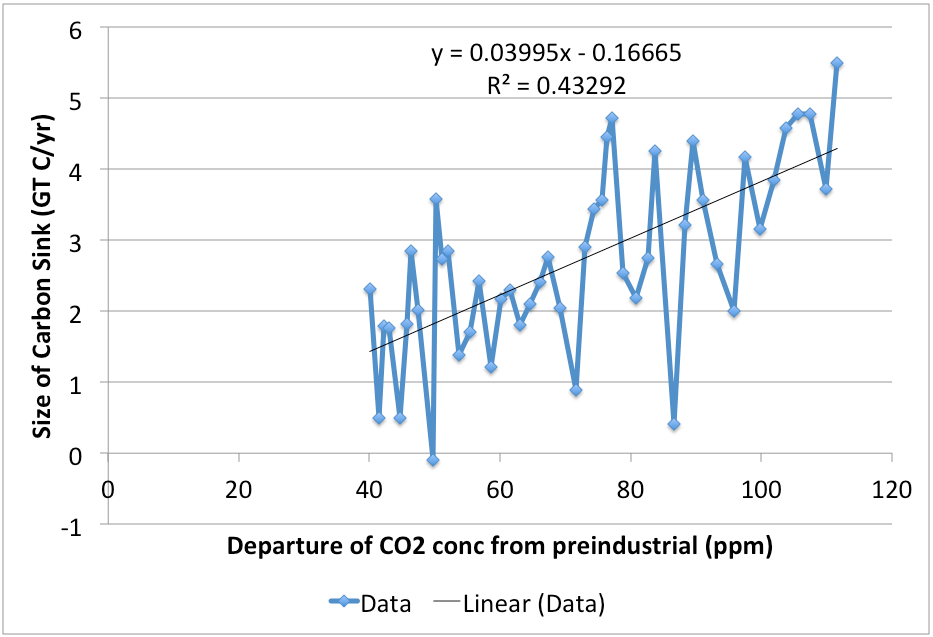
My scenarios above assume that this linear relationship continues throughout the twenty-first century. There are reasons to worry about this. One is that, as the climate continues to get hotter and drier, forests could die on a large scale and cause a large release of carbon, thus reversing part of the sink. Another is that Arctic permafrost and stored methane clathrates could release large amounts of carbon as the Arctic warms up (so far, although this is definitely happening, there is not evidence of it seriously affecting the global methane curve). In short, extrapolating the linearity of the sink over the twenty-first century is quite uncertain and far from a worst case assumption.
The worst-case assumption is that we trigger a runaway global warming that, once started, cannot be reversed. That probably cannot be ruled out, but, absent any evidence for it at present, I’m going to stick with the assumption of continued sink linearity.
Going back to this picture:
The red curve shows what happens if we wait another decade – until 2030 – to start bending the emissions curve, with emissions then peaking in 2040. Now, atmospheric CO2 doesn’t peak until around 2065, at a level almost double the pre-industrial concentration. Very scary.
By contrast, the yellow curve shows what happens if we start to bend the curve now and manage to constrain emissions to peak in 2020. That results in a concentration peak in 2040 at about 440ppm. Still pretty bad – we have already left it late to act. Nonetheless, I consider the yellow curve to be unrealistically optimistic – I don’t see signs that the world is taking the issue seriously enough to cause an imminent reduction in the growth rate of carbon emissions this year or next.
It’s worth emphasizing that the exact details of these scenarios are not likely to prove accurate – how long it takes for emissions to peak after starting to reduce the growth rate, how fast we will be able to get negative, and how negative, are all uncertain. These are generally indicative rather than precisely accurate.
It’s also worth noting that peak temperature is likely to be decades after peak atmospheric carbon. So, from the point we start to get really serious, it will then be around fifty years until peak temperature. Dealing with this is going to be a life-long effort for all of us, and all of our children and grandchildren.
The larger point is – however late we’ve left it to act, it’s always possible to make it much worse by waiting even longer.