The installation of solar panels and heat pumps in UK homes soared in 2023, driving the country to its highest-ever level of domestic low-carbon technology upgrades.
Registered solar photovoltaic (PV) installations rose nearly 30% to a post-subsidy record of 189,826 in 2023, according to the Microgeneration Certification Scheme (MCS).
Similarly, heat-pump installations were up 20%, reaching a record 36,799.
This growth drove a UK record for the total number of domestic renewable electricity and low-carbon heat technologies installations registered by MCS, which reached 229,618.
This brings the total MCS-certified installations of solar PV overall to 1,441,753 since 2009, equivalent to more than 5% of all UK households.
The near-record figure for home solar in 2023 is particularly significant because it came without any government support, whereas previous growth was driven by deadlines under the Feed-in-Tariff (FiT) subsidy scheme, which ended in 2019.
Below, Carbon Brief looks at MCS’s installation figures for 2023, picking out some of the most significant domestic developments.
Record clean energy growth
The UK had already recorded its “best-ever” year for renewable energy and low-carbon heat installations before 2023 came to end, as Solar Power Portal reported in December.
While solar PV and air-source heat pumps (ASHP) saw growth in their installation rates in 2023, other clean technologies dropped off somewhat.
By the end of the year, a record total of 229,618 MCS certified installations had been registered (there is the potential for a small change to the total, due to a lag with registrations, MCS told Carbon Brief).
This included a post-subsidy record 189,826 solar PV installations, up by a third from the 138,020 seen in 2022.
Solar Energy UK chief executive Chris Hewett said in a statement:
“Setting a post-subsidy record of almost 190,000 smaller-scale solar PV installations, and approaching the all-time record of 203,000, is truly a moment to celebrate. The solar industry is on a roll, particularly as we start to conclude work on the government-industry Solar Taskforce, whose roadmap for delivering 70GW [gigawatts] of capacity is due to be published in a couple of months.”
The number of MCS-registered ASHP installations grew to a record 36,799 in 2023 from 29,490 a year earlier. (The real number of heat pumps installed in the UK is likely to be higher, as there is currently no mandate for all low-carbon technology deployments to be certified, or reported in a single place.)
Bean Beanland, director for growth at trade association the Heat Pump Federation, tells Carbon Brief the growth in demand for ASHPs was being driven by increasing activity from “early movers”, as well as by the boiler upgrade scheme (BUS) subsidy, which was introduced in 2022 and increased in 2023.
The BUS initially offered a £5,000 grant for those installing an ASHP or biomass boiler and £6,000 for a ground-source heat pump (GSHP). This was raised to £7,500 for both ASHPs and GSHPs in October 2023.
Beanland adds:
“[Following the increase in the grant] one of our members went back to all the consumers who they had quoted during 2023, detailing the increase, but where they had not converted the opportunity. The result was a significant number of contracts, so the additional £2,500 has certainly made a difference.
“In parallel, the whole visibility of the technology is being driven by the likes of Octopus, Good Energy and OVO, with their very high-profile campaigns and the advent of time-of-use tariffs that improve the financial benefits considerably.”
Customers who are able to afford to deploy solar PV, a battery and a heat pump can use such tariffs to reduce operational cost, allowing the heat pump to compete with gas, he adds.
The number of GSHP installations fell from 3,420 to 2,469, while solar-thermal installations nearly halved, falling from 615 to 311.
Beanland says:
“The value of the BUS for ground-source is just far too low. Government has made a conscious decision to go for numbers rather than the highest efficiency by supporting air-source to a much greater extent. This has been compounded now that the BUS levels for air- and ground- are the same.”
The surge in ASHP means that low-carbon heating technologies still saw an overall increase in 2023, rising by 20% year-on-year, as reported by BusinessGreen.
Despite this growth, however, the installation of heat pumps remains a long way from hitting the UK government target of 600,000 installations per year by 2028.
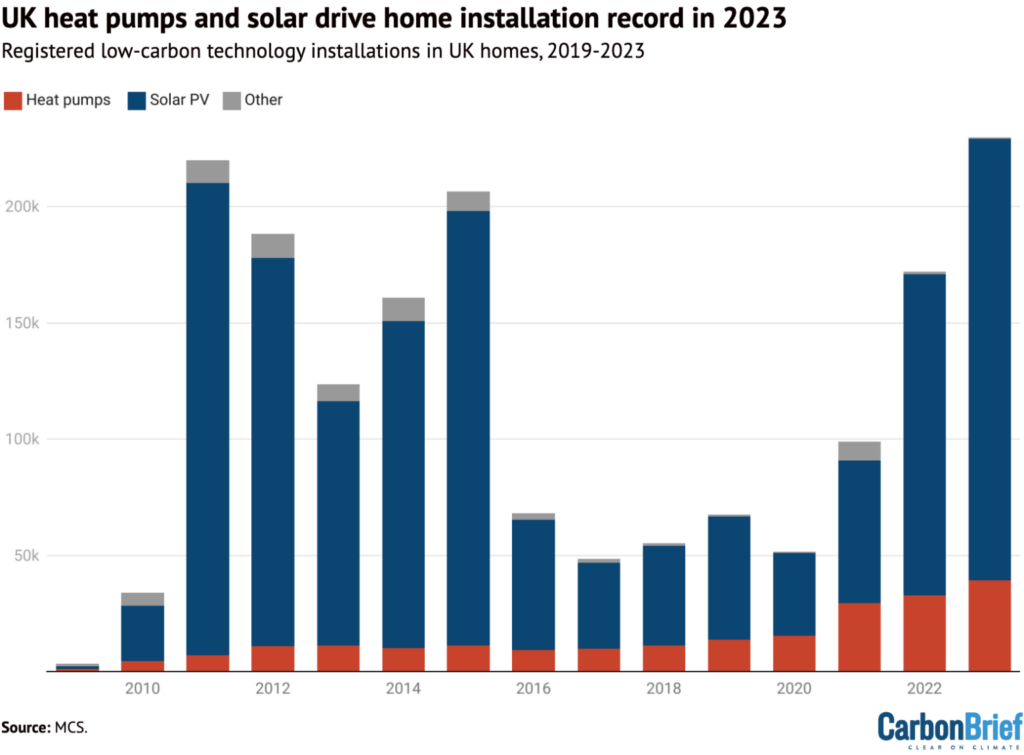
Heat pump (red), solar PV (blue) and other low-carbon installation figures from 2019-2023, from MCS’s Dashboard. Source: MCS. Chart: Molly Lempriere for Carbon Brief.
While the MCS dashboard does not provide data on battery storage installations, a recent release from the company states that 2023 was a record-breaking year for the technology. MCS says batteries were the third most popular technology type to be installed in homes by its certified contractor base.
Of the 4,700 certified batteries registered with MCS, 4,400 were installed in 2023, it adds.
With the energy price cap on average domestic energy bills now sitting below £2,000 per year and installation costs having increased with inflation, it is unclear whether the high levels of solar PV installations in 2023 will be maintained this year.
Solar Energy UK’s chief communications officer Gareth Simkins says:
“Speculation is always a dangerous game. I think it is reasonable for current deployment rates – around 15,000 a month – to continue. This will not just be retrofits of course – we expect more new build homes to carry solar, too.”
Monthly solar installations hit highs
Last year saw monthly installations of rooftop solar PV start to hit the levels seen in 2015, when government subsidies were still available, as shown by the red bars in the figure below.
March 2023 saw 20,073 registered solar PV installations, putting it in the top 10 months seen in the UK. Both 11th and 12th places were claimed by months in 2023 too, with June seeing 18,049 installations and May seeing 17,787 installations.
The rest of the top 10 installation months are dominated by 2011, 2012 and 2015. This was driven largely by subsidy deadlines, with a rush seen ahead of cuts leading to record-high installation periods.

The top 12 highest months for solar PV installation in the UK between 2009 and 2023, according to the MCS Dashboard, with the three months in 2023 shown in red. Source: MCS. Chart: Molly Lempriere for Carbon Brief.
In 2012, the FiT subsidy for solar was cut in half, reducing from 43.3p per kilowatt hour (kWh) to just 21p per kWh. This cut returns from solar electricity from around 7% to 4%, according to the Guardian.
In doing so it almost doubled the payback period for households, with some seeing their £10,000-12,000 solar panels only being in credit after 18 years rather than 10, the Guardian reported at the time.
This change followed then-climate change minister Greg Barker launching a consultation into the subsidies in an effort to avoid the industry falling victim to “boom and bust“.
Following the change, installations fell by nearly 90%, according to Department of Energy and Climate Change figures reported in the Guardian.
Installations dropped from 26,941 in March 2012 to 5,522 in April 2012, according to MCS figures, although there was a further surge later that year.
Throughout 2013, installations remained relatively subdued, growing through 2014 before peaking again in 2015. Installations hit 25,614 in December 2015, but this came ahead of further FiT reduction in February 2016, which sent “shockwaves” through the sector and saw installations drop dramatically
The FiT came to an end in 2019, with the solar export guarantee brought in 2020, which sets a minimum price for electricity exported to the grid.
Following the resulting lull in installations, domestic solar PV has once again been growing. The difference this time is that there is no underlying subsidy driving growth, with rising energy bills and longer-term falls in technology costs making the technology increasingly appealing.
Speaking to Carbon Brief, Solar Energy UK’s Simkins says:
“Oddly enough, it shows the success of FiTs in creating a market for solar in the first place, with the industry now standing entirely on its own two feet without government support.”
Installation costs rise
The inflationary impacts of the Covid-19 pandemic and the subsequent energy crisis led to an increase in solar technology costs in 2023.
Consequently, installation costs have risen over recent years, according to MCS. Across every month in 2023, average installation costs sat above £10,000 – the only time in more than a decade that they have reached that level, as shown in the figure below.
This has been impacted by the scale of the installations to a certain extent, with the installation cost per kilowatt (kW) seeing a more limited increase. Across 2022, the average cost of installing solar per kW was £1,804 and in 2023 this rose to £2,020.
Moreover, in some months, solar was actually cheaper per kilowatt (kW) in 2023 than in 2022, MCS data shows.
It is also worth noting that the increase in the cost of solar installations has not been as dramatic as the increase in energy bills over the past couple of years.
The energy crisis drove up domestic energy bills from late 2021, as supply chain squeezes driven in part by the Russian invasion of Ukraine sent gas prices to record highs.
As a result, the default tariff price cap for consumers jumped from £1,277 per year in the six months to March 2022, to £1,971 over that summer, and then to £3,549 over the winter of 2022.
It then surged again to £4,279 over the first quarter of 2023, before it began to fall (the energy price guarantee came into force in October 2022, superseding the rate of the price cap, and limiting domestic energy bills to £2,500 initially).
The surge in domestic energy prices highlighted the exposure of the British energy system to fluctuations in international gas markets. In doing so, it is likely it helped drive uptake of domestic solar – as shown in the figure below – as households looked to cushion themselves from potential future surges.
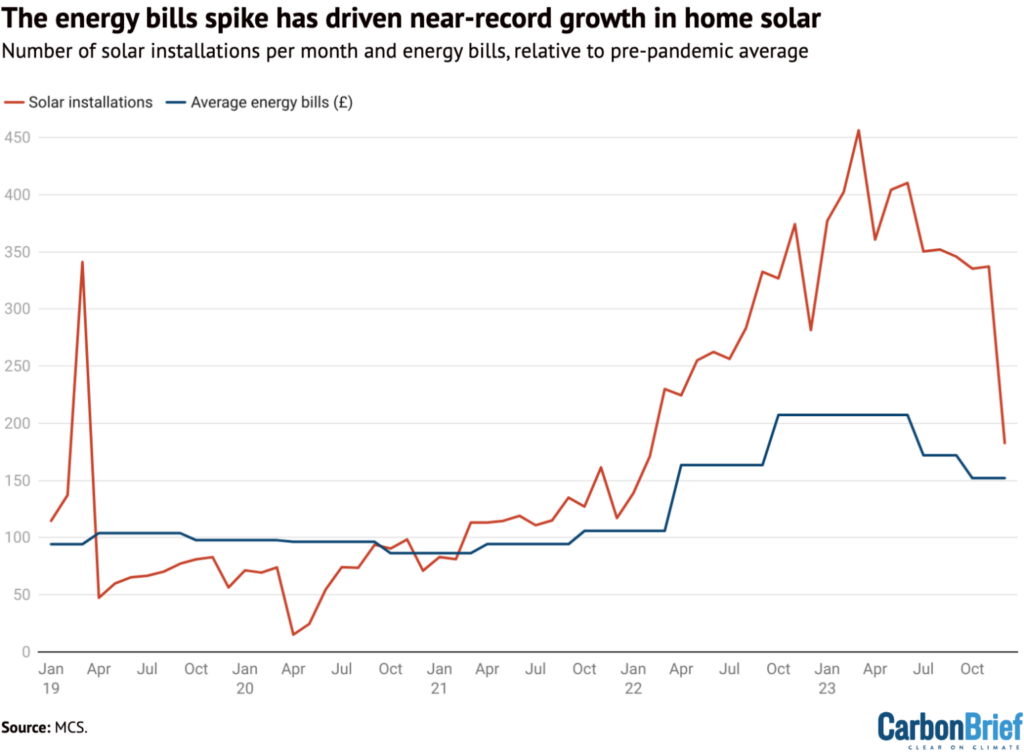
The increase in solar installations (red) in the UK based on MCS Dashboard data, and the average energy bills per month, relative to pre-pandemic average (blue) based on Ofgem’s default tariff price cap and the energy price guarantee. Source: MCS, Ofgem. Chart: Carbon Brief.
Speaking to Carbon Brief, solar wholesaler Midsummer’s commercial director Jamie Vaux says installation costs are now coming down.
The high installation costs and long installation lead times in 2022, were driven by demand exceeding supply, he says. With new installers entering the market and mortgage rates and inflation hitting consumer spending, this has started to ease, he adds.
Average installation prices per kW peaked at £2,111 in April 2023, before slowly falling throughout the year.
Vaux explains:
“Essentially, those who had the funds available when the energy crisis hit have already had their installations, and while many still want solar, the rate stopped climbing so steeply and the curve flattened at the same time as more installers were there to meet the demand. It has become more competitive at the installation level, and installation costs have (gradually) fallen as a result.”
There is also currently a glut of solar modules, which could help prices continue to fall and stimulate further update of solar, according to Vaux.
There is currently “a year’s worth of modules already sitting in EU warehouses, and devaluing daily”, Vaux adds, meaning top-tier modules can be bought for a fraction of prices seen in 2022.
Solar Scotland
The area with the overall highest share of households with solar PV installations since the start of MCS data in 2009 is Stirling in Scotland, where 16.7% of households have solar PV (6,994 households).
Perhaps surprisingly, given their poorer insolation rates relative to other parts of the UK, Scottish local authorities appear four times in the top 10, as shown in the figure below.
Scotland’s housing policy means it is mandatory for solar to be fitted on all new build properties, helping to boost installation rates.
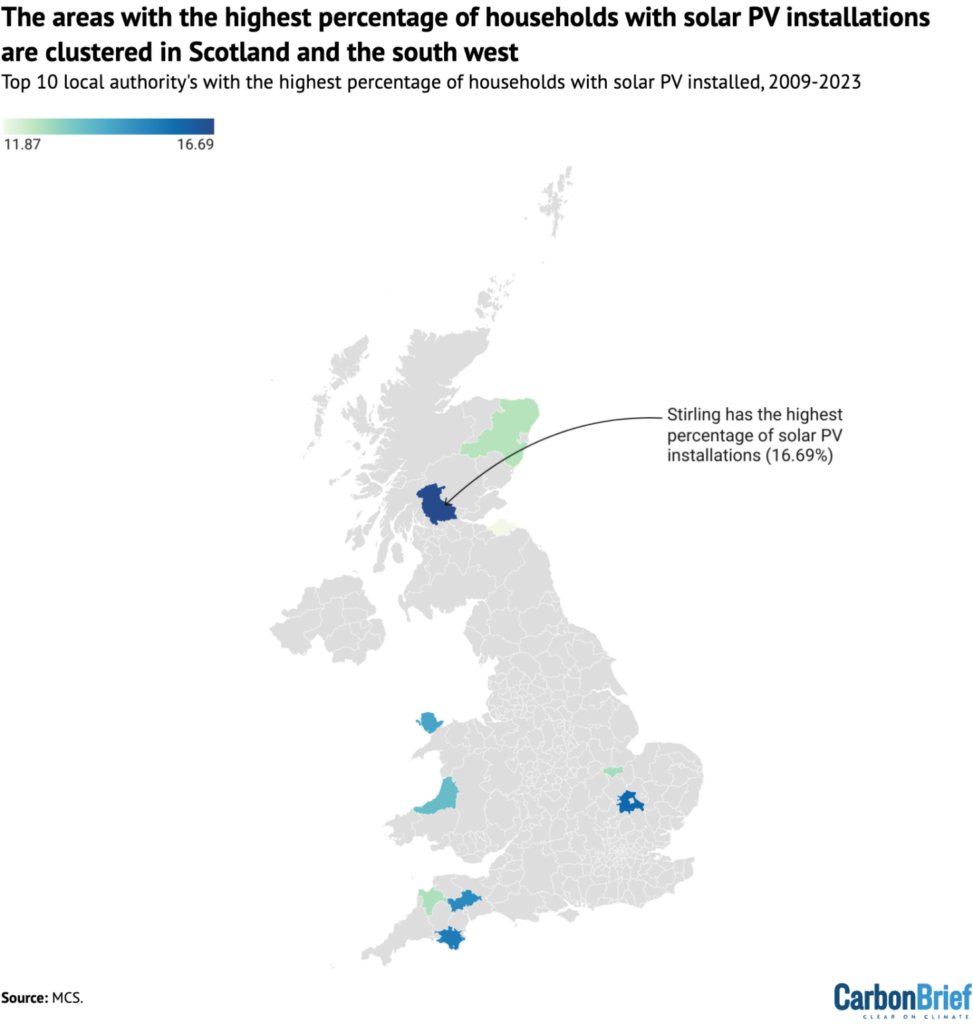
The 10 local authorities with the highest percentage of households with solar PV installations from 2009-2023, based on MCS data, showing installations clustered in Scotland, Wales and the southwest. Source: MCS. Map: Carbon Brief.
In terms of installations completed during 2023, the Isle of Anglesey came out on top, with 1,083 systems added, amounting to 3.5% of households.
The top 10 for last year is dominated by Welsh and Scottish local authorities, with just one English local authority making it into the list – South Cambridgeshire in ninth place.
There are five Scottish local authorities (Dumfries and Galloway, East Lothian, Perth, Moray and Kinross and Midlothian) and four Welsh local authorities (Isle of Anglesey, Ceredigion, Powys and Pembrokeshire).
The 10 local authority areas with the lowest percentage of solar PV installations since 2009 are all in London, with Kensington and Chelsea coming out on top with just 0.4% (or 297) of households having registered solar PV installed, according to MCS.
It is worth noting that due to the density of the households in London and other major cities, they are over-represented in the lowest percentage list for solar installations.
For example, Wandsworth – which comes out as having the tenth lowest rate of just 1.1% of households having solar PV – only has 1,496 installations.
Meanwhile, Torridge in Devon – which has the eighth highest rate of installations in the UK at 12.8% – has 3,899 solar PV installations. While this is more than double the number is Wandsworth, the much larger difference in percentage terms highlights the impact of population size in each local authority area.
The same is broadly true of 2023. While the area last year with the lowest installation rate was Derry City and Strabane, with just 73 installations (0.1% of households), the bottom ten is still dominated by London boroughs, which made up eight of the list.
Detached properties are the most common when it comes to solar PV installations, with 50,8193 of the MCS registered solar PV installations since 2009 (35.2%) having been fitted on detached properties, versus 447,415 on semi-detached, 288,886 on terraced, 187,131 on flats and apartments and 10,100 on other properties.
This means detached properties – which tend to be larger, with more roof area – are over-represented in terms of their share of solar installations, as shown in the figure below.
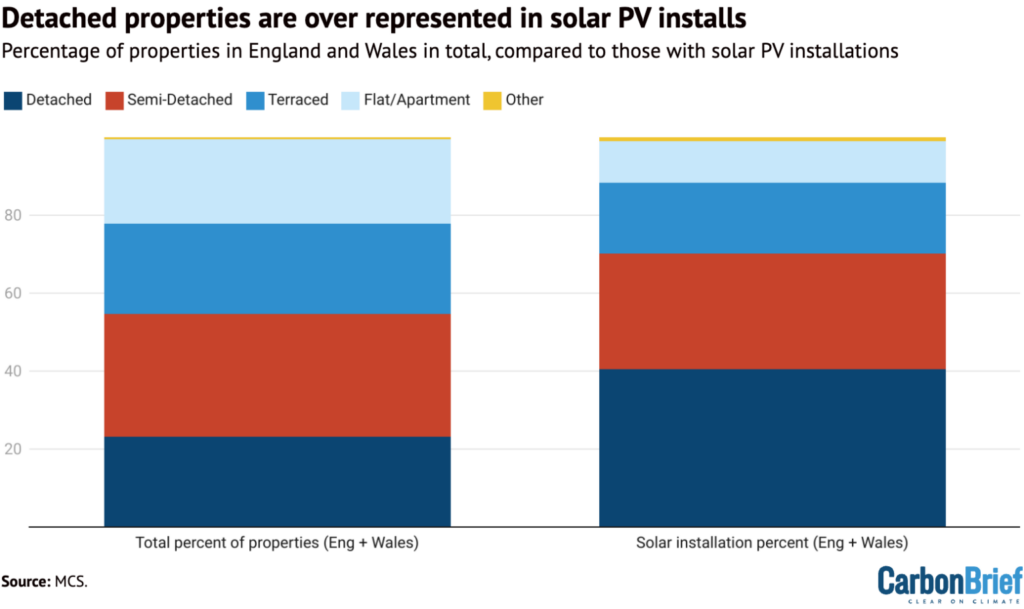
Percentage of properties in England and Wales that are detached, semi-detached, terraced, flat/apartment or other based on data from the ONS, and the percentage of properties types with solar PV installations in England and Wales between 2009-2023, based on MCS data. Source: MCS. Chart: Carbon Brief.