
In 2022 I wrote a report titled “The Status of Global Oil Production”. Annual global oil production data are now available from the U.S. Department of Energy/Energy Information Administration (U.S. DOE/EIA) for 2022 so it’s time for an update on my 2022 report.
All the data in this report comes from the U.S. DOE/EIA except for Texas Permian Basin oil production data which is from the Railroad Commission of Texas.
The data in this report applies to crude oil + condensate, what is typically identified as oil. I am not including natural gas liquids, alcohols, refinery gain or other organic liquids which along with oil I classify as total liquid hydrocarbons.
Figure I is a graph of the historical annual global oil production rate from 1973 through 2022:

Figure I
The global oil production rate in 2022 averaged 80.628 million barrels/day (mb/d). The global oil production rate in 2022 was better than the previous two years (2020 and 2021) because oil demand during those two years was down due to the COVID-19 pandemic.
When compared to 2018 and 2019, the global oil production rate in 2022 was not particularly good because the rate in 2018 was 82.986 mb/d and in 2019 it was 82.170 mb/d. The global oil production rate in 2022 was less than the 2018 rate by 2.358 mb/d and less than the 2019 rate by 1.542 mb/d.
One might have expected that the average global oil production rate would have been higher in 2022 when compared to 2018 and 2019 in-as-much as the price of oil was considerably higher in 2022. In 2022, the average price of West Texas Intermediate (WTI) was $94.53/barrel whereas in 2018 it was $65.23/barrel and in 2019 it was $56.99/barrel.
I don’t expect the 2018 global oil production rate to be exceeded in the future irrespective of how high the price of oil gets. The easy oil production increases due to high oil prices that took place in 2022 are unlikely to be duplicated in the future.
Table I has data for selected countries that experienced production increases or decreases in 2022:
| Country | Difference Between 2021 and 2022 Oil Production Rates (tb/d)* |
| World | +3481 |
| Saudi Arabia | +1331 |
| United States | +629 |
| Iraq | +386 |
| United Arab Emirates | +377 |
| Kuwait | +299 |
| Iran | +183 |
| Russia | +166 |
| Guyana | +166 |
| Brazil | +118 |
| Canada | +112 |
| Venezuela | +109 |
| China | +106 |
| Oman | +92 |
| Mexico | -18 |
| Kazakhstan | -34 |
| Indonesia | -48 |
| United Kingdom | -64 |
| Norway | -72 |
| Libya | -180 |
| Nigeria | -225 |
Table I
*tb/d represents thousand barrels/day
As the data in Table I indicates, a high percentage of the global oil production increase in 2022 came from OPEC countries, 70.07%.
Figure II is a graph of the historical annual OPEC oil production rate from 1973 through 2022:

Figure II
*OPEC members are Saudi Arabia, Iran, Iraq, Kuwait, United Arab Emirates, Algeria, Angola, Equatorial Guinea, Gabon, Libya, Nigeria, Republic of the Congo, and Venezuela
OPEC reached its highest annual oil production rate in 2016 at 35.885 mb/d which is 3.067 mb/d higher than the 2022 production rate. Is it possible for OPEC to achieve a production rate comparable to that of 2016 in the future?
I think it would be difficult and maybe impossible for OPEC to achieve the production rate of 2016 due to problems I highlighted in last year’s report, which I won’t highlight here other than to say that many of the large fields in the Middle East, such as Ghawar and Burgan, have gone well past the halfway point of their Estimated Ultimate Recovery (EUR) values.
The Russian/Ukraine Conflict and OPEC+
Every year there are events that have the possibility of reducing the global oil production rate. In 2022, the two big events that could have reduced the production rate were the sanctions on Russia due to the Russia/Ukraine war and second, the agreement among OPEC+ members to reduce their summed oil production rate by 2 mb/d starting in November 2022. How much did those events affect global oil production?
Figure III is a graph of the historical annual Soviet Union/Russian oil production rate from 1973 through 2022:

Figure III
*The Soviet Union broke up in 1991
The Russian oil production rate in 2022 averaged 10.278 mb/d, up from 10.112 mb/d in 2021. Due to sanctions, the production rate did drop below 10.0 mb/d in April and May but then exceeded 10.0 mb/d for the rest of the year with November and December having production rates 10.377 mb/d and 10.352 mb/d respectively.
Prior to the sanctions, the Russian oil production rate was a bit over 10.6 mb/d for February and March 2022 so production in late 2022 was still a little lower than in the early months of 2022. In terms of the global oil production rate, the impact of the sanctions on Russia were minimal, well under 1% of global oil production.
How did the announced OPEC+ oil production cuts (https://www.axios.com/2022/10/05/opec-cutting-oil-output-rising-gas-prices) affect global oil production in 2022? The cuts for the individual OPEC+ members were expected to start in November 2022 and run through to the end of 2023.
Out of curiosity, I added up all of the production numbers for OPEC+ members during October 2022 and December 2022 to see if they actually cut production. As it turned out, the summed production rate for October 2022 was 49.088 mb/d and for December it was 49.394 mb/d. My impression is that OPEC and OPEC+ reported production cuts are meant to increase the price of oil without actually requiring countries to cut production.
Some of the OPEC+ members decreased their production while others increased their production from October to December. The Middle East OPEC nations collectively reduced their production rate by 229,000 b/d. On the other side of the ledger, Kazakhstan increased its production rate by 388,000 b/d, Russia by 125,000 b/d, and Nigeria by 140,000 b/d.
Figure IV is a graph of the historical annual oil production rate for present OPEC+ members from 1973 through 2022:

Figure IV
*Production from OPEC members + Russia, Kazakhstan, Azerbaijan, Mexico, Oman, Bahrain, Brunei, South Sudan, Sudan and Malaysia
The annual oil production rate for the OPEC+ nations reached its highest level in 2016 at 52.891 mb/d. The rate in 2022 was 48.809 mb/d, 4.082 mb/d less than in 2016. Some of the OPEC+ nations have had declining oil production rates in recent years and will never again achieve the production rates that they once had.
The Impact of Higher Oil Prices on U.S. Oil Production in 2022
The oil production rate in the U.S. increased fairly significantly in 2022 due to high oil prices. Figure V is a graph of the historical annual oil production rate for the U.S. from 1930 through 2022:

Figure V
The U.S. oil production rate in 2022 increased by 629,000 b/d with most of the increase coming from the Permian Basin of Texas and New Mexico. The 2022 production rate is still below the 2019 rate by 406,000 b/d. I will detail in the future U.S. oil production for 2022 with a separate report “The Status of U.S. Oil Production: 2023 Update”.
Figure VI is a graph of the global oil production rate minus the U.S. oil production rate from 1973 through 2022:

Figure VI
The global oil production rate minus the U.S. oil production rate in 2022 was 68.755 mb/d. The highest rate was achieved in 2016 at 72.196 mb/d, 3.441 mb/d higher than in 2022.
The Twilight Years of the North Sea
After the OPEC oil embargos of the 1970s, the North Sea became a prominent oil producing province, as did Mexico and Alaska.
Figure VII is a graph of the historical annual oil production rate for the North Sea (Norway, United Kingdom and Denmark) from 1973 through 2022:

Figure VII
The North Sea oil production rate dropped from 2.649 mb/d to 2.514 mb/d, a drop of 135,000 b/d from 2021 to 2022. North Sea oil production reached its highest rate in 1999 at 6.003 mb/d, 3.489 mb/d higher than in 2022.
In 2022, oil production from the North Sea represented 3.12% of the global oil supply. The production rate is now a long way from those heady days in the late 1990s and production will continue to go down in the future, in general.
The Impact of Higher Oil Prices on Southeast Asian Oil Production in 2022
Figure VIII is a graph of the historical annual oil production rate for Southeast Asian nations during the period 1973 through 2022:
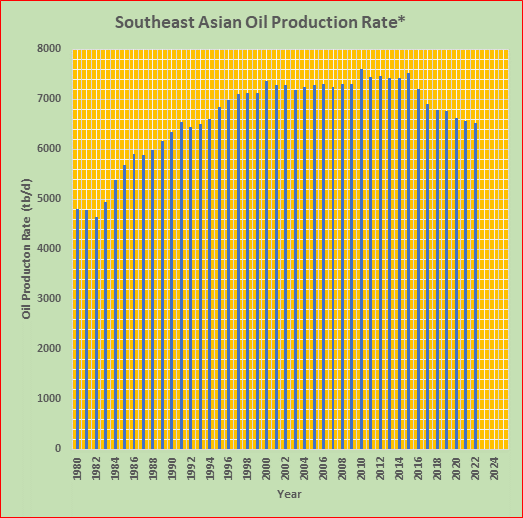
Figure VIII
*Southeast Asian nations include China, India, Indonesia, Australia, Malaysia, Vietnam, Thailand, Burma, Philippines, and Brunei
Southeast Asia has been a significant source of global oil over the years. For instance, in 1990 Southeast Asian oil production represented 10.5% of total global production. In 2022, it still represented 8.1% of global production even though production is declining and will, in general, decline in the future.
Oil production in Southeast Asia declined by 36,000 b/d in 2022 relative to 2021. The only country that experienced an increase in production was China, an increase of 106,000 b/d.
The Impact of Higher Oil Prices on South American Oil Production in 2022
Figure IX is a graph of the historical annual oil production rate for South American countries from 1973 through 2022:

Figure IX
The South American oil production rate increased by 325,000 b/d from 2021 to 2022. The summed increase in production for Brazil, Venezuela and Guyana was 393,000 b/d so the rest of the continent had a summed decrease in its production rate of 68,000 b/d.
Brazil’s oil production rate may increase a bit further but the writing is on the wall, declining production is not too far away. Essentially all of Brazil’s oil production is offshore and development is getting quite mature.
Oil development in Guyana is relatively new so production can increase for some years to come. The Guyanan government is projecting a production rate of 825,000 b/d in 2025, up from 276,000 b/d in 2022. What I see for Guyana is a rapid rise up and a rapid decline down for oil production. Maybe the production rate can exceed 1 mb/d at some point but that production level won’t last long.
Venezuelan oil production has been in the dumps in recent years due to political problems. It’s possible for the production rate to get back over 1 mb/d if political problems can be resolved. The production rate in 2022 was 0.704 mb/d.
The Impact of Higher Oil Prices on Central Asian Oil Production in 2022
Figure X is a graph of the historical annual oil production rate for Central Asian countries (Kazakhstan, Azerbaijan, Turkmenistan and Uzbekistan) from 1973 through 2022:

Figure X
Central Asia has become a fairly significant oil producing region in the last few decades. Most of the oil comes from Kazakhstan and Azerbaijan. Production from those two countries has been falling in recent years. We’ll have to wait and see if that trend continues in the future.
Where are we going from here?
Maybe my crystal ball is a bit foggy but I see trouble ahead for global oil production over the next decade and beyond. For the period 2008 through 2018, almost all of the global oil production increase came from 5 shale plays in the U.S.: Permian Basin, Bakken, Eagle Ford, Niobrara and Anadarko.
The situation isn’t looking so rosy for the future of those 5 shale plays. The 2nd and 3rd highest producing shale plays, Bakken and Eagle Ford, have experienced a summed decline of nearly 900,000 b/d since their respective peaks. The 4th and 5th highest producing shale plays, Niobrara and Anadarko, are running roughly 300,000 b/d lower than their summed highest production rates.
What pushed U.S. oil production up in 2022, relative to 2021, was largely the rapid rise of Permian Basin oil production. The Permian Basin now produces approximately 45% of all the oil produced in the U.S. I would not be surprised if oil production from the Texas portion of the Permian Basin declines this year (2023) relative to 2022.
When measured on a quarterly basis, the highest production rate from the Texas portion of the Permian Basin was achieved in the 1st quarter of 2020 at 3,265,125 b/d, about 150,000 b/d higher than the production rate during the first 9 months of 2022.
Oil production from the New Mexico portion of the Permian Basin continues to rise and it may well rise for a few more years but it won’t go on rising indefinitely. Once total Permian Basin oil production starts declining, it will drag U.S. oil production down along with it.
I think it’s realistic that the U.S. oil production rate could decline by over 5 mb/d for the 10 year period from 2023 through 2032. A decadal decline of that magnitude would be a considerable shock to the U.S. economic, financial, and political systems as well as to the American public that is oblivious to the U.S. oil supply situation.
As I pointed out in my report of last year, there are oil production problems around the world, even in the Middle East. A rapid decline of U.S. oil production would have implications globally because there are no places left globally to make up for a sizeable rapid decline in U.S. production.
Beyond the U.S., Saudi Arabia relies almost exclusively on a small number of very large oil fields. Its major fields such as Ghawar, Safaniya, Abqaiq, and Shaybah have been producing oil for decades and depletion is now a serious problem in those fields.
After another year of oil production, the Ghawar field, the largest conventional oil field in the world, has produced roughly 86 Gigabarrels (Gb) of oil. The EUR of Ghawar is on the order of 110-120 Gb. That means that Ghawar has probably produced over 70% of its ultimate recoverable oil.
A situation similar to the Ghawar field exists for the Safaniya, Abqaiq, and Shaybah fields. Unfortunately Saudi Arabia and the other Middle East OPEC nations don’t provide detailed oil field data to allow oil analysts to assess their supply situations like countries such as Norway and the United Kingdom do.
Saudi Arabia can no doubt bring on some smaller fields but that would only hold off the inevitable for a short time. Saudi Arabia is also not the only Middle East OPEC nation that has depletion problems with major fields.
In Kuwait, the Greater Burgan fields produce most of that nation’s oil. Probably well over 60% of the EUR for the Greater Burgan fields has been produced or burned off in the Gulf War of 1990-1991.
The one exception in the Middle East is Iraq. Because of its checkered history with military conflicts it did not produce oil at the rate it could have in the past. Because of that, Iraq could probably achieve a production rate of over 5 mb/d and maybe 6 mb/d in the near-term future.
Beyond the Middle East, prospects for new oil production don’t look good. Guyana can increase production further but I would expect that a rapid rise would be followed by a rapid decline. Also, Guyana is never going to be a major oil producing nation.
Russia might be able to increase its production rate to over 11 mb/d but they have significant problems in their major oil producing provinces and declining production probably isn’t far down the road.
Brazil may be able to increase production for a bit longer but their offshore oil developments are getting quite mature.
The problem as I see it is that there are many oil fields and oil provinces that are now in decline and more will be added in the future. Those declining fields and provinces will negate production increases from places like Guyana.
A Sparkling Future with Renewable Energy
Of course the idea for future energy use in the U.S. and beyond is that everything will be electrified including the transportation system which consumes much of the oil used in the U.S. Everything will be powered by renewable energy sources such as wind and solar. Electrification will occur in fairly short order so oil will soon be a thing of the past. There will be virtually no greenhouse gas emissions to worry about in the future since everything will run on renewable energy sources.
Americans will be able to maintain their high consumption American lifestyle and have little or no environmental impact. That sounds too good to be true and many energy analysts have made the case that it is too good to be true. Here is one example:
https://www.resilience.org/stories/2023-04-10/the-rising-chorus-of-renewable-energy-skeptics/
Recently the media in the U.S. has been touting the goal of the U.S. Environmental Protection Agency (U.S. EPA) of having two-thirds of all new vehicles be electric by 2032. I place the probability of reaching that goal at zero.
Presently roughly 1% of all motor vehicles on the roads of America are electric. In a best case scenario, it would take decades to get that number up to 50% or higher. There are good reasons why a person might not want an electric vehicle and that will limit how many electric vehicles get sold in the future. It should also be pointed out that the process of manufacturing electric vehicles, as well as essentially all other manufactured goods, requires a significant amount of fossil fuel energy.
I expect that oil will continue to be in high demand for the foreseeable future irrespective of the environmental impacts of oil use. Short-term desires that involve the use of oil and oil distillates are far more important to Americans than the long-term consequences of environmental issues such as global warming.
If there was a desire to seriously address global warming in the U.S., a major emphasis should be on reducing the need for energy as much as possible by among other things getting Americans out of their motor vehicles. In general, Europeans have a per capita CO2 emission rate that is roughly half of that of Americans. The difference in energy use between Europe and the U.S. is largely due to differences in the infrastructure of European countries versus America.
America is dominated by urban sprawl which is very energy inefficient and leads to a high per capita CO2 emission rate. I fail to hear proposals for containing and reducing America’s sprawl to reduce CO2 emissions from politicians, bureaucrats, environmental activists and pretty much anyone else.
There are frequent media stories in the U.S. about all the progress being made in converting the U.S. and global energy supplies to renewable energy but global CO2 emissions continue to rise outside of the COVID-19 pandemic dip. The consequences of global warming are far more serious than the effort so far to address the problem.
Renewable energy promoters portray the transition to renewable energy as being cheap and easy. If it were cheap and easy we would be well on the way to the zero net CO2 emissions goal. As the renewable energy promoters see it, the fossil fuel industries have captured the U.S. political system to prevent the transition to renewables. As far as I can see, the fossil fuel industries have significantly captured the political system, at least 1 party, but there are other problems hobbling a transition to renewables.
The unwillingness of renewable energy promoters to advocate for lifestyle changes and an infrastructure less dependent upon energy is preventing a more rapid decline in CO2 emissions in the U.S. The idea of addressing urban sprawl related energy inefficiency in the U.S. appears to only be discussed by a very select group of people.
Conclusion
It appears to me that the wolf is nearing the door when it comes to oil supply problems but it’s a topic that is almost never mentioned anymore by the mainstream media in the U.S. The media was excited about the U.S. oil supply during the boom years from 2008 through 2019 but not anymore. Thus, we are heading blindly into the future oblivious to what is coming.
When it comes to global warming, there has been a fair amount of coverage from the mainstream media in the U.S. during the last year but I see it as often Pollyannaish. A common theme is that future conditions might be a little bit unfavorable but we will adapt and with our transition to renewable energy sources, we’re actually moving into a utopian future. I think we’ll end up a long way from utopia.
Photo by Zbynek Burival on Unsplash