Ed. note: You can find Part , Part 2 and Part 3 of this series on Resilience.org here, here, and here.
This is the fourth of a series of articles about the developments of the global food system. The three previous articles were based on the FAO database. This one is mainly based on the USDA Economic Research Services data on agriculture productivity.
Dramatic growth in output with a dramatic increase in fertilizers

The graph shows the development of some key factors in the global agriculture system. Crop output (measured in value) has increased with 282 percent and livestock output (value) with 243 percent (this can be compared with the output in weight which was 268 percent for crops and 206 percent for livestock products). To produce this the use of machinery increased with 444 percent, fertilizers with 338 percent, capital with 245 percent, irrigated area with 134 percent, labor with 28 percent while cropland area increased with 20 percent and pasture area with a mere 2 percent.* The increase in the use of fertilizers has slowed down a bit with a remarkable drop in the end of the 1980s, which has to do with the collapse of the Soviet Union and its satellite states. Fertilizers were subsidized and used indiscriminately.

As time goes farmers have learnt to use fertilizers more efficiently, but there are limits to how much fertilizer use efficiency can increase. It has reached a plateau in the countries that has used fertilizers for a long time.
Irrigation and fertilizers have clearly increased yields tremendously. Irrigation in arid climates may mean very high increase in productivity as well as multiple annual crops. In the Mekong delta farmers reportedly take three rice crops per year.
[slide-anything id=’3472166′]
In addition to the factors in the graph there are of course others which may increase output, such as the use of pesticides, improved varieties, biological nitrogen fixation, improved crop rotations and general management issues such as a better conversion of feed. As human labor is costly, the huge increase of machinery and capital at the expense of labor is quite logical in a market economy. The use of machinery is, however, more about saving labor than increasing output.
Regional differences
The data above are all global. It becomes a lot more interesting when data is differentiated into groups of countries based on GDP.
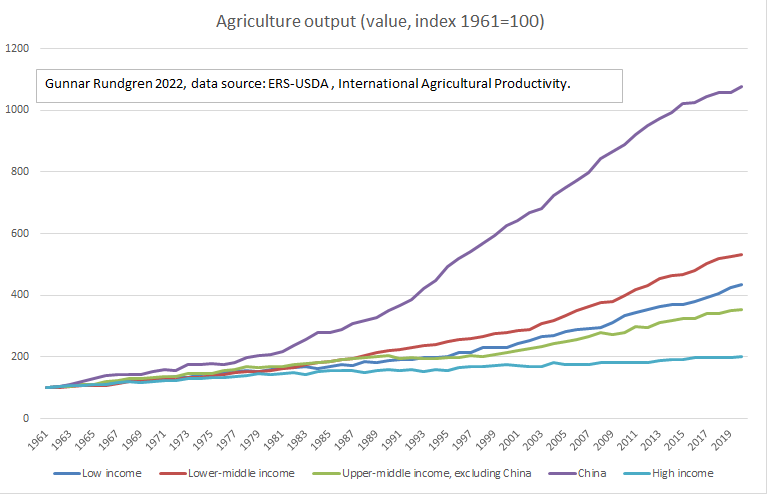
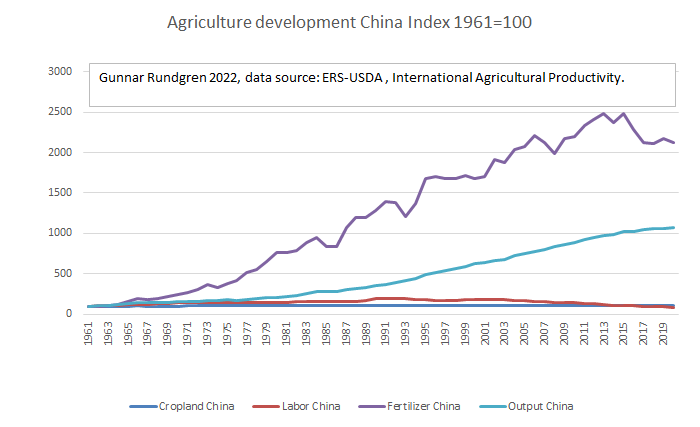
The most remarkable development when it comes to output is in China, where output has increased almost 1000 percent. The output in China was accomplished with a small increase in cropland area and no increased use of labor but with a tremendous increase in the use of fertilizers. This was from a very low level, 2.3 million tons which went to 49.9 million tons. Chinese farmers now use 22% of all fertilizers in the world. Increase in the use of machinery was even higher, although I doubt the accuracy of the data for machinery, especially for China (see more below).
The deployment of labor is very different in poor countries compared to the rich ones. In high-income countries the labor deployed is only 24 % of the value for 1961 while in low-income countries labor use has increased 3 times. The large middle group shows a pattern where agriculture labor first increased and then started to decrease reflecting an agricultural transition which already occurred 100 years ago or more in the high-income countries. Notably “low-income” countries as a category is defined as per their situation today. Just since 2003, the number of low-income countries has nearly halved, declining from 66 to 31 in 2019 which means that the graph can be somewhat misleading.
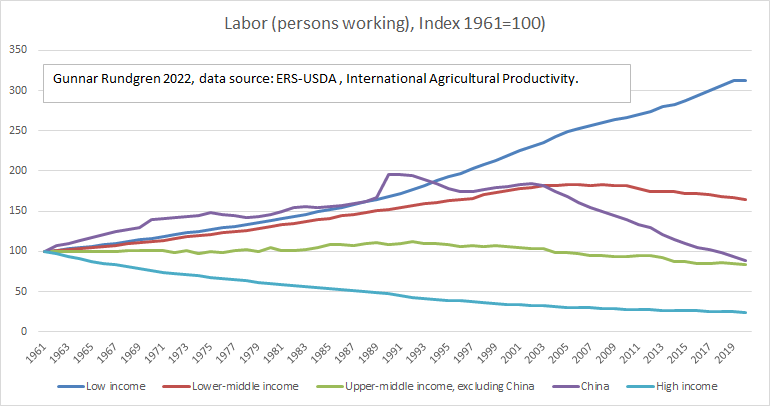
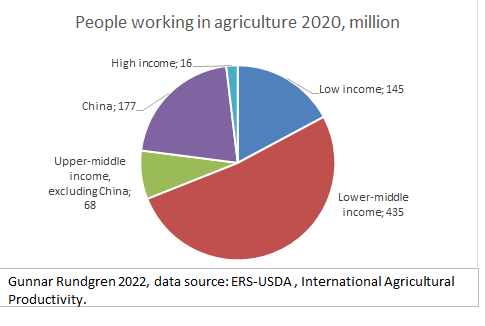
In total some 850 million people are working in agriculture globally of which more than half in lower-middle income countries (e.g. India, Indonesia, Kenya) and just 16 million in high income countries.
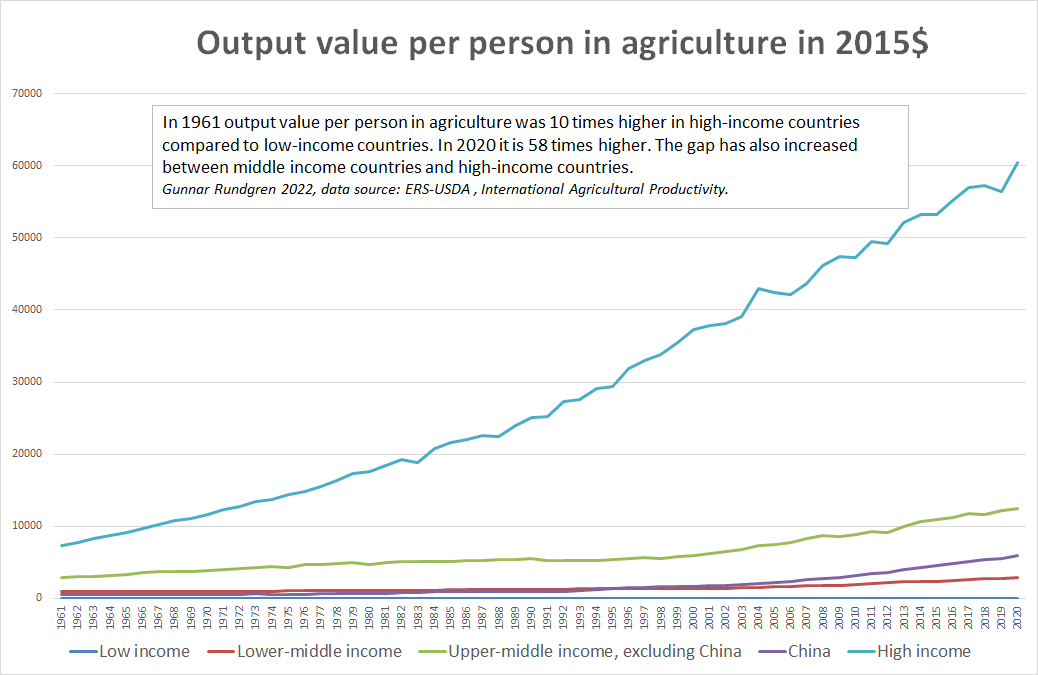
We see an even more dramatic picture if we study the value produced per labor unit (in this case a person primarily employed in agriculture). In 1961 output value per employee in agriculture was 10 times higher in high-income countries compared to low-income countries. In 2020 it is 58 times higher. The gross annual income generated by one person in low income countries in average just above US$ 1000, the net income is obviously much lower. The gap has also increased between middle income countries and high-income countries. One really wonder if it possible for low-income countries to develop their agriculture sectors if they are exposed to competition from the other countries. There is certainly a limit to how cheaply one can work. Note that many people in the agriculture sector are “underemployed”, i.e. even if their primary occupation is in farming, they don’t do a full time job there. Others are of course working a lot more than a full time job. My guesstimate, based on my work in low-income countries, is that many people there are subsistence farmers who often seek casual employment here and there.
Obviously, there is a connection between the use of machinery and the use of labor, where machinery use is very low in low-income countries. The data from USDA ERS doesn’t seem to be sufficiently accurate on a country level to allow for meaningful comparisons though, especially when it comes to China, which according to their data alone commands almost 50% of all agriculture machinery in the world. The use of machinery, according to USDA ERS, corresponds to 35 hp per person employed in high income countries, 3 hp per person in upper middle income and just 0.06 hp per person in low income countries (less than 1/500 of the high income countries). Even if the data is shaky it gives you an idea of the enormous gap between rich and poor countries.
* Explanation of the categories
| Output (total) | Gross Value of agricultural output from crops, livestock and aquaculture, $1000 at constant 2015 prices |
| Output (crop) | Gross value of 162 crop commodities, $1000 at constant 2015 global average farmgate price |
| Output (animal) | Gross value of 30 animal and insect products, $1000 at constant 2015 global average farmgate price |
| Cropland | Total cropland (including arable land and land in permanent crops), 1000 hectares |
| Irrigation | Total area equipped for irrigation, 1000 hectares |
| Pasture | Total area in permanent pasture, 1000 hectares |
| Labor | Number of economically active adults (male & female) primarily employed in agriculture, 1000 persons |
| Capital | Value of net capital stock, $1000 at constant 2015 prices |
| Machinery | Farm inventories of farm machinery, measured in thousands of metric horsepower (1000 CV) in tractors, combine-threshers, and milking machines |
| Materials | Index of crop and animal intermediate inputs, 2015=100 |
| Fertilizer | Total N, P2O5, K2O nutrients from inorganic fertilizers and N from organic fertilizers applied to soils, in 1000 metric tons |
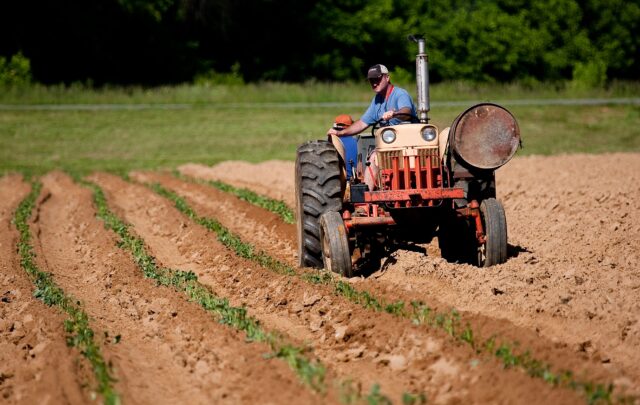
Teaser photo credit: Subsistence farmers selling their produce. By Ayotomiwa2016 – Own work, CC BY-SA 4.0, https://commons.wikimedia.org/w/index.php?curid=63602224