
 I was sceptical about a paper reviewing the current status of the outcomes of The Limits to Growth scenarios which was published by a researcher at KPMG. Having read it, I was completely wrong to be sceptical. A typescript version of the published article is available on the KPMG website (pdf). (The journal version is here, but paywalled).
The paper is by Gaya Herrington (formerly Gaya Branderhorst) and is called ‘Update to limits to growth’. It seeks to follow up Graham Turner’s work in assessing actual outcomes against the projected scenarios in The Limits to Growth, published in 1972, and the 30-year update published in 2002. Turner found that the Limits scenario that was tracking most closely was the base case, that led to industrial decline in the next decade or so, and population decline in the decade after that.
Misunderstandings
The reason for my scepticism was that many of those who savaged The Limits to Growth work in the 1970s clearly did so for ideological reasons—to the extent of making up claims by the Limits researchers that could then be discredited. Other critics simply misunderstood the model, or in some cases, the way that systems dynamics works.
Ugo Bardi has explained this “demonisation” process for those who are interested. And even now, on the eve of its 50th anniversary, some of those misunderstandings still float around when Limits to Growth is discussed. I wasn’t sure that KPMG would be that committed to academic analysis.
There’s not the space here to go into the detail of Limits to Growth or its model. But if you need a quick primer, I wrote an extended review of the Limits to Growth 30-year update on my blog a few years ago. The main thing to know is that the model is built on some parameters that are related to each other, and different scenarios make different assumptions about how those parameters play out over time.
Likely outcomes
In her paper, Gaya Herrington has taken four of those scenarios to find out how they are playing out against actual data, and what that means for likely outcomes over the next couple of decades.
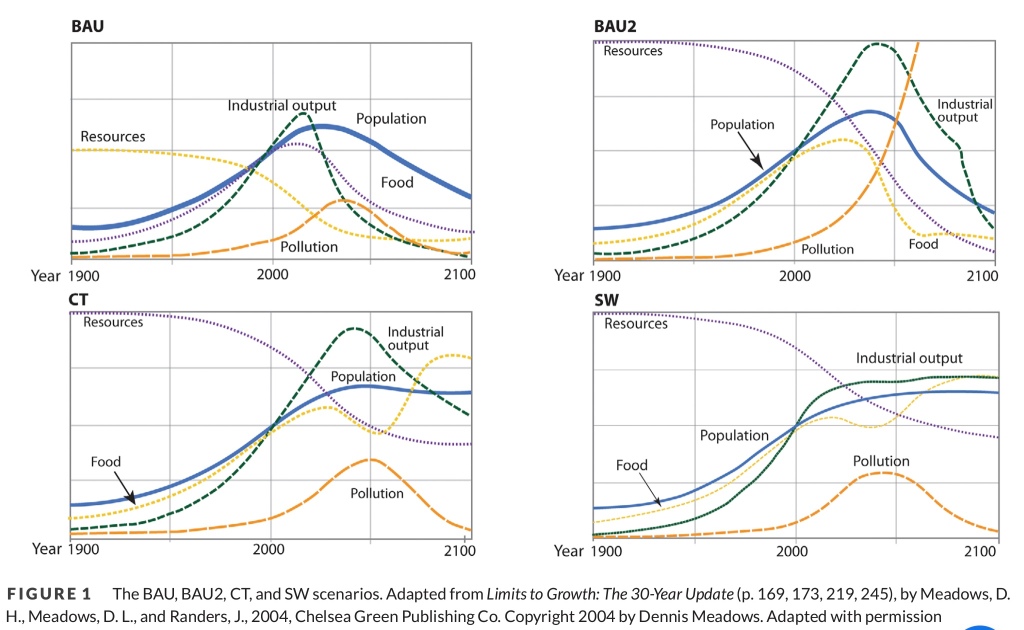
The four scenarios she chose are, Business As Usual (BAU); Business as Usual 2 (BAU2), which is a revised later version of BAU; Comprehensive Technology (CT); and Stabilized World (SW).
The first two are fairly self-explanatory. The others involve some change:
CT assumes a range of technological solutions, including reductions in pollution generation, increases in agricultural land yields, and resource efficiency improvements that are significantly above historic averages (Meadows et al., 1972, p.147). The SW scenario assumes that in addition to the technological solutions, global societal priorities changed from a certain year onward (Meadows et al., 1972). A change in values and policies translates into, amongst other things, low desired family size, perfect birth control availability, and a deliberate choice to limit industrial output and prioritize health and education services.
The way these four play out can be seen in the diagram, which is taken from her paper.
Industrial decline
It’s worth noting that you can’t read across the four diagrams: the point is to look at the trends within each one. ‘Pollution’ is a parameter that includes all the undesirable outcomes of economic production, including climate change.
Both BAU and BAU2 are catastrophic; global industrial decline in the near future followed by population decline. And when you look at the slowing growth rates and declining productivity rates that keep perplexing economists, it’s maybe a sign that we are already on the runway for this outcome.
Comprehensive Technology has an industrial decline, while population stabilises. In Stabilized World, industrial output and population both stabilise.
[slide-anything id=’3472166′]
In comparing outcomes with the Limits projections, Herrington finds that BAU2, and CT track the actual outcomes closely: BAU quite a lot; SW not so much.
Technology limits
One of the problems with CT, though, is that it that the model assumes levels of technological innovation that are well ahead of our actual levels of innovation at the moment.
The assumptions underlying CT are highly optimistic given historic figures. For example, CT assumes technological progress rates of 4% a year which, amongst other things, should lead to reductions in pollution emissions of 10% from their 2000 values by 2020 and 48% by 2040.
Actual technological progress rates are closer to 1.5%.
Social tipping points
But as Herrington notes, the historical perspective, however interesting it is, is not the main point here. What we’re also interested in is our chances of escaping declines in living standards and population.
Two best fit scenarios that marginally align closer than the other two, point to the fact that it’s not yet too late for humankind to purposefully change course to significantly alter the trajectory of future data points. The fact that the SW scenario shows the smallest declines, suggests that if we are to bet our future on the possibility of tipping points, rather than just the technological ones, we should also aim for the “social tipping points.” A transformation of societal priorities which, together with technological innovations specifically aimed at furthering these new priorities, can bring humanity back on the path of the SW scenario.
Window of opportunity
She concludes that we still have a chance here: the Stabilized World is still a possibility.
World3 also indicates the possibility, for now, of limiting declines to less than in the CT. Although SW tracks least closely, a deliberate trajectory change brought about by society turning toward another goal than growth is still possible. The LtG work implies that this window of opportunity is closing fast.
There’s one more point here that’s relevant. Economists such as Branko Milanovic argue that flattening out growth—whether that’s “post-growth” or “de-growth”—is not going to be possible because people won’t accept it.
But that’s not the choice. The choice is that either we end up with unmanaged decline, which would be catastrophic, or a managed levelling out of our economies, shaped by a shift in social values and expectations. We need some politicians who are willing to be honest about this.
This article is also published on my Just Two Things Newsletter.