For the first time, the European Union generated more electricity from wind, solar and biomass than from coal in 2017, according to new analysis from two thinktanks.
The figures, from London-based Sandbag and Berlin-based Agora Energiewende, are a best estimate, based on near-complete electricity market data from each of the 28 EU member states.
Their report says: “This is incredible progress, considering just five years ago coal generation was more than twice that of wind, solar and biomass.”
Despite this new milestone, EU power sector emissions were unchanged in 2017, the analysis suggests. Low-carbon sources met 56% of demand, a figure that is unchanged since 2014.
Renewable milestone
Wind, solar and biomass now supply more than a fifth of the electricity generated in the EU, at 20.9%, up from less than 10% in 2010. This is a few tenths of a percent more than coal (20.6%) and also more than gas (19.7%).
Since 2010, output from these renewable sources increased by 377TWh, more than the UK’s current total annual demand. Most of this increase is due to wind (57%) and solar (25%), with a smaller contribution from biomass (18%).
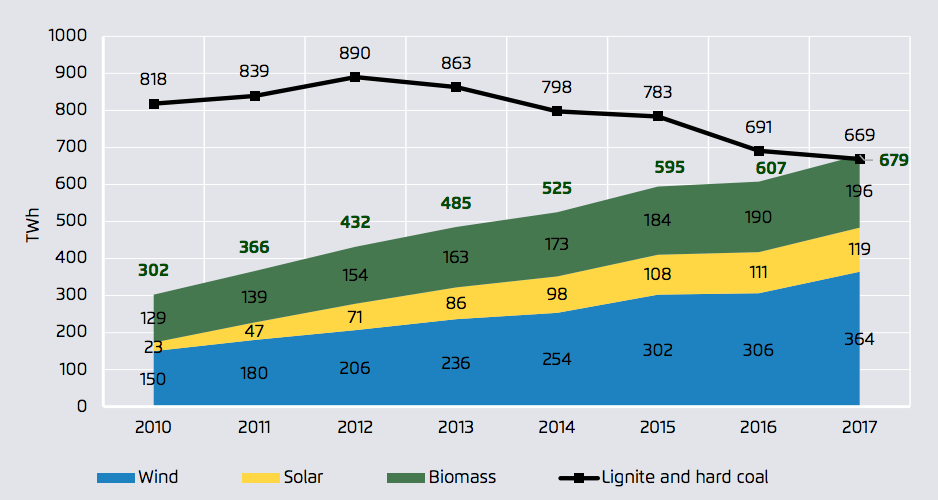
EU electricity generation from wind, solar, biomass and coal. Source: The European Power Sector in 2017, Sandbag and Agora Energiewende.
Another significant milestone was crossed in 2017 with wind generation overtaking hydro for the first time. The US is expected to see a similar switch this year or next.
In 2017, biomass generation increased by 5 terawatt hours (TWh, 3%), leading Sandbag and Agora to say: “The biomass boom is over in Europe.” The report adds:
“Given concerns over biomass sourcing…the slowdown is, perhaps, a relief. Co-firing in coal power plants is no longer rising and the pipeline for planned conversion of coal power plants to run on biomass is quite small.”
Germany is the largest contributor to biomass generation, where hundreds of small biogas plants benefited from generous subsidies, which have since tailed off. The UK is the second largest, generating 16% of EU biomass electricity, of which around two-fifths is from Drax.
Coal phaseouts
This coming of age for newer renewables has been matched by falling coal output, down 25% in five years. There was a particularly steep fall in 2016, as a “huge” coal-to-gas switch across the bloc helped push EU power sector CO2 emissions down by nearly 5%. This year, EU coal generation fell 3%.
Air pollution rules, ageing capacity, stagnant demand and competition from gas, as well as renewables, have spelt trouble for the finances of the EU’s coal fleet. In the UK, a top-up carbon tax has been significant in driving coal’s decline.
The UK is among five EU member states to have announced coal phaseouts. It recently confirmed plans to close its remaining coal plants by 2025. It has been joined by France, with a 2021 phaseout, as well as Italy, by 2025, with the Netherlands, Denmark and Portugal following, in 2030.
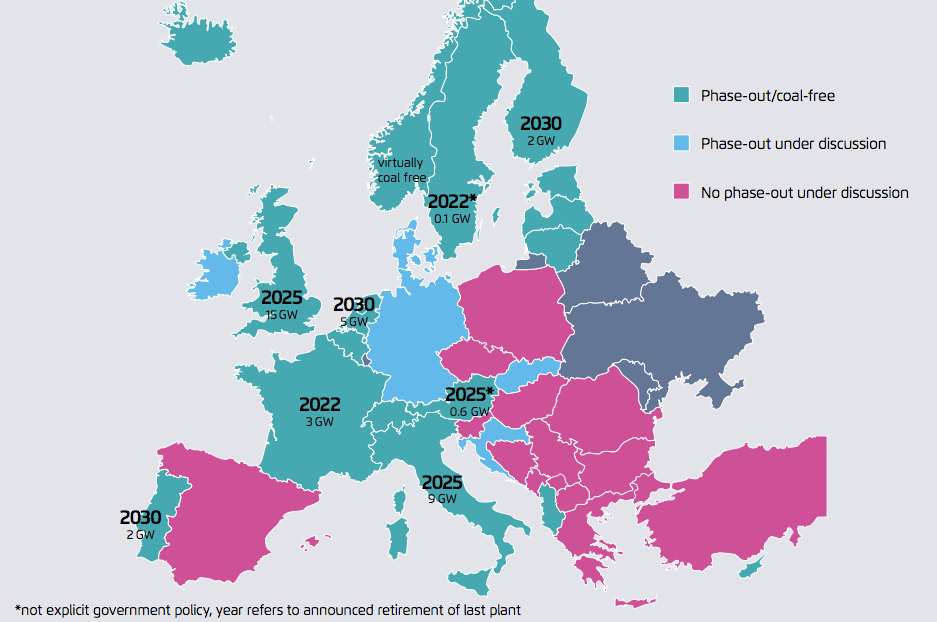
EU member states that are already coal-free or have explicit or implicit phaseout plans are shown in turquoise, with phaseout years and remaining coal capacity, in gigawatts. Member states discussing coal phaseouts are shown in blue and the remainder are in pink. Source: The European Power Sector in 2017, Sandbag and Agora Energiewende.
The Netherlands’ move is notable, because coal still supplies a quarter of its electricity and its remaining coal-fired plants were mostly built only two or three years ago.
Germany is among a further five member states discussing the idea of a coal phaseout. A draft coalition agreement between Angela Merkel’s Christian Democrats (CDU) and the Social Democrats (SDP), leaked earlier in January, commits to agreeing a firm coal phaseout date.
While the likes of Poland are far from considering a coal phaseout, its energy minister says no new coal plants will be built beyond those already under construction. Some 157 gigawatts (GW) of coal capacity remains operational across the EU.
Nuclear number one
While renewables rise and coal falls precipitously, one relatively constant feature of the EU’s power sector has been nuclear. In 2017, it was once again the single-largest source of electricity, generating 25.6% of the bloc’s power, as the chart below shows.
Annual EU electricity generation by source, 2010-2017. Source: The European Power Sector in 2017, Sandbag and Agora Energiewende. Charts by Carbon Brief using Highcharts.
Nevertheless, EU nuclear output has fallen slowly as old reactors have closed and, over the past two years, as a result of temporary closures imposed by safety regulators. Generation fell another 1% in 2017.
EU nuclear reactors are ageing, with relatively few new plants being planned or built. The UK’s plans for new nuclear are an exception.
Germany will complete its long-planned “Atomausstieg” (nuclear phaseout) by 2022. French president Emmanuel Macron said recently he would not do the same, as his priority was cutting CO2 emissions. France remains heavily reliant on nuclear power, see below.
Electricity mapped
EU member states each have unique electricity mixes. These result from geography – the natural resources available in each place – and from government policy.
The maps below show how much each country relies on different fuels. They show coal-heavy central and eastern Europe (top left) through to the import-dependent periphery (bottom right).
Shares of EU member states’ electricity consumption in 2017 met by coal (black shading, top left), gas (blue), nuclear (pink), wind, solar and biomass (yellow) or hydro (blue). Darker colours show heavier reliance on that source. The map for imports and exports (bottom right) shows the share of consumption met by imports (green) or exported to other countries (brown). Source: The European Power Sector in 2017, Sandbag and Agora Energiewende. Maps by Carbon Brief using Highcharts.
Notable features include that Germany is still the fourth most coal-dependent EU country, deriving 40.5% of the electricity it consumes from coal, despite getting another 36% from renewables. Wind, solar and biomass met 65% of Danish demand last year, far ahead of Germany, its nearest rival.
Apart from Denmark, the UK is the most-improved in terms of cutting coal use and increasing its renewable share. Coal’s share fell from 28% in 2010 to 7% in 2017, while wind, solar and biomass increased from 6 to 21%.
Constant CO2
In CO2 terms, last year’s changes in the EU electricity mix cancelled each other out. Indeed, low-carbon sources met 56% of EU demand in 2017, a figure that remains unchanged since 2014.
One factor pushing emissions upwards last year was electricity demand, up a modest 23TWh (0.7%) in 2017, as the chart below shows.
This is the third year of increases, as economic growth overwhelms the impact of energy efficiency policies. The UK was the only exception, continuing the downward trend that has seen it save the equivalent of 2.5 Hinkley C nuclear plants since 2005.
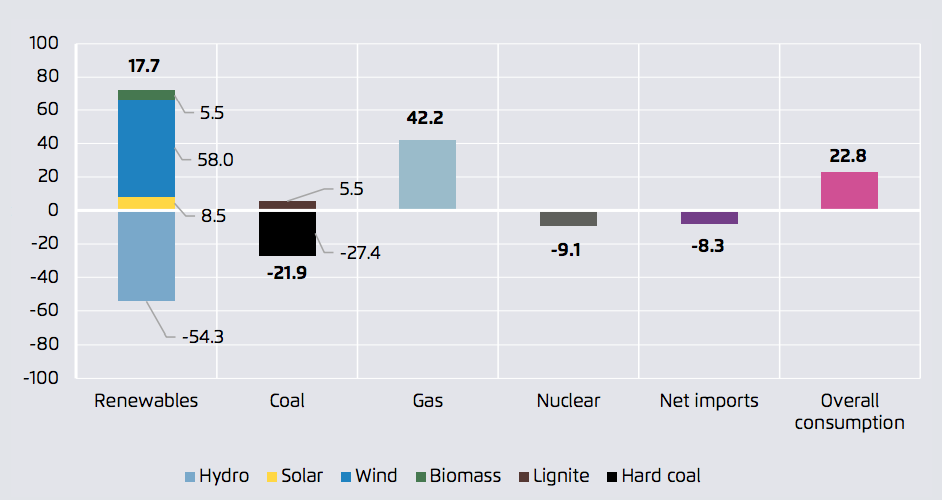
Change in EU electricity generation in 2017, compared to 2016, for each fuel. Source: The European Power Sector in 2017, Sandbag and Agora Energiewende.
Another factor increasing CO2 was that gas use also rose, up 42TWh (7%), while hydro and nuclear both fell. Hydro had a particularly bad year, falling 54TWh (16%). This was predominantly down to a severe drought in southern Europe that saw hydro output halve in Spain and Portugal.
Factors pushing down on CO2 were the continued coal decline and a record year for wind, up 58TWh (19%). Overall, Sandbag and Agora estimates suggest that emissions remained flat at 1,019m tonnes of CO2 in 2017.