In this post I’ll discuss how we’ve reduced energy usage in our home over the years and the benefits of having done so. I’ve already revealed some of what we’ve done in the posts about keeping cool in the summer and keeping warm in the winter. But I haven’t gone into detail about how much energy we used before and after the changes we made, nor about its impact on our finances. I hope that by describing what we’ve done and the benefits it has brought, some of you will be inspired to make changes according to your situation that will reduce your energy usage.
And what are some of the benefits? Well, how about keeping more of your money to yourself and depriving your energy provider of some of it? (Do you like handing over hard-earned cash to your energy provider? I thought not.) Or maybe you would enjoy losing that cold draft around your feet in winter and not getting shocked every time you touch, or even look at, a piece of metal. Yes, these goodies and more await those who embark on a serious energy diet.
Now I have to admit that the subject borders on being dry. (Well, doesn’t just border, but is out in the middle of the desert, dying of thirst.) If we had a cat, I’d liven this post up with the occasional cute cat picture. But we don’t have a cat; we don’t even dress up as one for Halloween. The best I can do is to slip in an occasional soothing plant photo. With that said, on to the post!
First, some details about our house, since size and appliance usage affect how much energy is used, and so you can better compare your situation with ours. The main part of the house, four rooms and a bathroom, was built in 1928; the two room addition, judging from the floor tile and stylistic details, dates from the 1940s or early 1950s. It’s about 1300 square feet all told, one story with a basement underneath the main house and a crawl space underneath the addition. It had an open front porch and a very small back deck when we bought it. Both the main house and the addition are wood frame construction. There was no insulation in any of the walls. In the attic of the main house we found a thin layer of vermiculite insulation, typical for houses of its day. Traces of vermiculite insulation remained in the attic of the addition, but it appeared that most of it had been removed at some time in the past.
When we bought the house, it included a clothes washer and a large copper-colored double-door refrigerator, both of which dated from the 1960s, and an electric range and oven, clothes dryer, and 40 gallon water heater of unknown ages but younger than the washer and refrigerator. In the basement, a circular raised concrete platform and a coal chute informed us that the original furnace had been coal-burning, again typical of houses of its era. The woman we bought the house from told us that she’d replaced a later, oil-burning furnace with a natural gas furnace when oil got expensive, during the one of the 1970s energy crises. She’d also had a central air conditioning unit installed at that time. There was no dishwashing machine.
Because we knew that old refrigerators, clothes washers, furnaces, and air conditioners are less energy efficient than comparable Energy Star rated units, we replaced the refrigerator with a smaller, efficient 15 cubic foot unit and the clothes washer with an efficient front-loading unit before we moved in. During the first summer we lived here, we replaced the furnace and AC with a 96% efficient gas furnace and an AC with a SEER rating of 12. Otherwise we continued with our previous energy conserving habits and made no further changes to conserve energy for a few years.
We knew we needed to have air leaks sealed and insulation added to our house to make a larger dent in our energy usage, and to reduce the discomfort of cold drafts during heating season (if my feet could talk, you would have heard them whining from here to both coasts all winter long). During the summer of 2005 we contracted to have that work done. Coincidentally, the electric hot water heater failed at that time. Knowing gas water heaters are more efficient, we had the electric water heater replaced with a natural gas water heater of the same size.
This is how matters stood for a few more years, until we realized that further reductions in natural gas usage could be obtained through reducing the thermostat setting in the winter. In the fall of 2009, we reduced the thermostat from 65-66F to 55F. That proved to be too cold. By 2012 we settled into keeping the thermostat at 60F during the day, 63F in the evening, and 50F overnight during the heating season, raising it higher only when one or both of us felt ill or we had guests.
In order to further reduce wintertime energy usage and provide a place to overwinter my collection of subtropical plants, we had the existing open front porch converted to a three season room in 2011. Because this long, narrow room faces south, it captures some solar energy on sunny days, when we can use an electric fan to blow some of the warmed air into the house. In 2013, we had the existing storm doors replaced with new, more tightly fitting units. And in 2014, we had a wood stove added so we can burn deadfalls (since we live in an older neighborhood with many large trees, windstorms result in considerable numbers of downed tree limbs that we can harvest for firewood) as well as pruned wood from our own trees.
I think it’s time for the first soothing plant photo, don’t you? Take a moment to enjoy it before continuing on. A soothing beverage of your choice might help too.

OK, back to the topic. In order to see how each of the changes we made affected how much natural gas we used for the year, look at the chart of our yearly natural gas usage for 2003 through 2015, shown below. (Note that the version of Excel that I use does not seem to give me the option to label with just the year. Jan. 04 thus corresponds to 2003, Jan. 05 to 2004, and so on.)
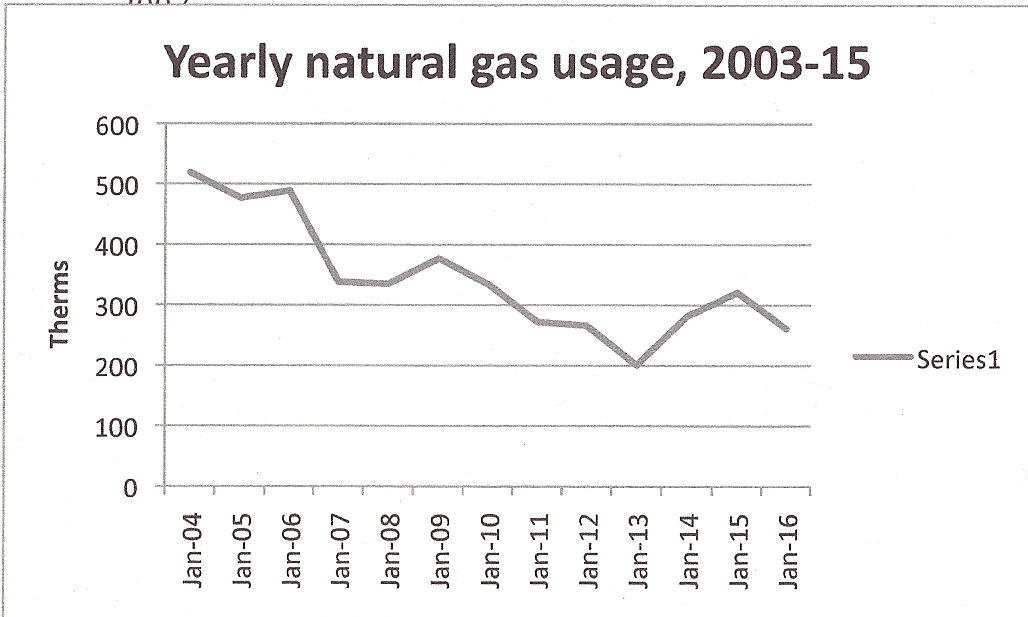
The first thing to note is the large drop in yearly usage in 2006 versus 2005. This is due to sealing air leaks and adding insulation to our house during 2005. Further drops in natural gas usage did not occur till 2009 and later, when we began to reduce the setting on our thermostat during heating season.
Below is a chart of our yearly electrical usage from 2003 through 2015.
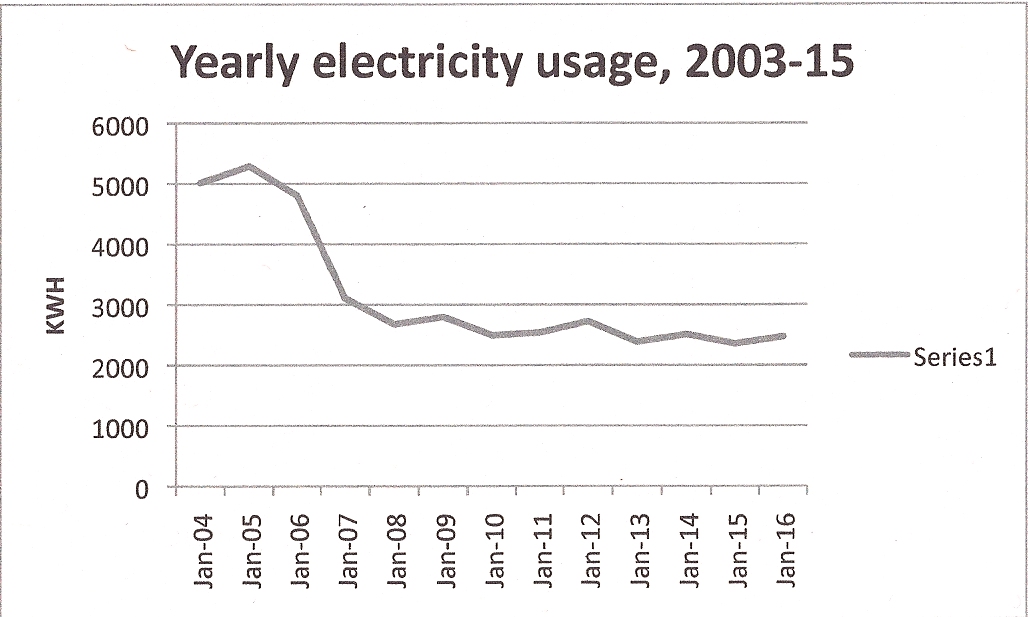
The beneficial effects of air leak sealing, insulation, and the replacement of the electric water heater with a natural gas water heater are evident in the large drop in electricity consumption in 2006 compared to 2005. Another smaller reduction appears to be ongoing from about 2007 through 2015. In this case the reduction is due to a change in the way I grow seedlings. From 2003 through 2006, I grew seedlings for the vegetable garden in the basement, using up to four light fixtures, each with two 48-inch fluorescent tubes, to provide light for the seedlings 16 hours a day. I also put the flats with seeds needing bottom heat to germinate and some heat to grow on a 50 watt electric heat mat, running 24 hours a day. I started seeds as early as February and kept them in the basement until early April, an effect that could be seen in high electricity consumption during February and March.
Around 2007 or 2008, I began to start the cold-tolerant seedlings in a cold frame in March, reducing the number of fluorescent fixtures in use in the basement for raising seeds. After the open front porch was modified into a three-season room in 2011, I stopped raising seedlings in the basement, raising them all in natural light on the front porch. In addition, in the past few years I have not started using the heat mat until the beginning of March, so it only needs to be on for about 2 to 3 weeks, until the seeds needing warm soil germinate. The porch is warm enough by then so they grow well without bottom heat. It’s a good thing I did this, because we have had to run a dehumidifier in the basement during the past several summers due to excessive humidity caused by heavy rains. Our dehumidifier is not Energy Star certified, so we set it to keep the relative humidity in the basement just under 70%. It must add to our electricity consumption (the lowest electricity consumption we’ve had was in 2012, a very dry and hot summer in which we used the dehumidifier very little), but apparently its addition was offset by the reduction in heat mat and grow light usage.
It’s time for another soothing plant photo. Take a deep breath and appreciate the beauty before returning to our discussion.
We’re about to delve into what you’ve all been waiting for: how the changes have affected what we pay for energy services. See the charts below for 2003 through 2015.
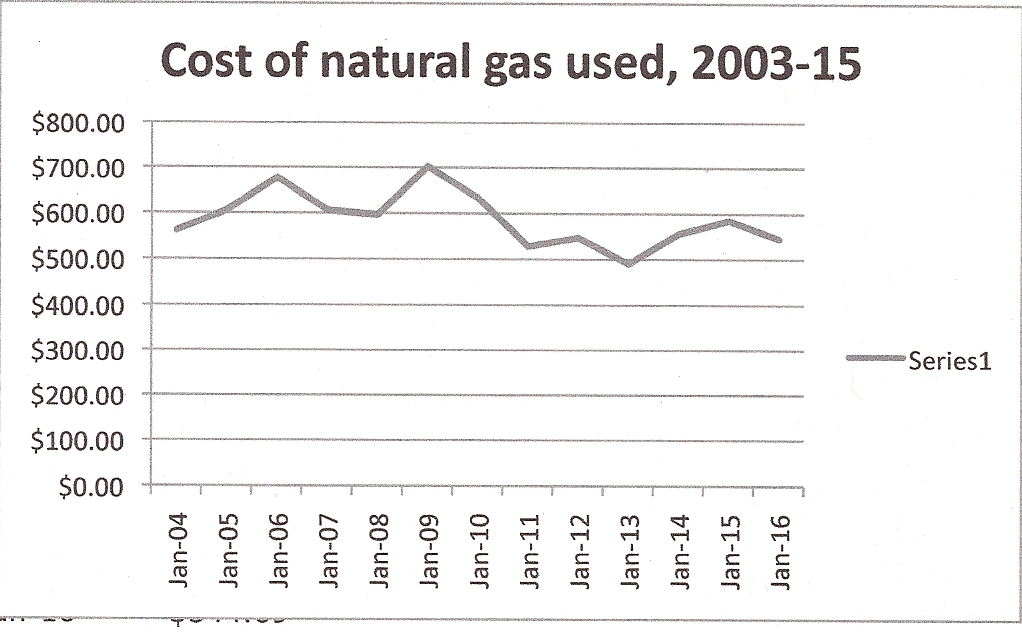
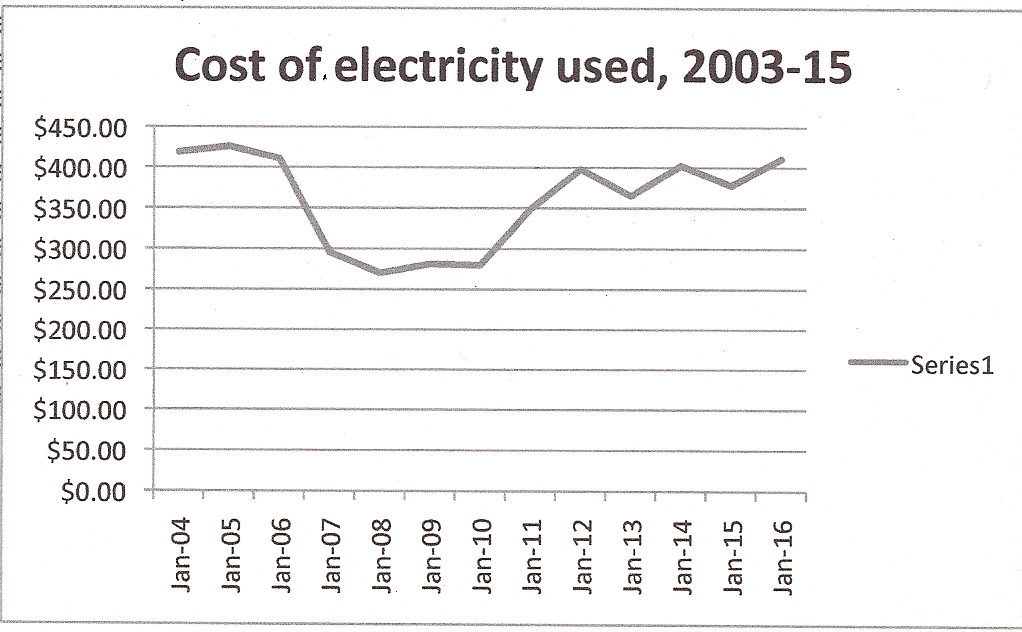
The first thing to notice is how little we pay for electricity and natural gas in a year. It seems to be relatively common for people in this area to pay $100-200/month or more for electricity, especially in the summer. In 2015 we paid $410 for the entire year! Similarly, I’ve heard of people who pay $200-300/month for natural gas to keep their homes heated in winter, while we paid $545 for the whole year in 2015.
However, other factors besides how much energy we use also affect how much we pay for energy, as is clear from a comparison of these two charts with the two charts for yearly energy usage. While the energy usage charts show large drops in our usage in 2015 compared to 2003, what we paid for electricity is about the same in 2015 as it was in 2003 while what we paid for natural gas has dropped only a little. Why is this?
To understand why what we pay for energy services has changed so little in 12 years despite our using only about half as much electricity and natural gas in 2015 compared to 2003, we have to look at the factors that affect the rate (the cost of energy per unit used). To know what affects the rate, we have to look at what goes into producing the electricity and natural gas that we use.
Our electricity provider uses coal-fired plants to generate about 70% of the electricity it produces, so the price it pays for coal must be reflected in the rate it charges us for electricity. Since coal is mined and transported using diesel-powered equipment, the price of oil affects the cost of coal and thus the electric rate we must pay. The price of oil was around $30/barrel in 2003, increasing to around $60/barrel by late 2007. In 2008 it shot up to a peak of $147/barrel, then dropped back to $80-100/barrel through late 2014. This plateau is about two to three times higher than the price before 2008 and is perhaps the largest factor in the higher electric rate in 2015 compared to 2003. Since late 2014, the price of oil has dropped due to excess supply as the oil-producing nations pump it out as fast as they can, but that surplus is likely to be a short-term phenomenon as oil continues to deplete. Assume electricity rates will go up over the years, and you’ll be right a lot more often than not.
In addition, coal itself is becoming more expensive to use for generating electricity because of the various forms of pollution it causes when it’s burned; environmental regulations require that the pollution be reduced with treatment of the exhaust from coal-fired plants, an expense that is passed along to us. If carbon dioxide pollution comes under regulation later on, the cost of using coal will increase further as it produces more carbon dioxide per KWH of electricity generated than do oil or natural gas powered electric plants.
In the case of natural gas, depletion of conventional natural gas wells led to rate increases through about 2009. Around that time, however, fracked natural gas began to take up the slack in supply. Once fracked gas became a significant source, the rate dropped. The cost of oil also affects natural gas because of the use of diesel-powered equipment to produce it, but it appears that the surge in supply from fracking has outpaced effects due to changes in the price of oil. Again, I don’t expect the current low rate situation to hold, because fracked gas depletes very rapidly and the sweet spots in the various fields are already fully exploited or nearly so. Also, if the price of oil shoots up, the price of natural gas must do so as well.
One final effect on how much electricity and natural gas we use is the weather. A warmer summer means more use of air conditioning; a warmer winter means less use of heat. I track CCD (cooling degree days) and HDD (heating degree days) along with energy use so I can attempt to disentangle their influence from that of any changes we make. Our energy providers don’t report this information, so I obtain it from the monthly climate summaries posted on the St. Louis NWS website. I adjust it for the actual dates on which our meters are read, but if you prefer, it’s good enough to use the end-of-month values even if your meter is read on a different day. So now let’s look at charts of the yearly CDD and HDD for St. Louis from 2003 through 2015 and compare them to our energy usage.
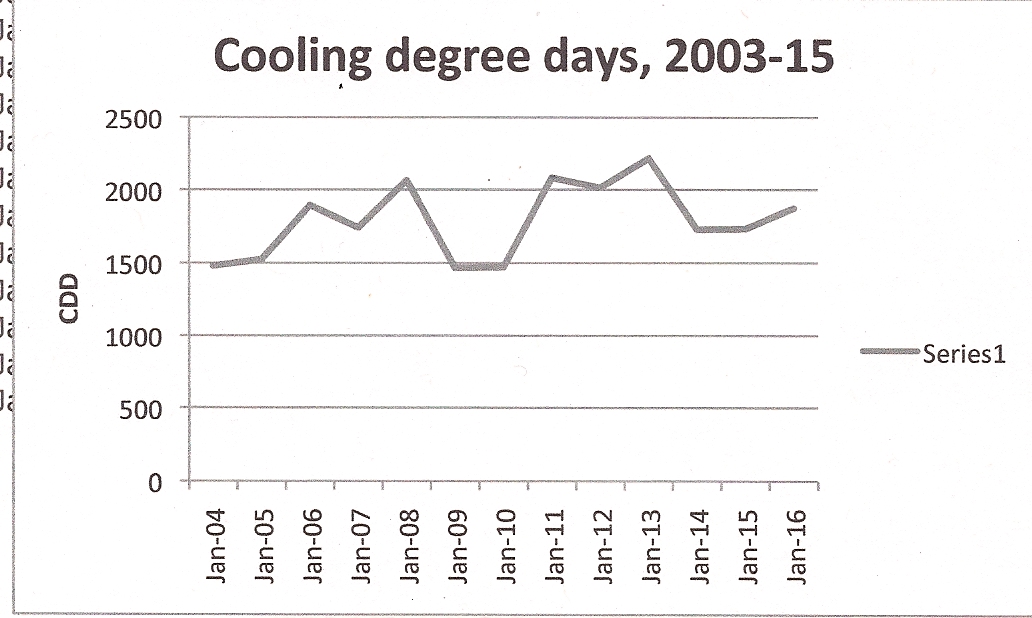
From the yearly CDD chart we could hypothesize that all else being equal, we might have used the least amount of electricity in 2008 or 2009. As noted in the chart of yearly electricity usage, however, 2014 is the year in which we used the least amount of electricity, so our efforts to cut back electricity usage were able to overcome increases in CDD to an extent.
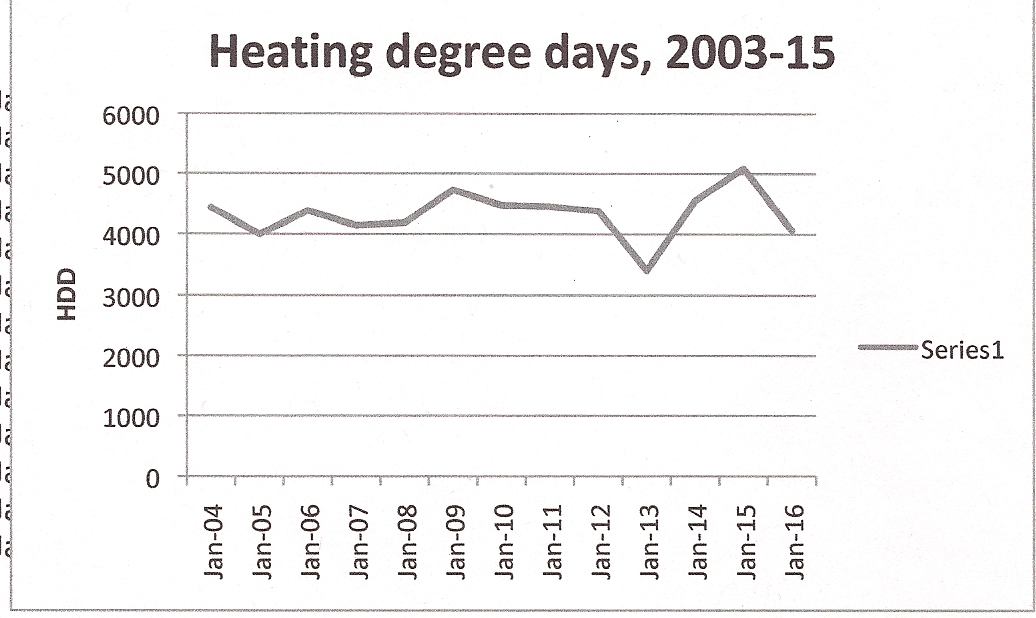
For HDD, 2012 was the warmest year in this range, while 2014 was the coldest. On this basis we might hypothesize that we used the least amount of natural gas in 2012 and the most in 2014, all else being equal. In fact, our yearly natural gas usage was lowest in 2012. It was higher in 2014 than any time since 2009, but it was still considerably less than 2003 through 2008 despite the lower HDDs in all those years. Again, we were able to overcome some of the effects of colder years through our efforts to conserve energy.
Finally, we can compare our usage of natural gas and electricity to that of an average US household, using the values from Sharon Astyk’s Riot 4 Austerity project. At that time (several years ago) the average US household electricity usage was 11,000 KWH per year; the average US household natural gas usage was 1,000 Therms per year. This figure may not be quite the same as current usage, but it will be close enough for our purposes.
Comparing our usages for 2015 (2,471 KWH and 261 Therms), Mike and I used about 22% of the household average usage of electricity and about 26% of the average for natural gas. It isn’t up to Astyk’s Riot target of 10% of average household usage, but still, not too shabby if I do say so myself.
Since we use about 1/4 of the energy of the average US household, the average household (at least in the metro St. Louis area) must pay about 4 times our combined cost of $970 for electric and natural gas service, or about $3900. That’s about $2900 more than we paid for electricity and natural gas in 2015! Now we didn’t actually save this much money from our efforts, because we already used only about half of the electricity and natural gas compared to the average US household in 2003. Based on our actual 2003 usage, our steps to reduce demand and conserve energy saved us about $910 from our utility bills, at 2015 pricing. That’s money we can apply to other needs, or save toward the future. Thus we’ve achieved a triple win: by reducing the amount of these forms of energy that we use, more oil and coal remains for future use, the environment is a little cleaner, and our financial position is better.
If you’d like to join us in achieving this triple win, in the next post I’ll suggest a sensible order (more sensible than ours, anyway) in which to undertake actions intended to reduce your energy usage and cost.