
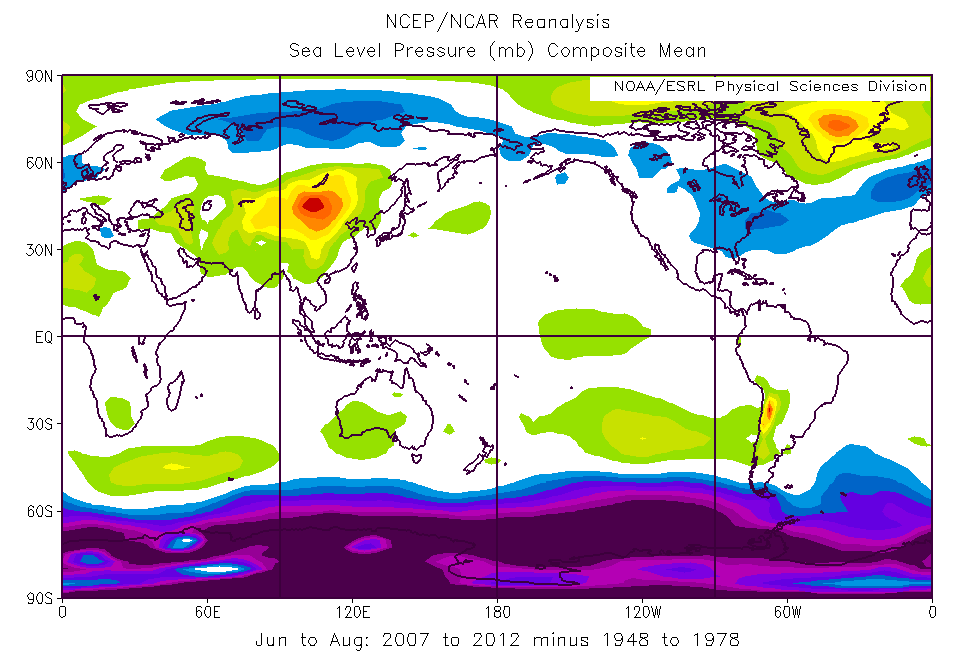
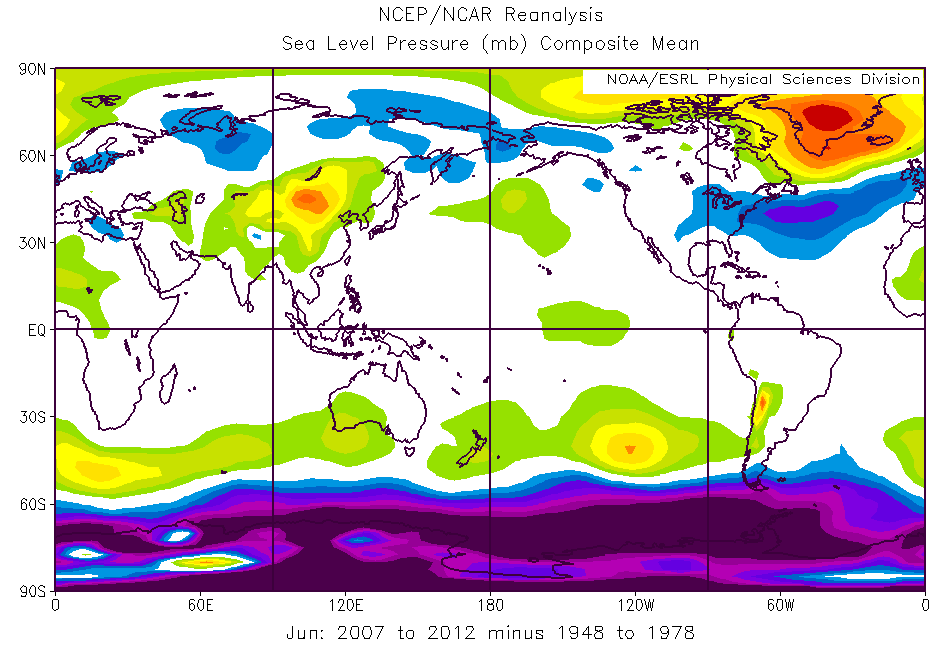
I wanted to cross-check for myself some of the work Chris Reynolds has done looking at changes in weather patterns since 2007 (the beginning of the recent sea ice collapse). Accordingly, I went to this page which allows you to make maps from the NCAR/ESRL weather reanalysis product (which basically uses meteorological weather forecasting models to integrate all available weather observations and then provide a consistent set of weather variables over time and space). I started by producing the difference between summer sea level pressures in 2007-2012 and that in 1948-1978 (the first thirty years available in the dataset). That gave the map above (I wanted to look at the whole globe for context). You can see the pattern that Chris is talking about – the higher pressure over Greenland and the lower pressure in a track around the Arctic – particularly the UK, northern Siberia, and the eastern US and north Atlantic.
However, there is an equally pronounced feature of higher pressure over northern China, and even an even more striking drop in pressure in Antarctica. The first thought was to ask if these are also post 2007 developments or were already occurring? Thus produce the map from 2000-2006 (also Jun-Aug) versus the baseline climatology of 1948-1978:
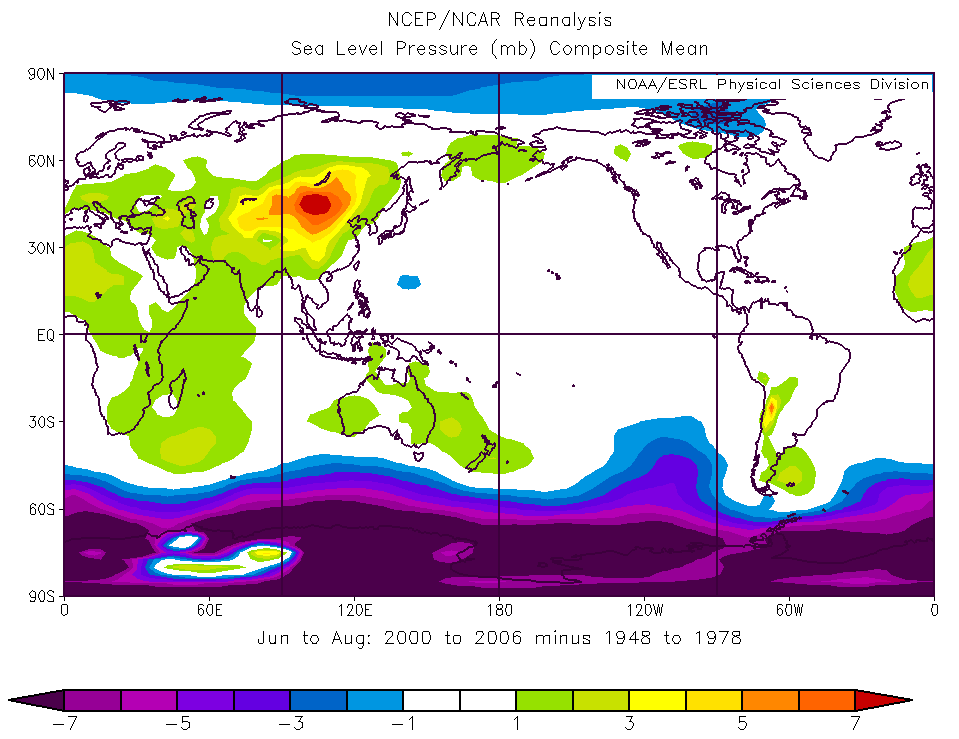
Clearly the higher-pressure in Mongolia and the lower pressure in Antarctica were preexisting (and will not be considered further here – though they are interesting observations for discussion another time).
Next question – is this only a summer phenomenon or also at other seasons? First up, fall (again 2007-2012 versus 1948-1978):
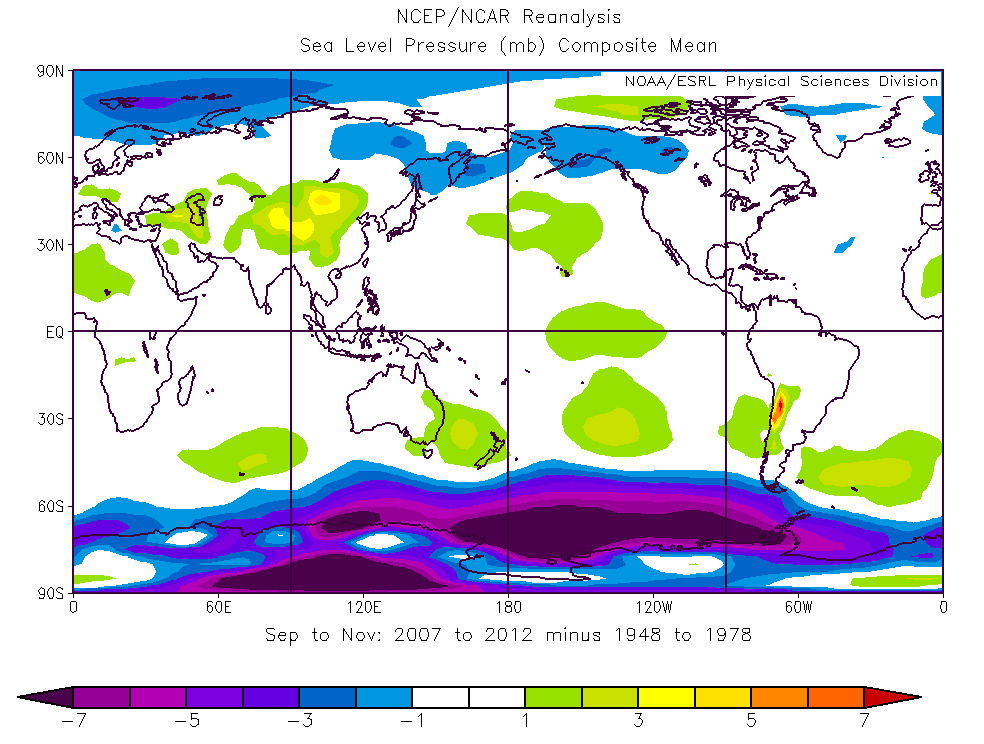
The pattern of higher pressure over Greenland and lower in a track below that is completely absent in fall. This, to me, tends to rule out the idea that this weather pattern is a consequence of the abrupt summer sea ice loss (which peaks in September), and suggests rather that it might be a cause of the recent summer sea ice collapse (though of course it itself is presumably a consequence of a warmer arctic somehow).
Next, spring:

Again, no sign of the new pattern. So it’s only a summer thing. This prompted a look month by month to see how this pattern develops and changes. First, May:
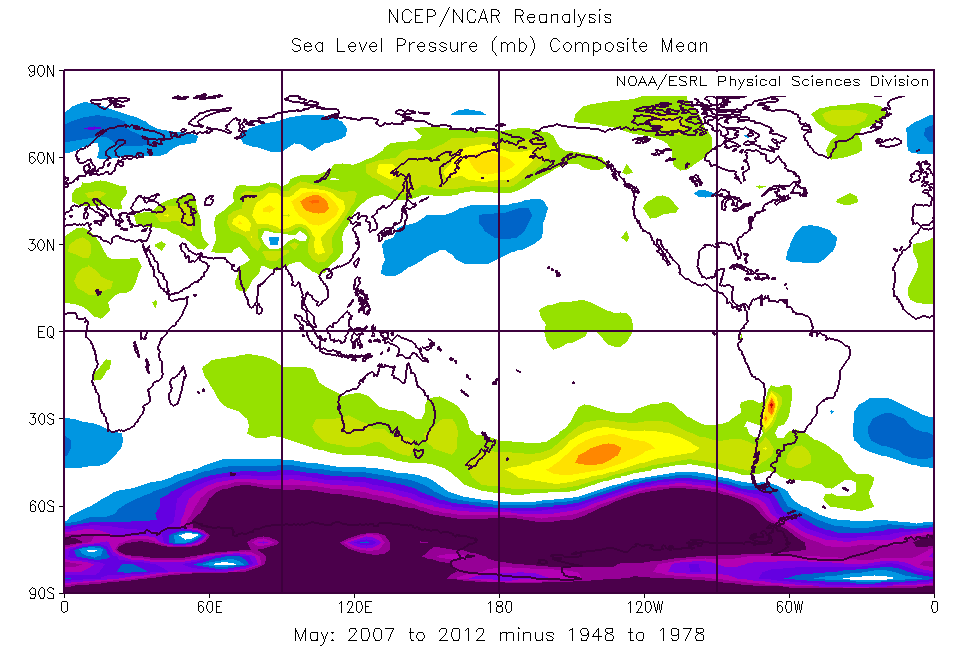
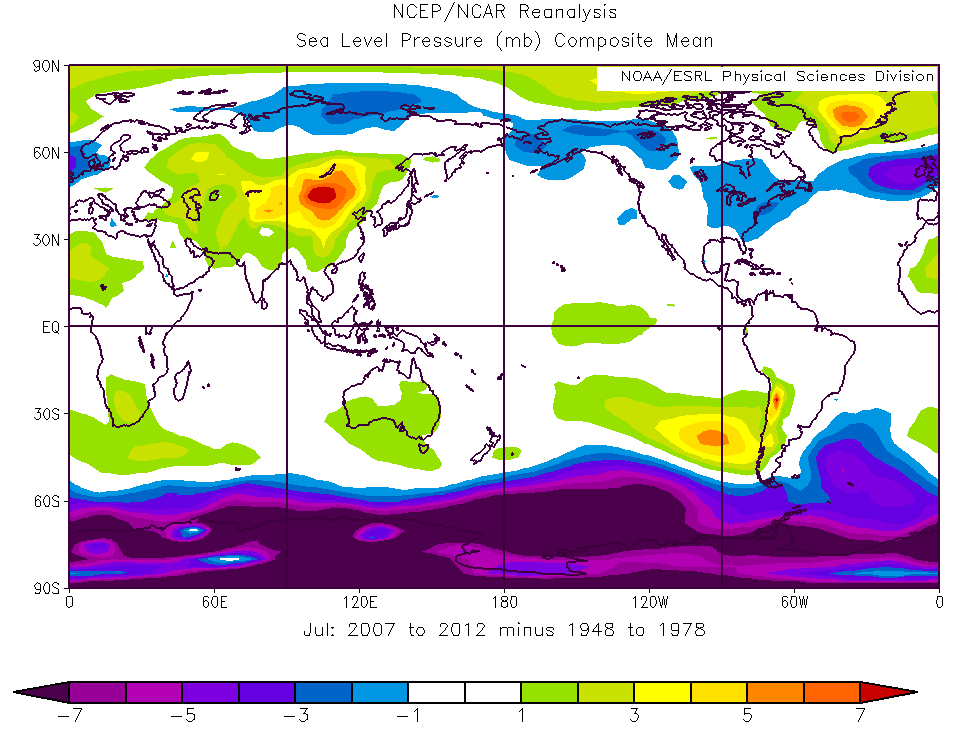
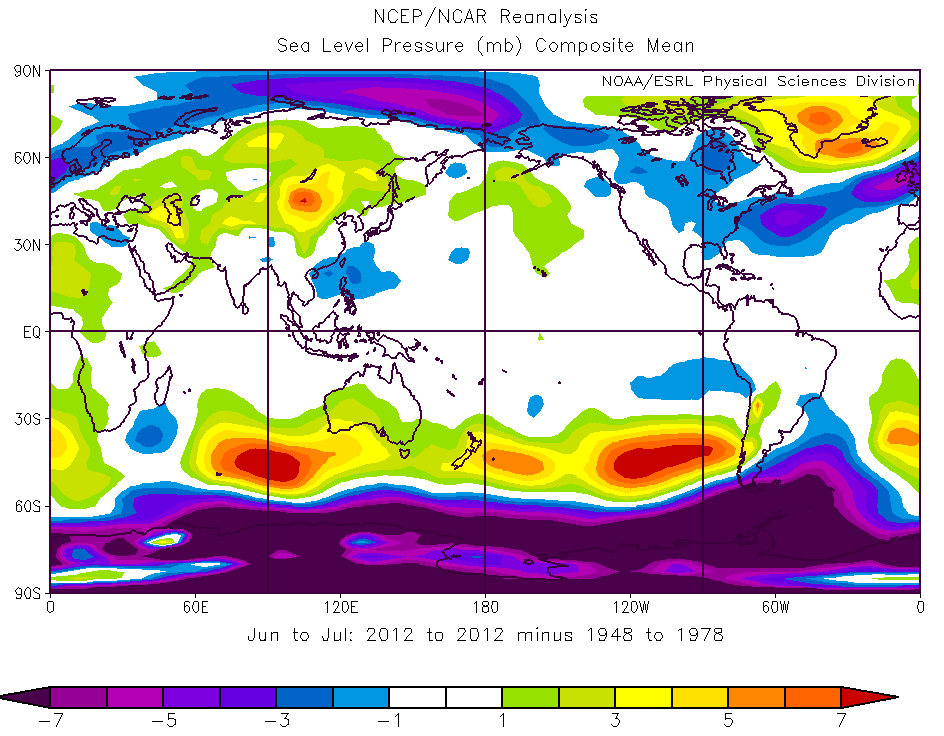
Just a slight hint of higher Greenland pressures in May. Then June:
Ah – pattern fully clear in June. July:
Pattern a little weaker in July but still fully evident. Now August:
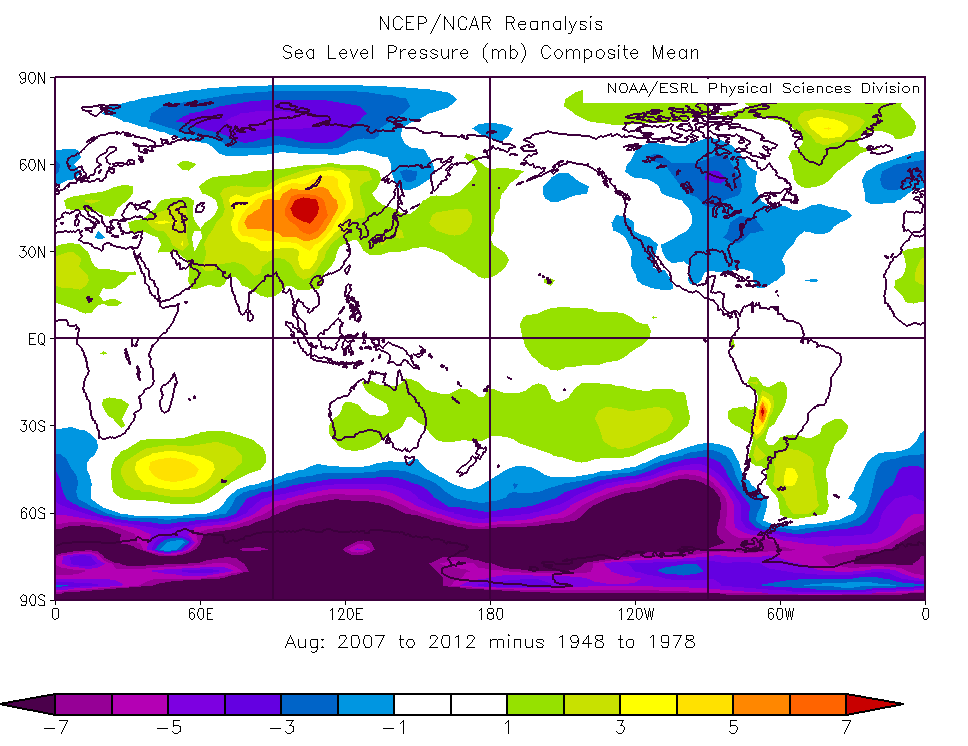
Pattern still visible but breaking up by August. And September:
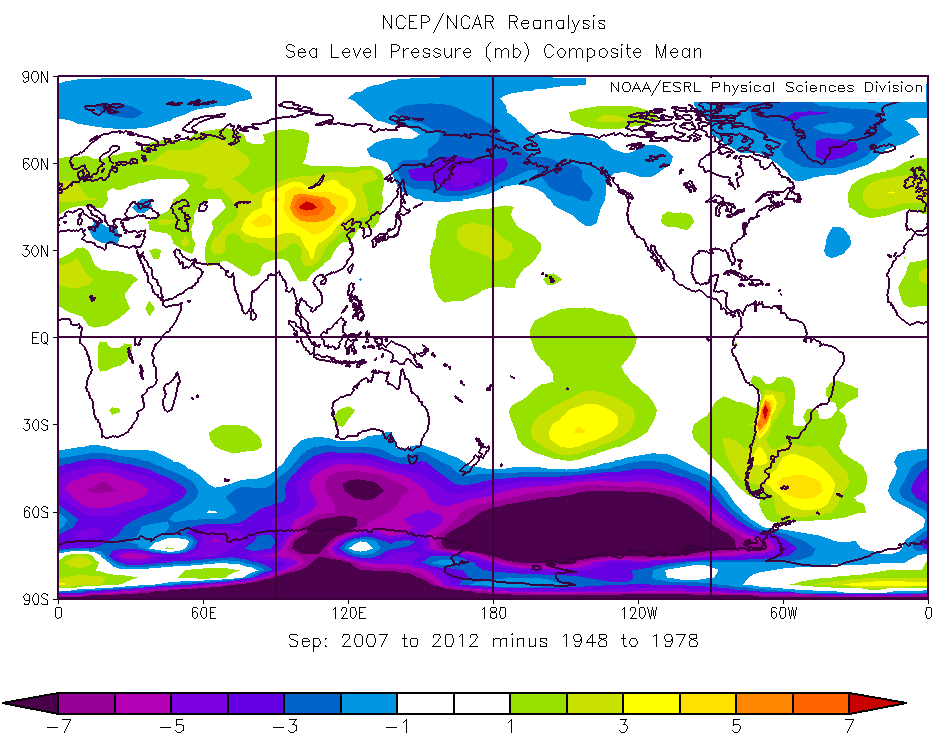
Completely gone by September. So what we are talking about is an early summer pattern – starting in late May, peaking in June/July, and then fading in August. Finally, here are the individual years since 2006 for comparison with the overall pattern (all done as June/July averages versus 1948-1978).
2006, the last year with a “still on the linear trend” Arctic:

Note the pattern is completely missing (with the possible exception of a very small spot on Greenland).
Then 2007, the first year of the big collapse:
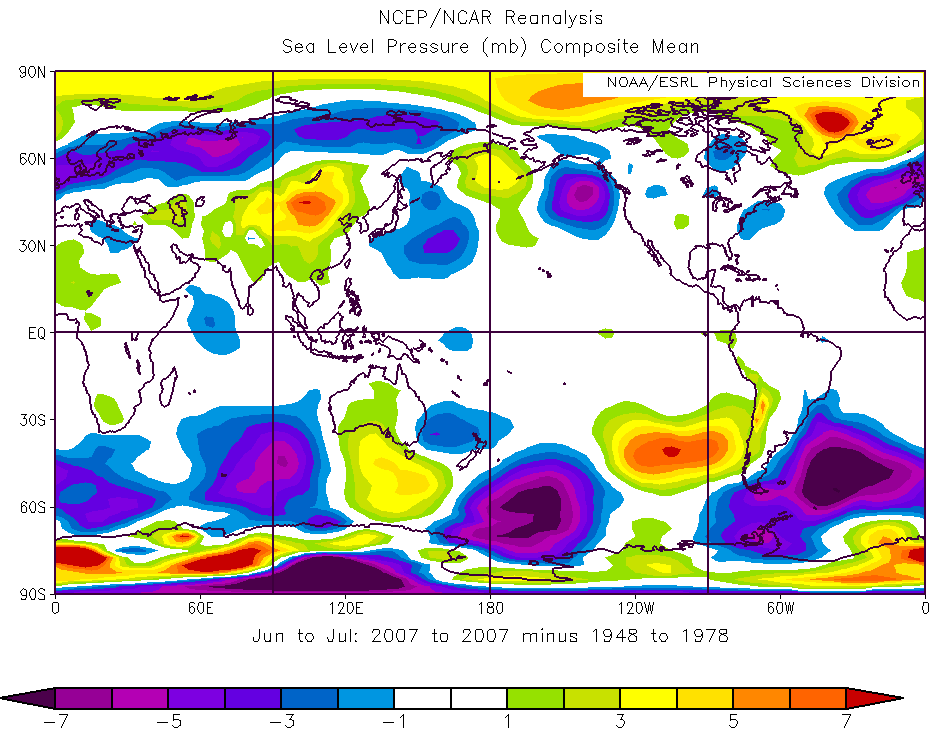
In that year, the UK and northern Russia got the biggest pressure drops.
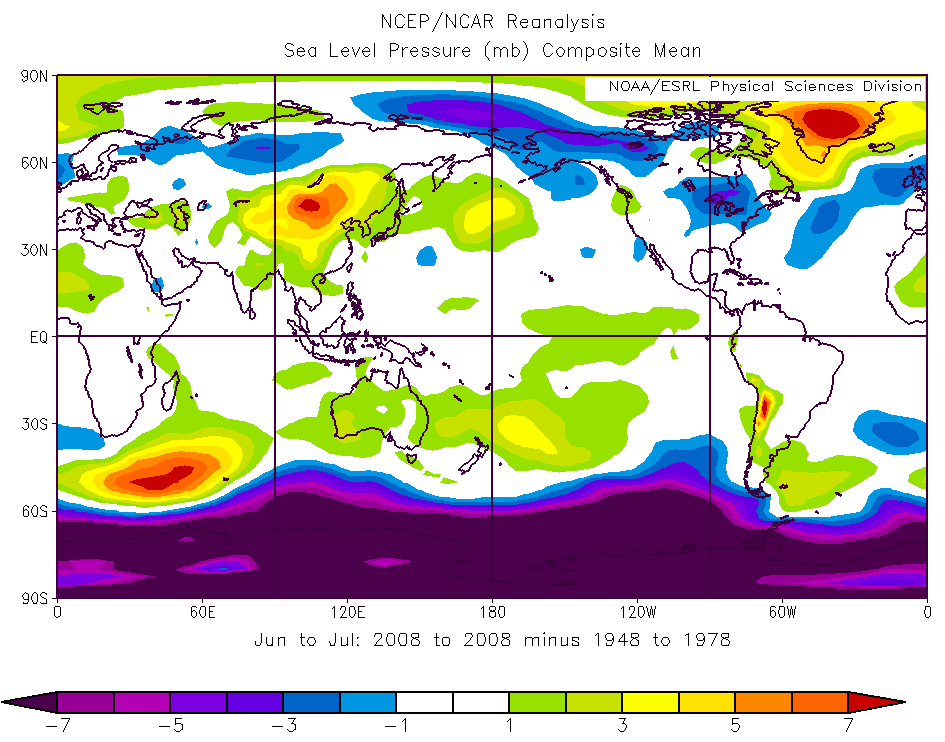
2008:
2009 – the whole Arctic has very high pressure:

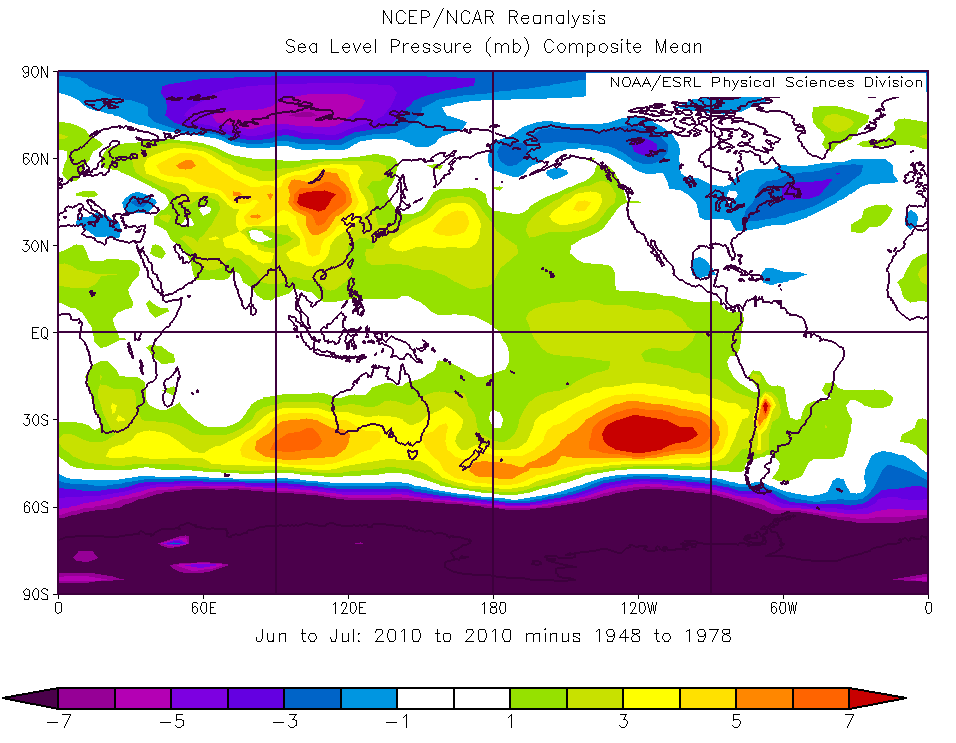
2010 – the high over Greenland is less pronounced, but the track of lower pressure across northern Russia, Alaska, and the eastern US is still visible:
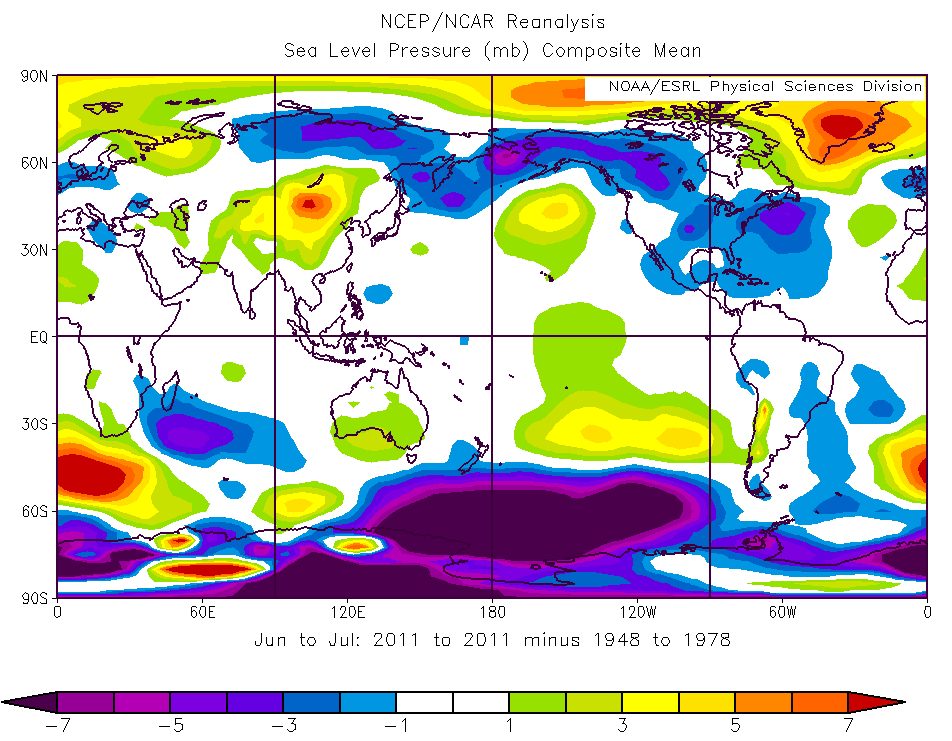
Then 2011 – pattern very clear again (note that this was a year in which the northern US was very wet and the southern US had a big drought):
Finally 2012, in which the UK had the worst summer in a hundred years and the US had a severe drought:
So, it does rather look like an abrupt shift in the early summer northern hemisphere circulation has occurred since 2007 and is having multiple effects – poor summers in the UK, melting sea ice – and presumably accelerated warming of the Greenland ice sheet also.
The obvious questions are: why? and will it continue?