
As many people now know, 50 years ago this March M. King Hubbert predicted that US Lower 48 and Texas oil production would peak, and enter a terminal decline, somewhere between 1966 and 1971. Dr. Hubbert also predicted that world oil production would peak, and enter a terminal decline within 50 years, i.e., by 2006. To be clear, despite what is either a profound misunderstanding of or a misrepresentation of Dr. Hubber’ts work in some quarters, Dr. Hubbert was not predicting the end of world oil production by 2006; he was predicting that production peaks when producing regions have consumed about half of their recoverable conventional oil reserves.
In our previous article, “M. King Hubbert’s Lower 48 Prediction Revisited,” we outlined a simplified way of predicting what Kenneth Deffeyes designated as Qt, or total recoverable conventional oil production for a region. The method has been designated Hubbert Linearization, or HL, by Stuart Staniford, with The Oil Drum blog.
Using the HL technique, the purpose of this paper is to use historical Texas and Lower 48 oil production as a model for future oil production in Saudi Arabia and the world. Figures One and Two show HL plots for Texas the Lower 48. Texas peaked at 56.5% of Qt. The Lower 48 peaked at 51.9% of Qt.
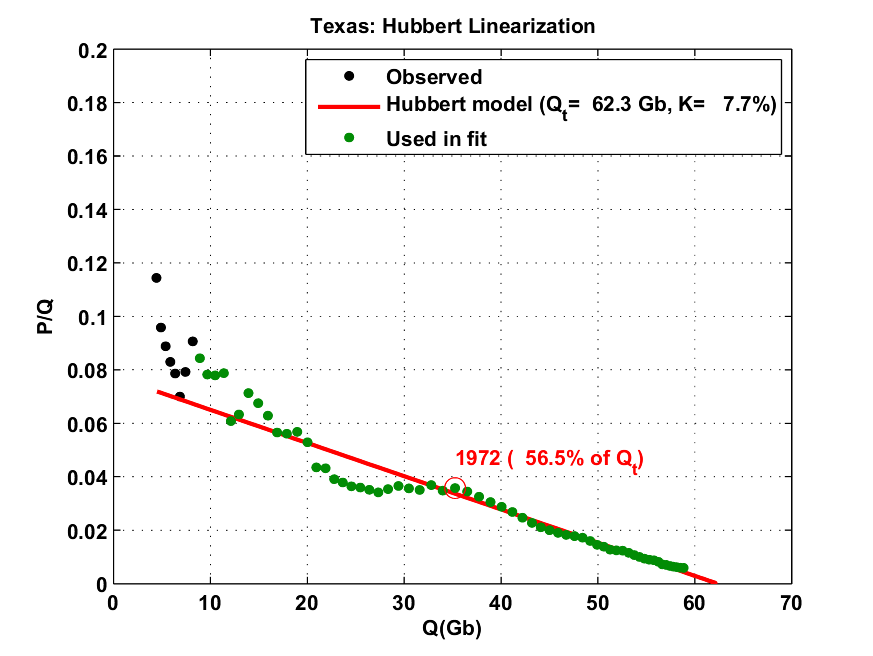 Fig 1. Hubbert linearization applied on the Texas oil production.
 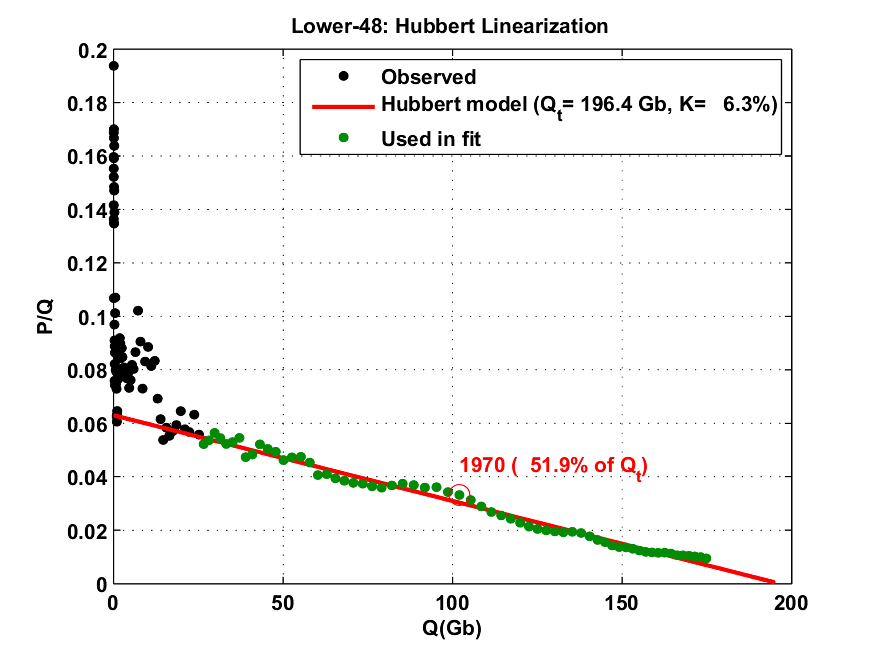 Fig 2. Hubbert linearization applied on the Lower-48 oil production
Note that prior to its peak, Texas was the “swing producer,” i.e., its production was regulated by the Texas Railroad Commission in order to keep oil prices within a certain range. Perhaps because of its swing producer role, Texas peaked later than the Lower 48, relative to their respective Qt’s. However, Texas oil production, now down about 75% from its peak, has fallen much more sharply than has the Lower 48 overall, now down about 50% from its peak.
Saudi Arabia succeeded Texas as the swing producer, at least until recently. The emerging “swing producer” is the release of petroleum from emergency reserves. The problem of course will be replenishing the emergency reserves.
Figures Three and Four show HL plots for Saudi Arabia, now at 58.1% of Qt, and the world, now at 48.2% of Qt. In other words, Saudi Arabia and the world are now approximately where Texas the Lower 48 were at in 1972 and 1970 respectively.
 Fig 3. Hubbert linearization applied on the Saudi Arabia oil production
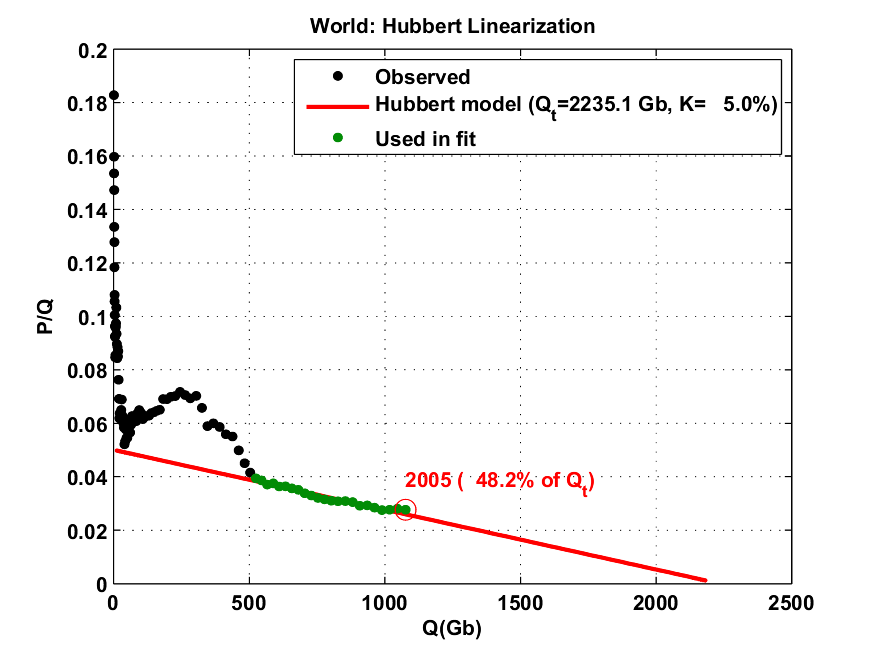
Fig 4. Hubbert linearization applied on the world oil production
Figure Five shows superimposed production graphs for Texas and the Saudi Arabia, with Texas production in 1972 lined up with Saudi Arabia production in 2005. Note the difference in the vertical scales.
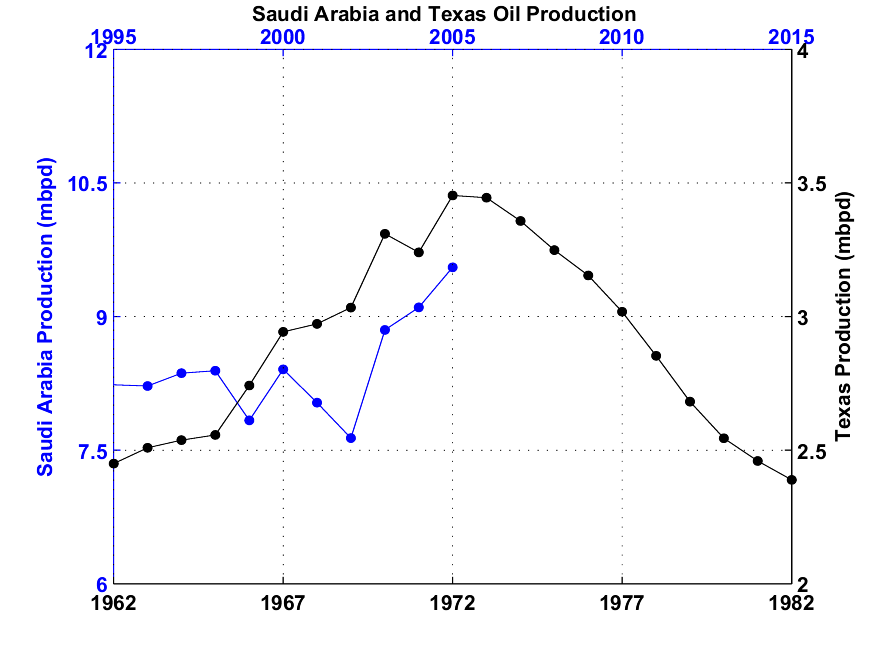 Fig 5. Saudi-Arabia and Texas oil production (in million of barrels per day)
Figure Six shows superimposed production graphs for the Lower 48 and the world, with Lower 48 production in 1970 lined up with world production in 2005. Again, note the difference in vertical scales.
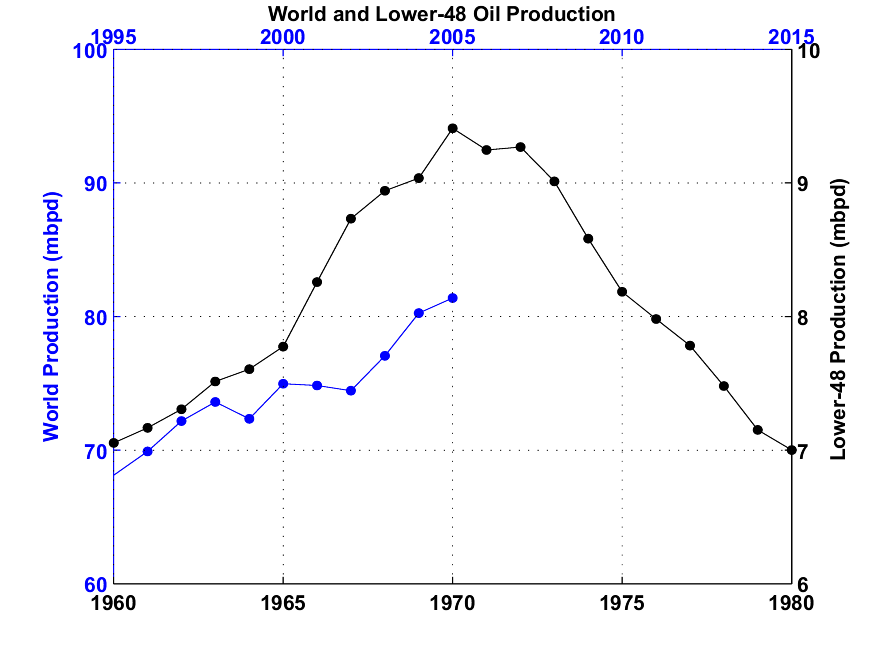 Fig 6. World and Lower-48 oil production (in million of barrels per day)
 Note that both Russia and the North Sea also peaked in the vicinity of 50% of Qt. Russia is a complex case, because of the post-Soviet collapse in production, but the post-1984 cumulative production falls within the predicted HL limits. North Sea production has been falling steadily since peaking in 1999 at 52% of Qt. Notably, the top 10 major oil companies working the North Sea in the late Nineties, using the best data, best engineers and best technology available, were predicting that North Sea production would not peak until 2010 at the earliest. Many of these same companies are now saying the world peak oil production is decades away.
In summary, based on the HL method and based on our historical models, we believe that Saudi Arabia and the world are now on the verge of irreversible declines in conventional oil production. While there will be massive efforts directed toward unconventional sources of oil, we predict that unconventional sources of oil will only serve to slow and not reverse the decline in total world oil production.
As we stated in our previous article, in order to speed the adjustment to the realities of declining world oil production, we recommend that the United States abolish the Payroll (Social Security + Medicare) Tax and replace it with either a liquid transportation (petroleum) fuel tax or an overall (nonrenewable) energy tax. In effect we would tax energy consumption to fund Social Security and Medicare. The primary reason for implementing the proposal is that it would cause an immediate and massive across the board push for greater energy efficiency and it would unleash enormous free market forces against profligate energy use. This proposal would also find favor with those concerned about Global Warming.
Data sources:
- BP
- Statistical Review of World Energy 2005
- EIA
- RRC:History of Texas Crude Oil, Annual Production, and Producing Wells
Jeffrey J. Brown is an independent petroleum geologist in Addison, Texas.
E-mail: [email protected]
Khebab has a Masters Degree in Physics and a Ph.D. in signal processing. He is currently a researcher in a computer vision lab in Quebec, Canada, with ten years experience in R&D.


