


[ Mexico’s Cantarell field, the second highest oil-producing field in the world, has begun a premature decline, signaling an imminent peak of overall Mexican oil production. Khebab of GraphOilogy here demonstrates, with a quite technical analysis, what this will likely mean for oil exports from a country with a growing population and appetite for oil. -AF ]
Mexico is the second largest source of crude imports for the US with 1.55 mbpd in 2005 [5]. I tried to compile different URR (Ultimate Recoverable Ressource) estimates from various sources:
| Source | Reserves | Year | Cumulative | YTF | Ultimate |
|---|---|---|---|---|---|
| BP Statistical Review | 14.803 | Year-End 2004 | 33.9 | 5.975 | 54.67 |
| Oil & Gas Journal | 12.882 | January 1, 2006 | 35.8 | 5.975 | 54.67 |
| World Oil | 14.803 | Year-End 2004 | 33.9 | 5.975 | 54.67 |
| IHS | 30 | Year-End 2002 | 27 | 14 | 71-99 |
| USGS | 25.1 | Year-End 1996 | 23.6 | 18.603 | 54.7-88.9 |
| ASPO | 28.6 | 2002 | 23 | 4.2 | 50 |
volumes are in Giga-barrels (Gb)
 Fig 1. Oil production of Mexico (src: ASPO)
From the table above, we can design a simple triangular probability density function for the URR where the maximum of probability corresponds to the median value.
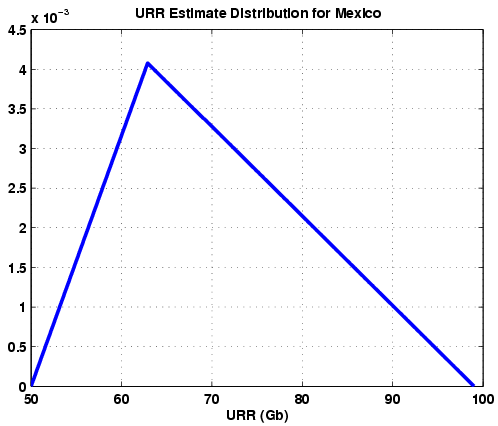 Fig 2. URR probability distribution function derived from the table above.
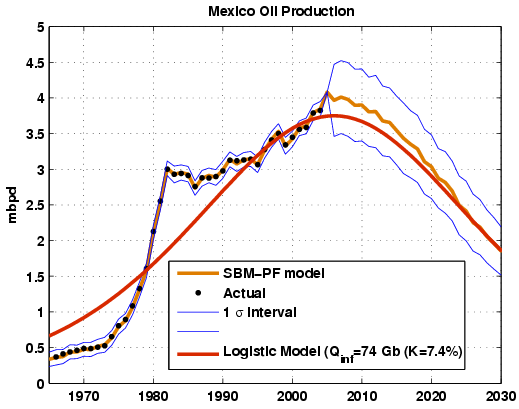 Fig 3. Future production based on the SBM-PF method and the Hubbert Linearization technique (see Figure 4). Both methods give an URR around 72 Gb. Production is peaking in 2005-2006.
 Fig 4. Same as Figure 3 but using a P/Q versus Q representation.
The domestic oil consumption has grown rapidly but is showing signs of a slow down since 2000 (see Figure 5). Note also that retail prices for Diesel and super-gasoline have increased since 2000 (see Figure 6).
 Fig 5. Mexico’s oil consumption (millions of barrels per day, src: BP)
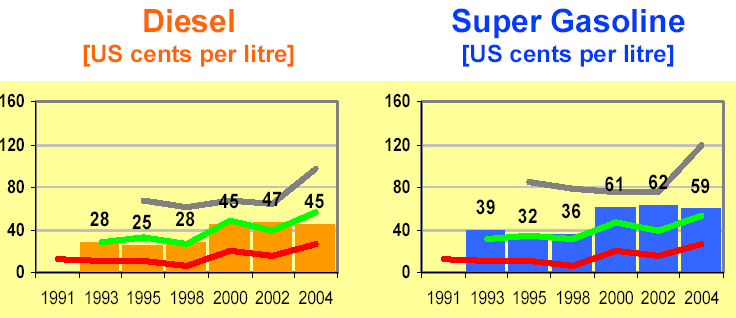 Fig 6. Green Benchmark Line = Retail Fuel Prices in the UNITED STATES. Red Benchmark Line = CRUDE OIL Prices on World Market (“Brent” at Rotterdam)[3]
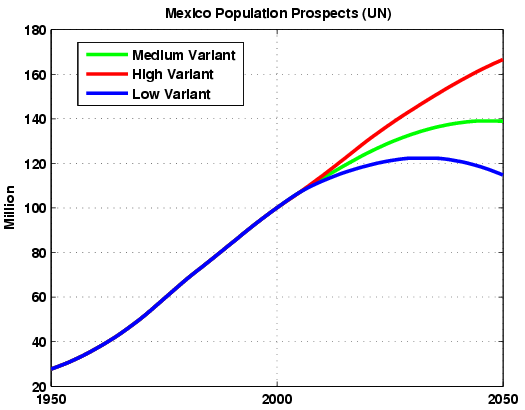 Fig 7. Mexico population trend (src: UN)
 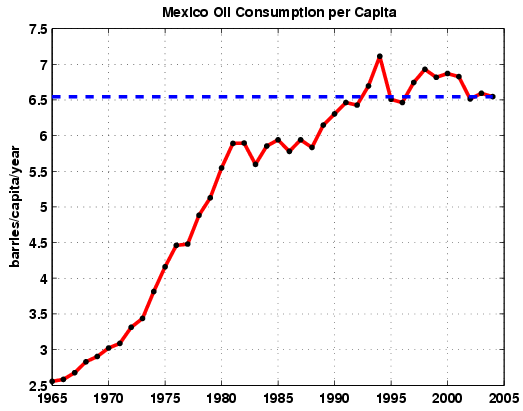 Fig 8. Number of barrels consumed per capita per year.
 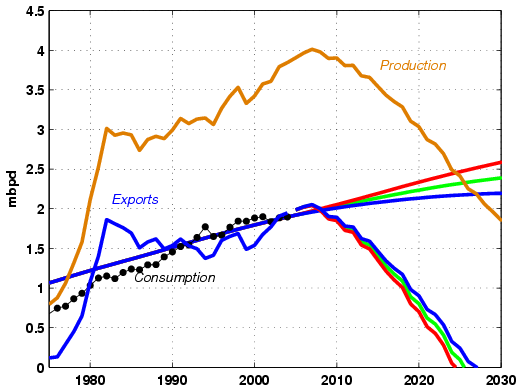 Fig 9. Projected oil consumption based on the population growth and a constant consumption per capita per year (6.5 barrels/capita/year).
  Fig 10. Projected share of the oil exports for the different population scenario. The export share will reach a maximum between 2006 and 2007.
References:
[1] PRB Country Profiles: Mexico
[2] Population Division of the Department of Economic and Social Affairs of the United Nations Secretariat, World Population Prospects: The 2004 Revision and World Urbanization Prospects: The 2003 Revision
[3] www.internationalfuelprices.com
[4] NIGC – Country Analysis Briefs: North America: Mexico [eia.doe.org]
[5] Crude Oil and Total Petroleum Imports Top 15 Countries



Comments
Welcome to the new Resillience commenting system!
We have moved from the former Disqus commenting system to a new system as of September 10, 2026.
We made this change because of privacy concerns regarding Disqus. It's also part of a set of changes to bring more services to the Resilience community under a single login: commenting, (coming September 2026), and online courses (coming 2027). Unfortunately, your old Disqus comments may not reliably link to your account in this new system. Please contact us if you have any questions or concerns.