
 "It would be some consolation for the feebleness of our selves and our works if all things should perish as slowly as they come into being; but as it is, increases are of sluggish growth, but the way to ruin is rapid." Lucius Anneaus Seneca, Letters to Lucilius, n. 91.
This observation by Seneca seems to be valid for many modern cases, including the production of a nonrenewable resource such as crude oil. Are we on the edge of the "Seneca cliff?"
It is a well known tenet of people working in system dynamics that there exist plenty of cases of solutions worsening the problem. Often, people appear to be perfectly able to understand what the problem is, but, just as often, they tend to act on it in the wrong way. It is a concept also expressed as "pushing the lever in the wrong direction."
With fossil fuels, we all understand that we have a depletion problem, but the solution, so far, has been to drill more, to drill deeper, and to keep drilling. Squeezing out some fuel by all possible sources, no matter how difficult and expensive, could offset the decline of conventional fields and keep production growing for the past few years. But is it a real solution? That is, won’t we pay the present growth with a faster decline in the future?
This question can be described in terms of the "Seneca Cliff", a concept that I proposed a few years ago to describe how the production of a non renewable resource may show a rapid decline after passing its production peak. A behavior that can be shown graphically as follows:
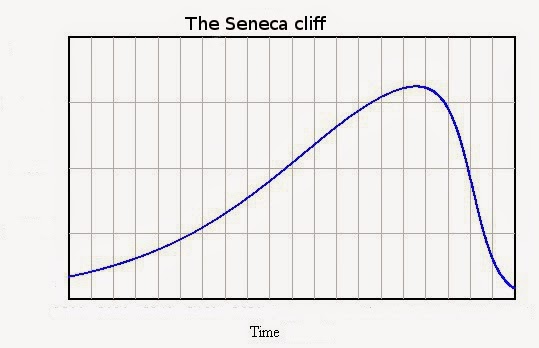
It is not just a theoretical model: there are several historical cases where the production of a resource collapsed after having reached a peak. For instance, here are the data for the Caspian sturgeon, a case that I termed "peak caviar".
Do we risk to see something like this in the case of the world production of oil and gas? In my opinion, yes. There are some similarities; both fossil fuels and caviar are non-replaceable resources; and in both cases prices went rapidly up at and after the peak. So, if Caspian sturgeon showed such a clear Seneca cliff, oil and gas could do the same. But let me go into some details.
In the first version of my Seneca model, the fast decline of production was interpreted in terms of growing pollution that places an extra burden on the productive system and reduces the amount of resources available for the development of new resources. However, I found that the Seneca behavior is rather robust in these systems and it appears every time people try to "stretch out" a system to force it to produce more and faster than it would naturally do.
So, in the case of the Caspian sturgeon, above, growing pollution is unlikely to be the cause of the rapid collapse of production (even though it may have contributed to the problem). Rather, the main factor in the collapse is likely to have been the effect of the growing prices of a rare and non replaceable resource (caviar). High prices enticed producers to invest more and more resources in raking out of the sea as much fish as possible. It worked, for a while, but, in the end, you can’t fish sturgeon which isn’t there. It ended up in disaster: a classic case of a Seneca Cliff.
Can this phenomenon be modeled? Yes. Below, I describe the model for this case in some detail. The essence of the idea is that producers need to reinvest a fraction of their profits in developing new resources in order to keep producing. However, the yield of the new investments declines as time goes by because the most profitable resources (e.g. oil fields) are exploited first. As a result, less and less capital is available for new investments. Eventually production reaches a maximum, then it declines. If we assume that companies re-invest a constant fraction of their profits in new resources, the model leads to the symmetric bell shaped curve known as the "Hubbert Curve."
However, as I describe in detail below, decline can be postponed if high prices provide extra capital for new productive developments. Unfortunately, growth is obtained at the cost of a fast burning out of capital resources. The final result is not any more the symmetric Hubbert curve, but a classic Seneca curve: decline is more rapid than growth.
Is this what we are facing for fossil fuels? Of course, we are only dealing with qualitative models, but, on the other hand, qualitative models are often robust and give us an idea of what to expect, even though they can’t tell us much in terms of predicting events on a precise time scale. The ongoing collapse of oil prices may be a symptom that we are running out of the capital resources necessary to keep developing new fields. So, what we can say is that there are some good chances of rough times ahead – actually very rough. The Seneca cliff may well be part of our near term future.
_______________________________________________________
The Seneca curve as the result of increasing fractions of profits allocated to the production of a non renewable resourceby Ugo Bardi – 07 Dec 2014
Note: this is not a formal scientific paper; it is more a rough "back of the envelope" calculation designed to show how increasing capex fractions can affect the production rate of a non renewable resource. If someone could give me a hand to make a more refined and publishable study, I would be happy to collaborate!
The basics of a system dynamics model describing the exploitation of a non renewable resource in a free market are described in detail in a 2009 paper by Bardi and Lavacchi. According to the model developed in that paper, it is assumed that the non renewable resource (R) exists in the form of an initial stock of fixed extent. The resource stock is gradually transformed into a stock of capital (C) which in turn gradually declines. The behavior of the two stocks as a function of time is described by two coupled differential equations.
R’ = – k1*C*R
C’ = k2*C*R – k3*C,where R‘ and C’ indicate the flow of the stocks as a function of time (R’ is what we call "production"), while the "ks" are constants. This is a "bare bones" model which nevertheless can reproduce the "bell shaped" Hubbert curve and fit some historical cases. Adding a third stock (pollution) to the system, generates the "Seneca Curve", that is a skewed forward production curve, with decline faster than growth.
The two stock system (i.e. without taking pollution into account) can also produce a Seneca curve if the equations above are slightly modified. In particular, we can write:
R’ = – k1*k3*C*R
C’ = ko*k2*C*R – (k3+k4)*C.Here, "k3" explicitly indicates the fraction of capital reinvested in production, while k4 which is proportional to capital depreciation (or any other non productive use). Then, we assume that production is proportional to the amount of capital invested, that is to k3*C. Note how the ratio of R’ to the flow of capital into resource creation describes the net energy production (EROI), which turns out to be equal to k1*R. Note also that "ko" is a factor that defines the efficiency of the transformation of resources into capital; it can be seen as related to technological efficiency. These points will not be examined in detail here.
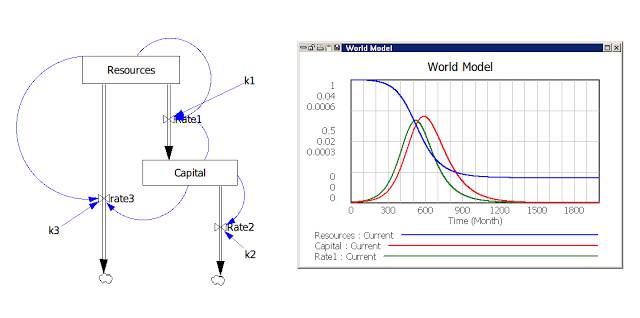
Here is the model as implemented using the Vensim (TM) software for system dynamics. The "ks" have been given explicit names. I am also using the convention of "mind sized models" with higher free energy stocks appearing above lower free energy stocks
If the k‘s are kept constant over the production cycle, the shape of the curves generated by this model is exactly the same as with the simplified version, that is a symmetric, bell shaped production curve. Here are the results of a typical run:
Things change if we allow "k3" to vary over the simulation cycle. The characteristic that makes "k3" (productive investment fraction) somewhat different than the other parameters of the model, is that it is wholly dependent on human choice. That is, while the other ks are constrained by physical and technological factors, the fraction of the available capital re-invested into production can be chosen almost at will (of course, there remains the limit of the total amount of available capital!).
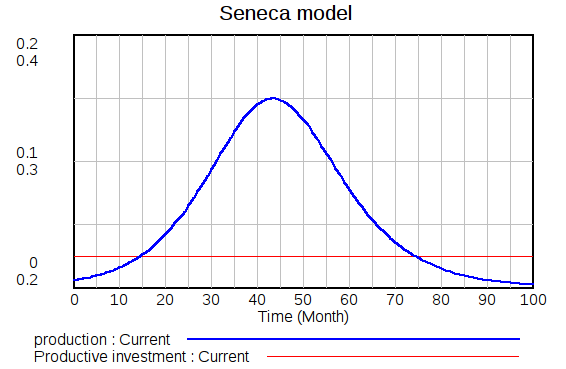
Higher prices will lead to higher profits for producers and to the tendency to increase the fraction reinvested in new developments. It is also known that in the region near the production peak prices tend to be higher – as in the historical cases of whale oil and caviar and whale oil. In the case of caviar, the price rise was nearly exponential, in the case of whale oil, more like a logistic curve. Assuming that the fraction of reinvested capital varies in proportion to prices, some modeling may be attempted. Let me show here the results obtained for an exponential increase of the fraction of reinvested Capex.
I have also tried other functions for the rising trend of k3. The results are qualitatively the same for a linear increase and for a logistic one: the Seneca behavior appears to be robust, as long as we assume a significant increase of the fraction of the reinvested capex.
Let me stress once more that these are not supposed to be complete results. These are just tests performed with arbitrary assumptions for the constants. Nevertheless, these calculations show that the Seneca cliff is a general behavior that occurs when producers stretch out their system allocating increasing fractions of capital to production.


