
There is a horrible paper in this week’s Proceedings of the National Academy of Sciences (hat-tip Desdemona Despair), which looks at how the limits of human physiology interact with upper-range global warming scenarios. The bottom line conclusion is that there is a small – of order 5% – risk of global warming creating a situation in which a large fraction of the planet was uninhabitable (in the sense that if you were outside for an extended period during the hottest days of the year, even in the shade with wet clothing, you would die). To give you a feeling for the likely uninhabitable regions, it’s the portions of the map above that are in the white or pink/purple color (above 35oC wet bulb temperature on the scale). As you can see, it includes most of the eastern US, much of inland Brazil and Latin America, tropical Africa, pretty much all of India, portions of northern China, and most of Australia. Plenty to qualify as a “Risk to Global Civilization”, I think.
The paper itself will cost you $10 to read, unless you are already a PNAS subscriber, so let me try to summarize the main reasoning and you can decide if it’s worth your $10.
The first thing we need to understand is this concept of wet bulb temperature. The basic idea is that you take a regular mercury-in-glass type thermometer, cover the bulb in wet gauze, run a fan on it, and measure the resulting temperature. Because evaporation cools things (the reason we sweat when we are hot) this temperature will tend to be lower than the normal dry bulb temperature. How much lower depends on the humidity of the air – in dry places (eg deserts) evaporative cooling does you a lot of good. But in places where the relative humidity is high – like the eastern US in summer – it does you less good and the wet bulb temperature is close to the dry bulb temperature. So the first interesting thing we can take from the paper is the following map of the distribution of web bulb temperatures currently:

More precisely, the wet bulb temperature being plotted here is the average annual high that extended for at least six hours, and the data is for 1999-2008. So the filthy-hottest parts of the planet become clear – the tropics of course, with the inland Amazon and northern India worst, but the eastern US is not far behind, as also northern China and much of Australia.
So how high a wet bulb temperature can people tolerate? The paper doesn’t cite much experimental data (apparently the Nazi scientists missed this in their program) but what is known is that skin temperatures above 35oC (which is 95oF) are fatal for an extended period (your skin needs to be at least a few degrees cooler than your core temperature of 37oC/98oF so that heat can be conducted from the blood to the skin in order to shed metabolic heat). So it’s reasonable that if the wet bulb temperature is above this for an extended period (they take six hours) you won’t be able to survive. In fact, given that a human who needs to be outside probably won’t be sitting in the shade with wet clothes and a big fan, the maximum survivable wet bulb temperature may actually be a degree or two lower.
At the moment, as the map above shows, nowhere on the planet gets up that high. The highest is in the low thirties – pretty damn unpleasant, no doubt, and no-one is going to do a whole lot outside under those conditions, but not actually fatal for all but a small minority of folks (probably with other health conditions).
The next thing to understand is that the distribution of uncertainty for the climate sensitivity has a long tail on the high side. The climate sensitivity, recall, is how much hotter the planet will get due to a doubling of CO2. It’s not known terribly precisely. A 2007 paper in Science, Roe and Baker, made a pretty persuasive argument that the uncertainty is always going to tend to have a long tail to the high side (at least until after we’ve run the experiment). This figure from that paper shows various different ways of estimating the probability distribution, and shows they all have a similar form:

You can see that, even though the most likely climate sensitivity is around 3oC there’s an appreciable amount of probability for sensitivities above 6oC (which is about 10oF). Maybe 5-10% depending on which probability distribution. Hard to be super-precise, but at any rate, noticeably higher than, say, your lifetime risk of dying in a car crash (1 in 83 for Americans, according to this article).
So, then, if we look at emissions, here’s the main IPCC scenarios:

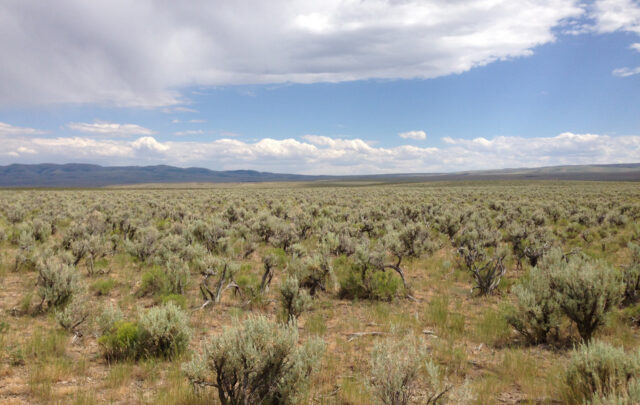
Right now, we are tracking above the red curve worst case. So, if we live in a don’t-do-much-about-climate-change world (which I hope and pray we don’t really live in, it just looks that way right now) then we could get to about two doublings by the end of the century (over pre-industrial levels of 280ppm of CO2). Thus that motivates looking at 12oC of warming as a sort of worst-reasonably-feasible case. Since there are lags in the climate system, that wouldn’t actually be reached in 2100, but maybe a few decades after (but it would be committed by 2100). So we come back to the map at the start:
This is the paper’s estimate of the annual peak six hour wet bulb temperature in a 12oC hotter world. As you can see, most of the world’s major population centers will be uninhabitable outdoors during heat waves (again, you want to look at the places over about 35oC). We will have to retreat to places like Scandinavia (which will feel as hot as tropical Africa today) and northern Canada, or just skulk inside with lots of air conditioning. But in that scenario, I think all bets are off for global civilization as I expect people in the poorer countries in the developing world will basically all flee, and who knows what the effect of that would be.