
Change in U.S. total and food system energy consumption over two five-year periods (1997-2002 and 2002-2007). Figure from Canning et al., 2010. Click image for report.
Energy used by the US food system accounted for 80% of the increase in American energy use between 1997 and 2002, according to a recent report from the USDA’s Economic Research Service. Other remarkable conclusions of the analysis include:
- Food system energy use increased by 22.4% while total energy use rose by just 3.3%.
- On a per capita basis, total energy use actually fell by 1.8%, but food system energy use was still up by 16.4%.
- Putting food on the plate of the average American required 2.4 million BTU more in 2002 than in 1997. (To put this in context, total per capita energy consumption of 20 nations was less than 2.4 million BTU in 2002.)
- The period between 2002 to 2007 likely saw another jump in food system energy use that far exceeded the increase observed in the rest of the US economy.
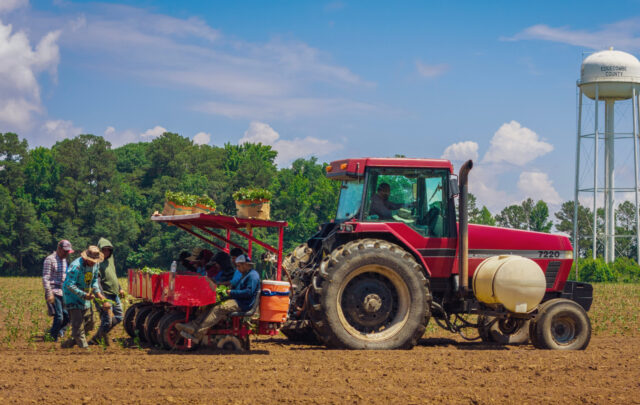
How does the way we eat have such a big effect on the amount of energy we use? According to this report, about half of the change is due to increased use of labor saving devices, with the remainder being split between population growth and changing food choices. Fewer people are farming, processing, cooking, and cleaning. Machines do the work for us, and consume more energy to do it.
The report cites the following examples:
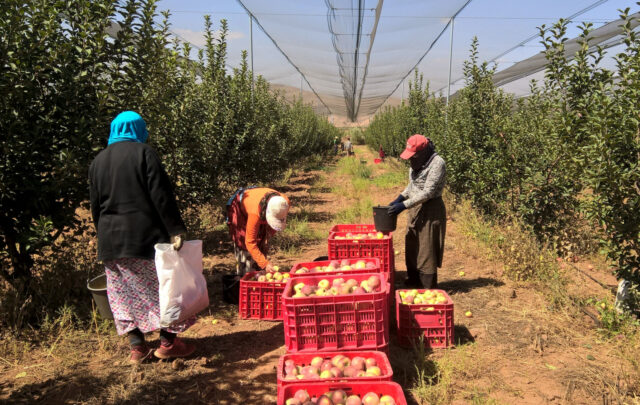
- Between 1996 and 2006 farm labor use fell by nearly 30%, while farm equipment use increased by 10%;
- 16,000 fewer people were employed in food preparation in 2000 than in 1996, but 4,800 more got jobs in food manufacturing;
- The average time spent cooking and cleaning fell from 65 minutes to 31 minutes between 1965 and 1995.
Household energy use was the biggest slice of the food system energy pie in both 1997 and 2002, followed by wholesale/retail, processing, and farming. Transportation was the smallest segment, followed by packaging and food services. Growth in energy consumption was fastest in the processing and food services sectors. The wholesale/retail segment was distinguished as the only area in which energy use declined.
Where did the energy go? U.S. food system energy use by stage of production in 1997 and 2002 (bars), with percent change over the five year period (diamonds). Figure from Canning et al., 2010. Click image for report.
About a quarter of electricity used in US homes went to food-related services, including refrigeration (14%), cooking (6.5%), freezing (3.5%), and dishwashing (2.5%). This quantity increased as more households chose to buy second refrigerators, self-cleaning ovens, and other energy-demanding labor saving devices. Vehicle trips to the grocery store were counted as a household energy expenditure, rather than a transportation system expenditure.

Where did the extra energy go? Changes in food system energy flow per capita, by food category, 1997-2002.
What we eat matters. Non-essential foods — alcoholic beverages, baked goods, snack foods, and pet foods — accounted for the biggest component of the increase observed between 1997 and 2002. The amount of energy used to get fresh fruits and vegetables to our plates also increased as we opted for pre-cut portions and convenience packaging.
The report notes that we can save energy by choosing fish over red meat, but cautions that our fisheries may not be able to sustain a large-scale increase in fish consumption. If aquaculture becomes increasingly necessary to satisfy demand for fish then much of the energy savings associated with wild-caught fish will be lost.
The report calls for food prices to accurately reflect energy consumption throughout the supply chain, to signal consumer choices that reduce energy use as energy prices rise.