


Guilty as charged: my recent postings have been all about human population and when it might peak. I don’t mean to be a bore, but it’s an important topic connected to planetary limits, human impacts, ecological health, and the appealing prospect that a near-term peak may offer an earlier off-ramp for modernity. In the past, I have stressed the point (in a blog post from 2013 and later in a textbook chapter) that population per se isn’t the phenomenon of greatest concern, but its multiplication by resource usage. It’s the combination that launches us over the ecological cliff edge, commonly expressed by the I=PAT formula for impact on the planet.
In this post, I belatedly take my own advice and re-frame the population investigation in resource terms. Now that I have a demographic tool, I can ask questions relating to when we might hit peak power as a civilization. I use power (rate of energy use) as a proxy for all manner of resource dependencies, as energy usage correlates strongly with materials use and ecological impact. Plus, it is a readily-available measure.
So, given various assumptions about how fertility rates evolve regionally, and factoring in different models for regional survival rates and migration, when might we expect global resource use to peak and begin a decline? In tandem with this event, we might correspondingly expect peak industrial output, and peak rate of (accumulating) damage to ecological health—which includes our own health. In the U.N.’s standard demographic model, population does not peak until 2086 at 10.4 billion—largely bolstered by population growth in Africa, which the U.N. parameters indicate will climb to 4 billion by 2130 (we’ll see…). But, since Africa is by far the region with the lowest per-capita consumption, declines elsewhere could more than offset Africa’s population increases in terms of resource burden.
Enough speculation: let’s unleash the model and see what happens.
Regional Power
Our exercise starts with the following table that parallels Table 3.5 in Chapter 3 of my textbook:
| REGION | POP (B) | KW/CAP | POWER (TW) |
|---|---|---|---|
| Africa | 1.49 | 0.5 | 0.8 |
| Asia | 4.79 | 1.8 | 8.6 |
| Europe | 0.74 | 4.9 | 3.6 |
| Latin | 0.67 | 2.2 | 1.5 |
| N. A. | 0.38 | 9.9 | 3.8 |
| Oceania | 0.05 | 5.4 | 0.3 |
| World | 8.12 | 2.3 | 18.5 |
Multiplying population (in billions) by the power per capita (in kW) gives terawatts (TW) of power. For the whole world, it comes to about 18.5 TW. [Note that the American regions in this table are defined differently than the continental divide employed in the textbook, in that “Latin” stands for Latin America (including Mexico) and the Caribbean, while Northern America is primarily the U.S. and Canada (see the Geographic Regions tab here for exact definitions).]
For simplicity, I hold the per-capita power usage at these values for the entire simulation. This isn’t insane, as the plot below shows global per-capita fossil fuel use being relatively flat since 1970 (right-hand plot; suggestive red curve), in contrast to the ever-climbing total power, at left. In truth, per-capita energy will more likely decline as fossil fuel availability wanes and other (associated) disruptions arise, possibly pulling the moment of peak power even sooner than the following projections suggest. Additionally, net energy peaks sooner than total energy when extraction/processing efficiency declines as easy resources are consumed first.
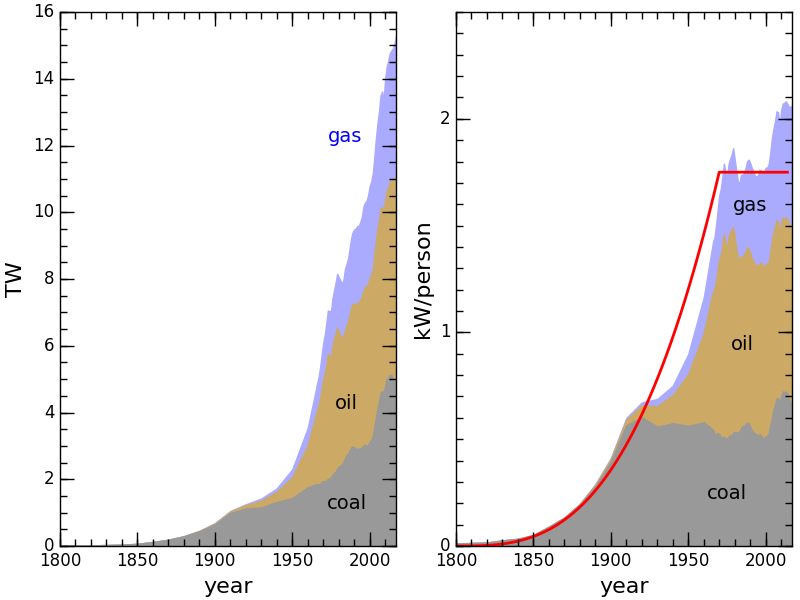
Fossil fuel use history and per-capita rate. It’s stacked, so that gas is 0.5 kW per person, not 2 kW. The red curve at right shows a relatively stable per-capita power since 1970. The surge around 2005 is largely due to a major coal increase in China.
Anyway, holding per capita power flat is fine for the purposes of this exploration, since accuracy is unobtainable in such exercises. We just want to provide some window into the situation, differentiating various outcomes at the decade scale.
U.N. Case
Let’s start with the vanilla U.N. assumptions and resulting projection. This is the one that peaks in 2086 at 10.4 billion people, with Africa still on the rise until about 2130. In the tables that follow, I list for each region (and the whole world) the year of peak power consumption and the associated value in terawatts.
| AFRICA | ASIA | EUROPE | LATIN | N.A. | OCEANIA | WORLD |
|---|---|---|---|---|---|---|
| 2130 | 2056 | 2022 | 2055 | 2094 | 2109 | 2061 |
| 2.0 TW | 9.6 TW | 3.7 TW | 1.6 TW | 4.4 TW | 0.4 TW | 20.5 TW |
So, while global population peaks in 2086 in this scenario, energy consumption peaks 25 years earlier. This is a convincing illustration that the two things have substantially different timing. Incidentally, for each region (but not the world as a whole), the year listed for peak power also coincides with peak population, as a single per-capita number is applied for the whole region.
U.N. with Flat Survival
Just as we freeze power per capita, we can freeze survival rates at today’s level. This is equivalent to saying that regional life expectancy neither rises nor falls into the future (keeping in mind that post-peak, the model becomes garbage as lots of things change). For reference, pre-COVID life expectancy in the U.S. was remarkably flat from 2010–2019 (peak was 2014; see plot below).
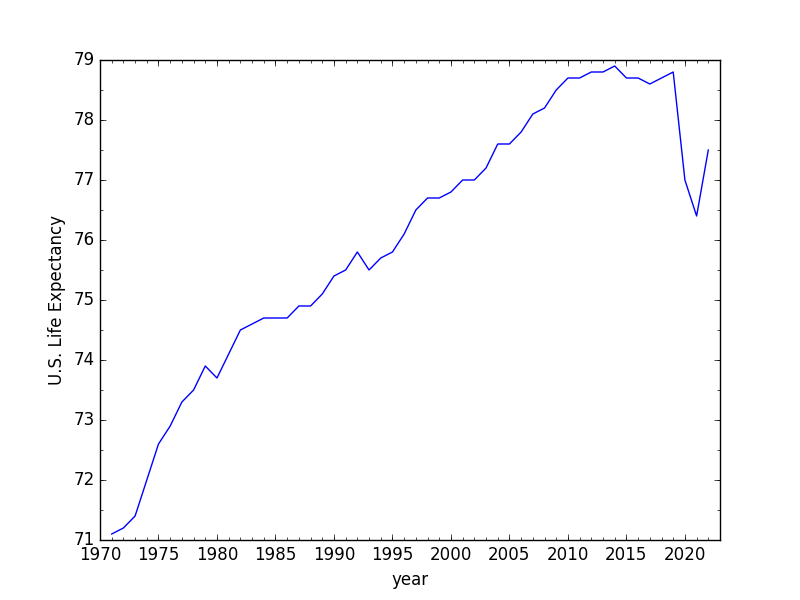
Data from the CDC: https://www.cdc.gov/nchs/data/nvsr/nvsr72/nvsr72-12.pdf
COVID contributed to a significant dip, and the 2022 number is on a par with what it was 18 years earlier in 2004. In other words, a monotonic increase in life expectancy through the year 2100—as modeled by the U.N.—already seems broken and is not guaranteed to materialize. In perhaps yet another disconnect, the 2022 UN demographic projection model expects U.S. life expectancy to break 80 in 2025—somehow. Anyway, here’s what happens in the flat-survival scenario:
| AFRICA | ASIA | EUROPE | LATIN | N.A. | OCEANIA | WORLD |
|---|---|---|---|---|---|---|
| 2100 | 2047 | 2021 | 2045 | 2050 | 2134 | 2048 |
| 1.6 TW | 9.2 TW | 3.7 TW | 1.6 TW | 4.0 TW | 0.4 TW | 19.7 TW |
Now peak power pulls back another 13 years to occur before mid-century: not far away.
My TFR and Flat Survival
I have serious qualms about the U.N.’s apparent denial of nearly-ubiquitous downward trends in total fertility rate (TFR) over the last decade, as I first expressed here and further dissected here. The basic disconnect is that many countries around the world are exhibiting low and declining TFRs, but the U.N. model repeatedly fails to capture or anticipate this trend, imagining instead a quick rebound to higher (historically “normal”) TFR values that persistently fail to materialize in projection after projection as the years roll by and the declines stubbornly continue. Using the alternate TFR model I developed (introduced here), and keeping the “flat” survival model (locking at 2023 rates), this is the emerging story:
| AFRICA | ASIA | EUROPE | LATIN | N.A. | OCEANIA | WORLD |
|---|---|---|---|---|---|---|
| 2075 | 2036 | 2021 | 2039 | 2036 | 2071 | 2036 |
| 1.2 TW | 8.8 TW | 3.7 TW | 1.5 TW | 3.9 TW | 0.3 TW | 19.0 TW |
Now we’re just 12 years out from the global peak! Africa peaks late-century, still, but at a small total power that does little to shift the larger trend. Incidentally, using the U.N. model for monotonically increasing survival rates in combination with my alternate TFR model produces a peak in 2044.
My TFR and Reverse Survival
In a declining energy scenario and the attendant economic convulsions, it could make more sense to imagine a reversal of life expectancy as advanced medical care becomes less prevalent. The slow reversal model I employ is a mirror image, so that ten years from now it’s as it was ten years ago, etc. Hey—as displayed above, life expectancy peaked in the U.S. in 2014 and is now where it was in 2004, so we’re already experiencing something qualitatively similar to this model. Reflecting the U.N. survival models around the year 2023, we get this development:
| AFRICA | ASIA | EUROPE | LATIN | N.A. | OCEANIA | WORLD |
|---|---|---|---|---|---|---|
| 2064 | 2034 | 2021 | 2035 | 2037 | 2055 | 2034 |
| 1.1 TW | 8.8 TW | 3.7 TW | 1.5 TW | 3.9 TW | 0.3 TW | 19.0 TW |
The change from the previous case is not dramatic, because peak power is so close-at-hand that medical conditions don’t change drastically from the “flat” model in ten years’ time. Still, we’re down to a decade away from now! The peak power in the last two cases is only a few percent higher than what we pump out today, so that life right now could pretty-much be what the peak feels like. It’s that odd moment near the crest of the roller coaster, when the basic contours of the experience are about to change entirely.
As an aside, if you noticed and are concerned by the strange result that Northern America moves one year later by reversing the trend (and other counter-intuitive changes in earlier cases), it’s due to the fact that the “survival” model I extracted from U.N. projections simultaneously accounts for migration, so that the reversal in this case reflects an uptick in (past) immigration.
Although plots of these model results aren’t ridiculously instructive, let’s have one anyway, including regional contributions. Dominant Asia largely sets the pace, as can also be appreciated in some of the tables above.
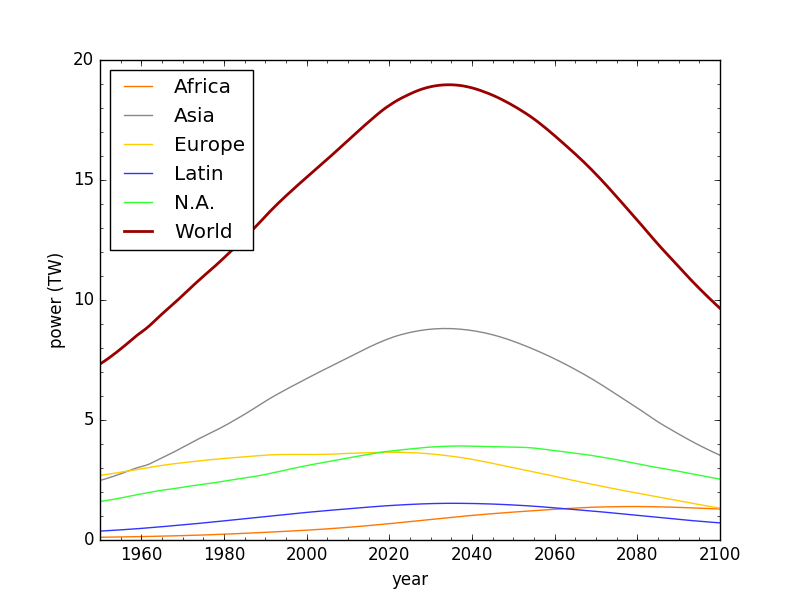
Global and regional energy demand in the model projection.
Actually, this plot just gave me a bit of Déjà Vu. Within the first month of starting Do the Math, I put up a post pointing out that data on U.S. energy usage was starting to roll under the exponential curve, but that it was too early to tell whether it was heading for leveling-out or powering-down. The curve above (for the world) is firmly in the power-down camp based on demographic projections. This isn’t a post on peak oil, but in some ways amounts to the same phenomenon of declining power, by a different mechanism: not one of the scenarios I had considered for bringing about the peak of fossil fuel use. The real world will surprise you like that!
Africa Rising
While most of the world has TFR falling faster than the U.N. models reflect, this may not be true for Africa. What if Africa is recalcitrant in its fertility decline, dropping more sluggishly than the U.N. projections? Setting aside biophysically-rooted skepticism I expressed last week, let’s see how the story changes if we keep the alternate TFR model for most of the world, but allow fertility decline in Africa to be slower than the UN case, as in the following plot.
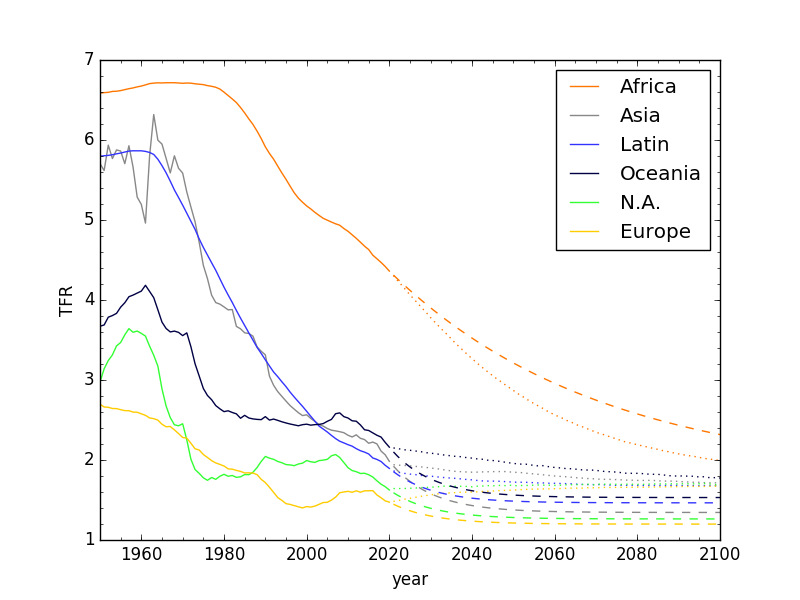
Modified TFR with slow Africa: solid is data; dashed used for the model; dotted is U.N. projections.
| AFRICA | ASIA | EUROPE | LATIN | N.A. | OCEANIA | WORLD |
|---|---|---|---|---|---|---|
| 2082 | 2034 | 2021 | 2035 | 2037 | 2055 | 2034 |
| 1.5 TW | 8.8 TW | 3.7 TW | 1.5 TW | 3.9 TW | 0.3 TW | 19.0 TW |
This change results in Africa’s population peak moving out 18 years from the previous scenario and adding another 0.75 billion people to its peak (to 2.9 billion in this reversing-survival case). Meanwhile, the global population peak only moves from 2040 to 2043 (not shown in tables). But the global peak in power did not move in year or magnitude. That’s because Africa has the smallest per-capita resource footprint of all the regions—by a significant amount—so that prolonged growth on its part does not hold much sway over the global story in terms of resource peak.
Power, not the People!
The main point of all this is that concern about population growth tends to be motivated by concern over the impacts on Earth and/or resource availability—not over the raw number of people. In this context, the date of peak-people-number may turn out to be less significant than the date of peak rate of resource exploitation. Some of the scenarios above put this within 10 years! I’m surprised. Are you surprised?
Because energy is a decent proxy for the scale of the global economy: extractive activities, industrial output, transportation, agricultural production, construction—and all the other things we do with energy—a global peak in power output likely corresponds to a global peak in the industrial scale of modernity and its economy. Wow. And that may happen in the next decade. Hold on to your hats!
Let’s throw up again a plot of the doubled-resources run from the Limits to Growth 30-year update (best match to data thus far):
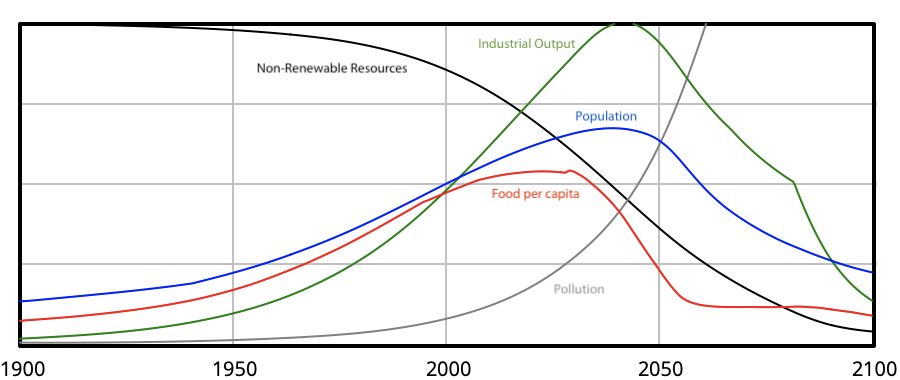
World3 model from the Limits to Growth 30 year update.
I wasn’t at all trying to match this result, but damn! Looks like a peak in industrial output and population around 2040. Food per capita is at an all-time high about now, in their model. By 2050, we should know if the model has anything to it. That’s a “short” 25 years from now, but it must have seemed a distant eternity beyond comprehension in 1972. An important distinction between Limits to Growth and demographic projections: LtG is a systems model, tracking a whole host of fundamental drivers. Demographic models tend to be narrow extrapolations based on past trends and some guesswork (idealization) as to future evolution of trends, but not attempting to dynamically model the entire interconnected system.
Is Post-Peak Bad News?
John Michael Greer offers context on what declining population could mean in a recent essay titled An Unfamiliar World. Economic growth has heretofore been entirely in the context of growing population, and not by coincidence. More people translates to more demand, more jobs, more houses, more retail, more cars, more energy, and all the rest. Fewer people translates to…
This must seem like dire news to an economist, but it may be just what the living world (to which we belong!) needs to move closer to balance and functionality. Bad news for Team Cancer, but good news for the whole organism—Team Life. And to be clear, I’m not calling humans the cancer and advocating eradication. Before being afflicted with cancerous cultural norms, humans operated within an ecological context. Pancreatic cancer does not mean that the pancreas is inherently bad—just that an unfortunate development changed its essential character and how it interacts with the whole organism. Note that a successful cancer is bad news even for itself, as it dies upon killing its host, without ever passing its genius to a future version of itself. The more “successful” it is, the worse the outcome—just as for modernity. Let’s rediscover what it is to be non-cancerous humans as integral actors in “right relationship” with the rest of the community of life. Everyone would be healthier for it.
Our present cancerous economy is not geared to handle the switch to a decline phase gracefully. Investment relies on the notion that tomorrow will be bigger than today. What does a generations-long contraction scenario look like to investors? The mattress starts to look pretty good as a place to stash cash. The question—whose answer we can’t know yet—is: how quickly and turbulently will the economic chemotherapy proceed, and can the organism survive the treatment or is the cancer too invasively suffused throughout? One ray of hope here is that each newborn is not yet infected with cultural maladies, so that real change can begin as soon as the culture recognizes its folly and tries something different—allowing the irredeemably afflicted members to fade out in a natural, slow progression.
The Stadium
At the risk of inducing metaphorical whiplash, I have also used some form of the following metaphor to paint the picture as I previously imagined it developing: Crowds flock to fill a stadium to witness a spectacular event. They aren’t sure exactly what it is they’re going to see, but word-of-mouth promises that it will be amazing. It turns out that the grand spectacle is the collapse of the stadium—entirely due to the size of the gathered crowd.
That’s how I perceived the tragic irony of having the most-ever people on the planet suffer the worst-ever event: an event brought on precisely because of so many people: a self-fulfilling tragedy that maximizes total suffering as if by dastardly design. I saw it as an unwitting and inevitable trap. Population would heedlessly grow until it hit a wall and broke its nose. And the wall.
In light of the potential for an early peak due to rapid fertility declines underway in the resource-hogging (“developed”) world, I wish to modify the stadium metaphor: fewer people came than expected, and began thinning out before triggering utter collapse.
Now, the stadium (modernity) was never built on principles of sustainability, so it inevitably crumbles anyway, and it still has substantial crowds putting a load on it, at great risk to themselves and others. But instead of wholesale catastrophic collapse that takes almost everyone down with it, smaller-scale asynchronous crumblings are confined to regions. Questions: Is it still tragic and does it still involve human suffering of an unprecedented scale? Very probably: that can’t be helped at this point, unfortunately. Is it as bad as a full-scale collapse brought on by unrelenting growth of the crowd? Surely not. I’ll take whatever sliver of good news I can get!
I should point out that the mere presence of the stadium has crushed and extinguished many species who did nothing wrong, but didn’t stand a chance. Going forward, the stadium will continue to harm others (and humans) both by its existence and during the uncooperative process of its crumbling. In other words, humans are not the only ones to suffer for its being built and for its self-destruction. Moreover, it makes no sense to pretend that harm to the community of life does not also harm humans—being that we are a part of the community, not separate from it.
Let’s face it: the stadium was never a good idea. It’s been really amazing and cool in a number of ways, but never “of this world” in the sense that it had no contextual support from ecological, biophysical, or evolutionary history, and thus was never vetted for sustainability (long-term success). It’s a short-lived stunt.
The fortunate development could be that ticket sales wane as youngsters already brought into the stadium see the cracks and decide not to invite more youngsters—ignoring the panicked old-guard who hold unshakable faith that this grand event is going to turn out to be amazing in a spectacularly good way if only the young folks would share their faith and invite more people. Meanwhile, perhaps some within the stadium will quietly find the exits and others will manage to survive the Great Crumbling to swear off stadium life forever more.
Bonus: Video!
I made a video on the topic!




Comments
We changed commenting systems on September 10, 2026 as part of a site-wide functionality and security upgrade. Your past comments have not disappeared, and you can still log in with your old Disqus account credentials if you wish. Contact us with any questions.
Models are never to be taken literally, but as portraits in a limited context. Holding things equal is a "conservative" position that is both illustrative and less likely to act as a lightning rod for criticism. In other words, if I had assumed some of the more dramatic (yet admittedly very possible) scenarios you outline, the resulting peak could be dismissed as the product of unprecedented assumptions. Conversely, we have a solid precedent for "now" conditions, and if one can show impending decline even without more speculative factors, then the chances of unwarranted dismissal go down. Other factors can then be imagined that could make it happen sooner, and that's totally fair.
For clarity, in 1972–as now–the amount of available "resource" can only be an educated guess. Technological developments can also change the amount available. So, the interpretation of BAU2 is not: "let's pretend we have two earths" but "what if we're wrong in our 1972 guesswork?" Proven reserves tend to go up, so that the total amount thought to be available has indeed expanded significantly in 50 years. Thus the better match to the BAU2 run.
Howard Odum poked a fatal hole in the techno-cornucopian argument. He showed that technology is simply a form of embedded energy, or "emergy."
The "embedded" part emboldens techno-cornucopians, who somehow think a wind turbine or a solar panel is the immortal physical incarnation of fossil sunlight. But Joseph Tainter showed us that the ongoing and increasing need of maintaining such complexity brings down civilizations.
Combine these two truths with the fact that fossil sunlight has probably already entered its phase of terminal, irrevocable decline. Call it "peak power" if you will, it's still a peak that will force a phase reversal of all the curves that continue endlessly upward and to the right.
To me, these three things make it obvious that technology is set to decline soon. That's hard to believe when every new iThingy™ is bigger, faster, and better than the last one, but keep Tainter in mind — maintaining such complexity itself has a huge, hidden, energetic cost — and energy is soon to be (if not already) in decline.
I've seen the future, and it's powered by current photosynthesis.
I'm just not sure I see any humans in that future. If they are there, they'll be lucky to have ox-carts. They certainly won't have electric cars.
Thank you.
Given the nature of double-or-quits, we must be 'worse' in Seneca terms, the further up the graph we go?
And both forms show a serious dive in food-production, now. Has that a driver? (I doubt they factored-in a war in the wheat-fields of Ukraine :). (Or did they???)
But, as you and others have pointed out, once something triggers; the cascade is entirely unpredictable; war(s), financial meltdown, even a refusal to trade. I live in a supposedly first-world country, but if I 'fast forward' our recent trends, I see decay increasing, maintenance decreasing (same thing); I see a reduction of services (health, education) both in quality and quantity. I see debt where there was none, more where there was less. And an ever-less-capable society; most aren't allowed to pick up a hammer any more, because they aren't 'qualified'. Most don't know how to grow food, some don't even know how to cook it.
Perhaps we need to put together an easily-read, many-pictured, post-collapse survival manual; everything from local leadership (how to maintain morale, give purpose/hope) to relevant skills (including taking over the role of centralized medicine and high-paid teaching). Maybe a chapter on turning F150s into low-tech windmills….
Thanks for your efforts, Tom – you and Nate Hagens (and others, of course; Gail the Actuary and Paul Chefurka come to mind) have been the go-to's for a whole echelon of us, for a long time.
There are many! We don't need new ones; we need to start living by the old ones!
The Foxfire series from the 1970s and 1980s comes to mind, as does de Decker's "Low Tech Magazine" printed books. I had over a dozen such books that I couldn't even give away when I had to abandon my project — thrift stores wouldn't even take them!
I've got soft copies on an e-Paper Kindle that has a battery life of over a month. But the damn thing erases the no-power display when the battery gets low! (Why would anyone defeat a no-power display that way, unless they could not imagine life without stable electricity?) I'm under no delusion that anything more complicated than paper will long survive.
What's more important than printed resources is practitioners. Get out there on the land and do stuff! Then pass that along.
Future knowledge transmission may be purely Socratic.
I had seen this. A few unsettling mysteries: the recalibration shows industrial output falling sharply after 2020, down about 20% by now (already falsified); persistent pollution is much delayed, and does not correlate to the rate of resource use (which they modeled just as fossil fuels, so I'd expect pollution to go like the rate of FF use). In their comparisons to empirical data (Figs 4 and 5), their recalibration is farther from data than either BAU or BAU2 (e.g., population peaking at 7.5 billion–falsified), leaving me scratching my head and wondering if they use the word "recalibration" the same way I do.
Ehrlich did not specifically mention "women" when he came up with "I=PAT."
Viewing women as unempowered home-makers and child-rearers, demographers have assumed that increasing "A" (affluence) would cause women to have fewer children. And this appears to be the case, in the industrialized world.
However, just what is "affluence," anyway?
I choose to re-define the "A" term as "Access to energy." A woman whose village has installed an electric well pump doesn't need to breed a water-carrier. A woman in a country with universal old-age pension doesn't need to breed a retirement plan.
As fossil sunlight enters permanent, irrevocable decline, women may once again need to breed their slave labour force and retirement plans.
Both the "A" and "T" terms in Ehrlich's equation are artifacts of energy.
"Malthus has been buried again. (This is the 174th year in which that redoubtable economist has been interred. We may take it as certain that anyone who has to be buried 174 times cannot be wholly dead.)" — Garrett Hardin, Bulletin of Atomic Scientists, Nov 1972, p23.
Malthus got it right, he just didn't anticipate humanity pawning the dying off onto other species. Or are you going to deny we are in the midst of this planet's sixth great extinction event?
If you're writing about the quote at the end, I believe Hardin was engaging in irony. After all, he's the guy who gave us The Tragedy of the Commons.
He also gave us this gem regarding Malthusian thought:
Supposidly educating woman causes them to have fewer children, but it is not just the ediucation. The education allows them to make more money which they use to expand their environmetal footprint. If you halve someone's fertility rate by tripling their environmetal footprint what has been gained? Nothing, it is a net loss for the environment.
I hear you! But remember I=PAT generally measures our Impact by multiplying Affluence by Population by Technology. That is – we’re using too much stuff, by too many rich people, powered by the wrong fossil fuel and industrial Technologies. But what if the T stops being a multiplier of harm – and becomes a divider? We are hurting the biosphere in so many ways but the worst is climate change. Renewable energy is growing exponentially – and it can be made from abundant and renewable materials. Then there are trends in Electrifying Everything in industry, circular economies, and reducing our total lifestyle impact through the Ecocity movement. We can substitute for more abundant and sustainable materials. Instead of so much steel and concrete in bridges and skyscrapers – we can now build many of them out of wood! (Google “Cross Laminated Timber”). Both Precision Fermentation and seaweed farming has enormous potential to generate all the protein powder we could need to give to food techs to turn into alternative-meats. Basically, the sooner we educate and empower all children in the developing world WHILE also helping them leapfrog the wrong Tech into the right Tech – the sooner we can give something young people have been lacking for a while. Hope.
So – how close are we to using up the best solar and wind resources? (winks). Still equating net energy with some kind of Hubbert's peak is just wrong now that the EROEI of solar and wind are so much greater than oil. Seriously – as the EV's roll out, the IEA predicts peak oil DEMAND by 2028 and peak CO2 EMISSIONS by 2030-ish.
The European Union political debate is way ahead of where the debate in the USA appears to be. (Some of the American technical writers at RMI or Cleantechnica etc are brilliant – I'm talking about the developing state of legislation.) The political debate in the EU is already getting into the circular economy , encouraging new companies that wean off rare earths and build electric motors without permanent magnets, Electrifying Everything, lower CO2 concretes, etc. They're talking about how to prepare to recycle all the EV's, solar panels and wind turbines.
But Tom Murphy is still talking about "easy resources" being consumed first? Sure – there are older brands of the Energy Transition that still rely on rare earths and critical minerals – and those 'easy resources' may have issues. The new brands that avoid all that and are built out of super-recyclable, super-abundant materials will swoop into the market if the older brands cannot adapt in time. Then we'll have abundant renewable energy from abundant renewable materials. Cool, hey?