Global warming is already showing profound and visible impacts around the world. However, some changes may be unnoticed until they occur abruptly and these rapid shifts may often be irreversible.
Such changes occur when a threshold called a “tipping point” is reached. Near the tipping point, the stability of the system is reduced such that a small change in the conditions can push the system into a completely different state.
The history of our planet’s climate is punctuated by abrupt change and the Intergovernmental Panel on Climate Change (IPCC) has warned with high confidence that tipping points in response to future warming “cannot be ruled out”.
To identify those components of the Earth system that might exhibit tipping behaviour in the future, we can look for abrupt changes in the past. Of particular value is to focus on the relatively recent past when the climate was not that different from today.
Our findings, published in Nature Communications, indicate that an ocean circulation in the North Atlantic shows signs of having crossed a tipping point during the transition into the Little Ice Age.
The Little Ice Age was the most recent notable climate shift in Earth’s history before industrialisation. It brought cooler-than-average conditions to the North Atlantic region and spanned several centuries from around 1300 to 1850.
Our findings, based on data reconstructed from the shells of clams, show how freshwater from melting ice in the North Atlantic has the potential to destabilise ocean currents and can lead to rapid and long-lasting change.
Clam shells
The abrupt nature of tipping points mean they can be tricky to see coming. In particular, it is often difficult to tell whether a tipping point is nearby just by looking at the average conditions in a system, because they do not exhibit noticeable changes.
However, scientists have observed that when a tipping point is approached gradually, the loss of “stability” in the system means it takes longer to recover from fluctuations in the environment.
This behaviour – called “critical slowing down” – causes the system to become more “similar” from one moment to the next. We can measure this using statistical indicators, which show when there is a loss of stability and a tipping point may be approaching.
[slide-anything id=’3472166′]
We found signs of a loss of stability during the transition into the Little Ice Age within three already existing reconstructions of the marine environment.
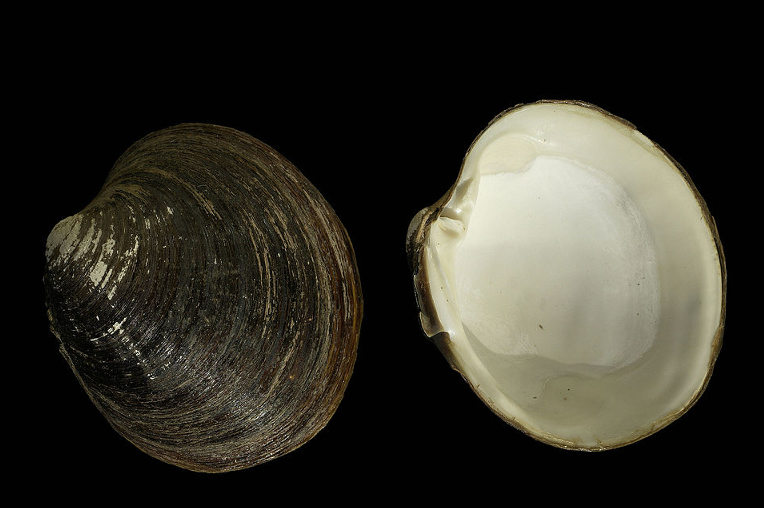
These proxy records are natural archives recorded on the shells of the ocean quahog (Arctica islandica), a species of clam that lives buried in the North Atlantic seabed for decades to hundreds of years. (See Carbon Brief’s explainer for more on proxy data.)
The ocean quahog forms a new shell growth band every year and the width of this band reflects environmental conditions – as we see in the concentric rings within a tree trunk.
Overlapping the information from shells that lived at different times helps to obtain long-term and precisely dated records. For example, scientists can count back through the rings and infer the conditions at the time of a specific historical event. Furthermore, the chemical composition of the shells encodes information about the state of the seawater in which the quahog was growing.
The records that we studied are the longest of their type, spanning the entire last millennium. They were constructed by measuring the width of the growth bands along with the oxygen and carbon isotopes on shells collected from north of Iceland. Together, they provide insights on a range of processes in the marine environment, such as regional changes in circulation.
What makes these reconstructions unique and suitable for our analysis is that they contain a continuous record of year-to-year changes.
The figure below shows a close view of the growth bands on an ocean quahog shell and a section of the three reconstructions – oxygen isotopes (blue), carbon isotopes (orange) and shell growth (grey) – used in our study.
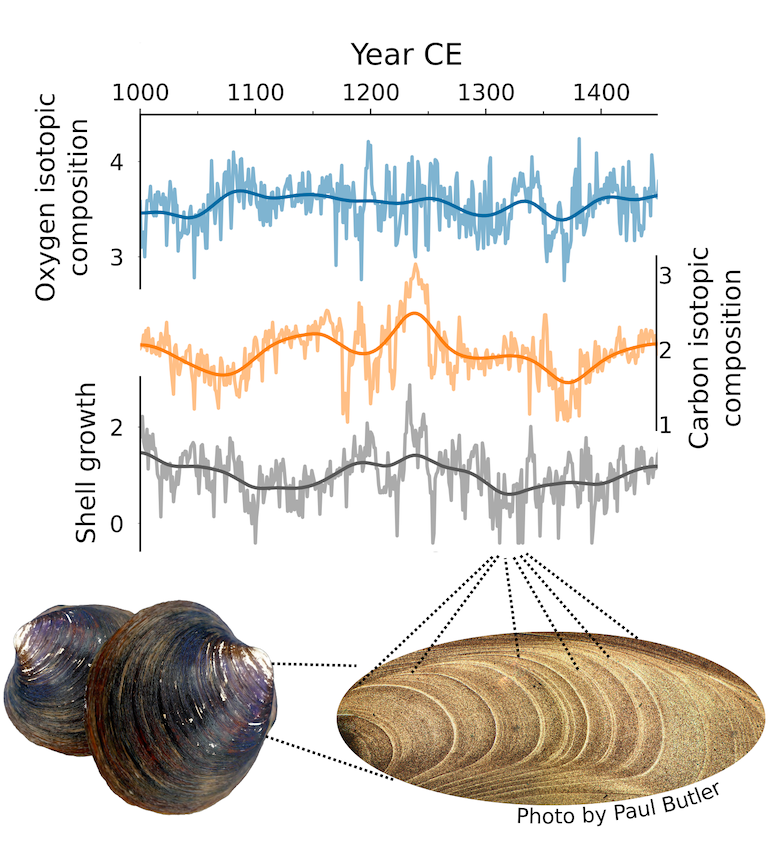
Growth bands on the ocean quahog shell and the information that can be obtained from them. Credit: Beatriz Arellano-Nava.
Destabilisation episodes
These shell records reveal that the fluctuations of the marine environment markedly slowed down during two “destabilisation” episodes.
The first and most noticeable episode occurred within the last decades (1110-1260) of a warm period called the “Medieval Climate Anomaly”. The second episode occurred during the 14th century.
You can see this in the figure below, which shows an indicator of slowing down computed over each shell record. Slowing down is detected when the values show a markedly increasing trend, as it is highlighted on the two shaded intervals, indicating loss of stability.
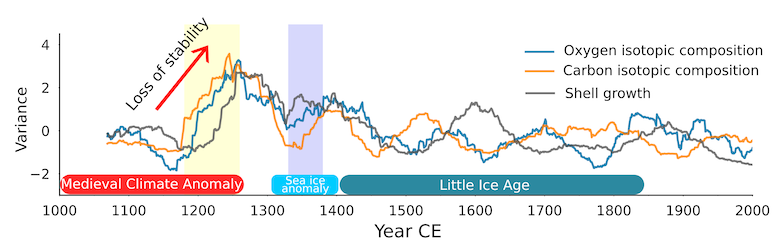
Changes in stability along the three shell records. This illustration shows changes in one of the indicators used to measure slowing down. When the values exhibit a markedly increasing trend we can tell that the system has slowed down and is less stable. The first and second destabilisation episodes are indicated by the yellow and blue bars respectively. Source: Arellano-Nava et al. (2022).
Other regional reconstructions indicate that after each episode, the wider subpolar North Atlantic experienced rapid changes. There was an abrupt cooling along the path of the northward flowing currents that carry warm water from the south. Also, there is evidence for a rapid weakening of the subpolar gyre, a circulation system that drives the oceanic currents and redistributes heat and freshwater in the high latitude North Atlantic.
The subpolar gyre has been put forward as a potential element of the climate system that could tip between a strong circulation and a weak circulation configuration.
The gyre is a component of a wider circulation system known as the Atlantic Meridional Overturning Circulation (AMOC). This is considered as a major tipping element of the climate system and in risk of being tipped into a weak mode under some climate change scenarios. However, the relationship between both elements is not yet well understood.
The slowing down observed in the shell records indicates a loss of stability that culminated in rapid changes during the transition to the Little Ice Age. This behaviour is consistent with the crossing of a tipping point. An abrupt weakening of the subpolar gyre reduced the transport of warm water towards the north, potentially sustaining the cold conditions for such a long period.
What caused the destabilisation
The system of currents in the subpolar North Atlantic is, in part, driven by deep water formation. This is the sinking of dense water mainly in the Labrador Sea area. When the salty water is diluted with freshwater, it becomes lighter and less able to sink, dampening the engine that pumps up ocean circulation in the region.
You can see these currents in the figure below, which shows in red the currents flowing towards the north, transporting warm and salty waters. A branch of the main North Atlantic Current diverts towards the north-west around the northern boundary of the subpolar gyre, which flows anticlockwise.
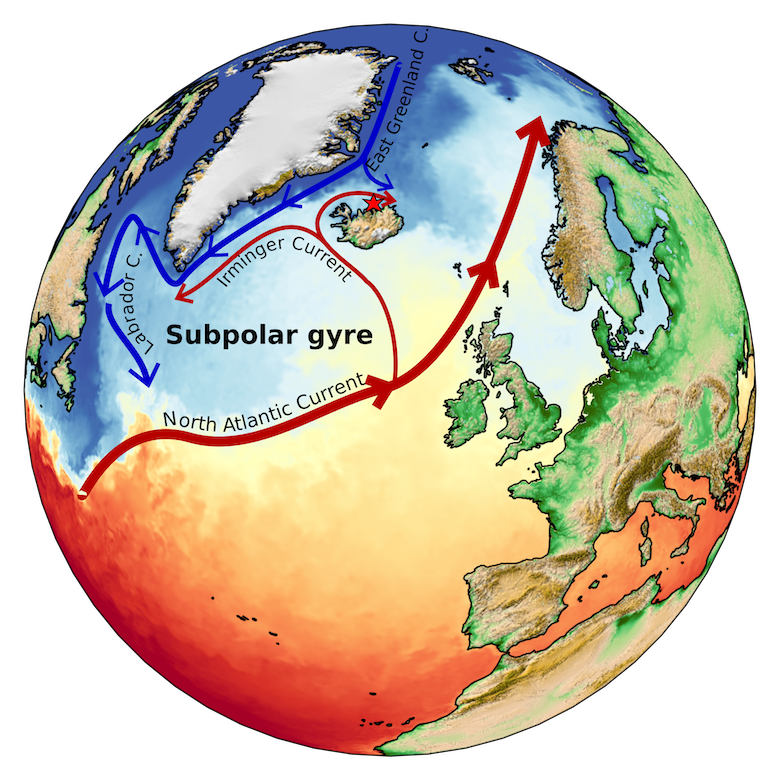
Illustration of the North Atlantic subpolar gyre. The red arrows represent the relatively warm and salty waters carried northwards by the North Atlantic Current, westward as the Irminger Current, and clockwise around Iceland as the North Icelandic Irminger Current. The blue arrows correspond to relatively cool and fresh Arctic waters transported southward by the East Greenland Current that diverts north of Iceland as the East Iceland Current and southwest of Greenland as the Labrador Current. The subpolar gyre flows anti-clockwise in the subpolar North Atlantic. The red star indicates the location of the quahog shell sampling site (80 metre water depth). The colour map represents April sea surface temperatures during 2016. Credit: Beatriz Arellano-Nava.
Several reconstructions report an unusually large outflow of sea ice from the Arctic into subpolar latitudes during the 14th century.
The added freshwater from this sea ice when it melted contributed to the weakening of ocean currents. This, in turn, reduced heat transport towards the north, which sustained cold conditions and supported further expansion of sea ice. This formed a feedback loop that maintained the system in that configuration.
It is thought that the initial export of Arctic sea ice was probably caused by the cooling effect of a sequence of strong volcanic eruptions, combined with a period of low solar activity during the second half of the 13th century. This initial short-term cooling was then amplified and sustained by the feedback between sea ice and ocean currents.
The second episode of loss of stability detected in our study occurred at the same time as this large outflow of sea ice from the Arctic and is consistent with this hypothesis. However, the first and most remarkable episode of loss of stability occurred before the initial cooling and expansion of Arctic sea ice.
At the time of the first episode, temperatures were warmer than average. There is evidence that during those decades, melting of icebergs and glaciers from South Greenland contributed to the freshening of the surrounding ocean. This process likely caused the observed loss of stability and increased the vulnerability of the climate system to further changes.
Present changes
Under current global warming, the Greenland ice sheet and Arctic sea ice are melting at an accelerated rate.
Our study suggests that this additional freshwater has the potential to destabilise the ocean currents and can lead to rapid and long-lasting change. During the transition into the Little Ice Age, this led to cooler than average temperatures in the North Atlantic region, and an increase of extreme weather events in some areas. However, we cannot extrapolate those impacts to our current scenario of human-driven global warming.
We need to be alert to these tipping points, do our best to quantify how close we may be to them, and understand their impacts so we can plan the potential for adaptation.
Fundamental to all of this are long-term, high-resolution records that extend back before many of our marine observations began. The tiny ocean quahog may therefore just turn out to be a huge help.
Arellano-Nava, B. et al. (2022) Destabilisation of the subpolar North Atlantic prior to the Little Ice Age, Nature Communications, doi:10.1038/s41467-022-32653-x
Teaser photo credit: Ocean quahog from the North Sea. By © Hans Hillewaert, CC BY-SA 4.0, https://commons.wikimedia.org/w/index.php?curid=1930486