Because the expectation of climate scientists is that the high latitudes will experience the largest degree of warming due to global warming, I decided many years ago to monitor temperatures at various widespread locations in northern North America.
At one time I monitored many more locations than I do now. The reason for the reduced number of monitoring locations now is that during the Harper administration in Canada, Environment Canada, where I was obtaining data, stopped distribution of temperature data for many locations.
Table I contains temperature (oF) deviation data for 9 northern North American locations for the period 2010-2019, relative to 1971-2000 averages.
| Location | Prudhoe Bay, AK | Moosonee, Ontario | Nome, AK | Churchill, Manitoba | Iqaluit, Nunnuvut | Goose Bay, NFL | Yellowknife, NWT | Sault Ste. Marie, MI | Hibbing, MN |
| 2010 | 3.56 | 6.30 | -0.39 | 7.70 | 9.85 | 7.41 | 6.20 | 4.62 | 2.47 |
| 2011 | 2.62 | 2.18 | 0.58 | 3.66 | 2.85 | 2.89 | 3.04 | 2.94 | 0.70 |
| 2012 | 1.84 | 4.70 | -3.34 | 3.70 | 3.32 | 4.07 | 3.87 | 5.48 | 3.01 |
| 2013 | 2.30 | 0.78 | 0.72 | 0.67 | 1.97 | 2.44 | 0.98 | 0.88 | -1.38 |
| 2014 | 4.58 | 0.28 | 4.64 | 1.91 | 2.33 | 1.08 | 0.49 | -1.43 | -1.99 |
| 2015 | 4.38 | 2.66 | 2.13 | 2.33 | -2.98 | -0.97 | 3.08 | 1.89 | 1.93 |
| 2016 | 8.02 | 3.14 | 5.33 | 2.59 | 2.34 | 0.46 | 4.23 | 4.84 | 1.20 |
| 2017 | 6.84 | 2.14 | 2.19 | 2.41 | 3.19 | 1.60 | 3.11 | 3.61 | -1.01 |
| 2018 | 5.58 | -0.20 | 4.06 | 0.98 | 0.37 | 0.45 | 1.01 | 2.80 | -2.15 |
| 2019 | 8.22 | 1.28 | 4.70 | 2.08 | 5.64 | 0.61 | 0.88 | 0.88 | -2.95 |
| Avg. | 4.79 | 2.33 | 2.06 | 2.80 | 2.88 | 2.00 | 2.69 | 2.65 | -0.02 |
Table I
I think the most notable data in Table I is that for Prudhoe Bay. In the last 5 years (2015-2019) there were 2 years in which the temperature deviation, relative to the 1971-2000 average, was over 8.00oF. That is a substantial deviation relative to a recent time frame.
In 2019, the deviation was 8.22oF but it easily could have been considerably higher considering that the summer months didn’t have large positive deviations and August actually was slightly negative. Two months, February and March, had temperature deviations of over 20oF. That is impressive.
The Prudhoe Bay temperature deviation for 2010-2014 was 2.98oF, while that for 2015-2019 was 6.73oF. Other locations, such as Churchill, had the opposite trend, although smaller, suggesting that changes had occurred in the jet stream pattern between the first half of the decade and the second half.
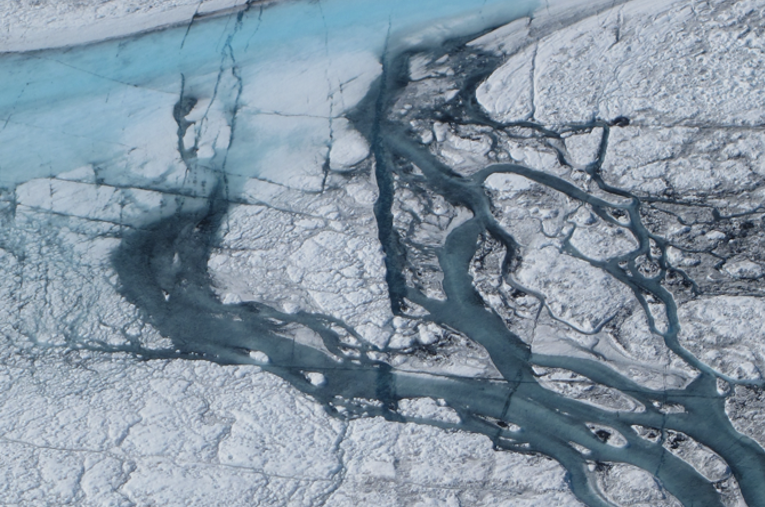
It’s interesting that Iqaluit had an average temperature deviation of 9.85oF, relative to the 1971-2000 average, in 2010 but the deviations have been considerably less since then. It appears that a factor in that regard may be the rapid melt rate of the Greenland ice sheet in recent years. The rapid melt created a huge blob of cold water in the north Atlantic that appears to have influenced Iqaluit’s, as well as Goose Bay’s, temperature deviations (see Figure I below).
Figure I
Here are a few recent article titles about the Greenland ice melt rate.
Greenland’s ice is melting at the rate scientists thought would be our worst-case scenario in 2070
Greenland’s Ice Sheet Melt Rate Is ‘Off the Charts,’ Study Says
Greenland’s ice losses have septupled (since the 1990s) and are now in line with its highest sea-level scenario, scientists say
Articles dealing with climate disruption often state that some change wasn’t expected until 2070 or later. Scientists tend to be conservative in their predictions.
Here are a few excerpts from recent articles dealing with Greenland’s ice melt:
“The sheet’s total losses nearly doubled each decade, from 33 billion tons per year in the 1990s to an average now of 254 billion tons annually (In one day during the summer of 2019, Greenland lost an estimated 12.5 billion tons of ice. Now isn’t that impressive?). Since 1992, nearly 4 trillion tons of Greenland ice has entered the ocean, the new analysis found, and equivalent to roughly a centimeter of global sea-level rise.”
“Greenland’s ice sheet is not only melting, but it’s melting faster than ever because the area has become more sensitive to natural climate fluctuations, particularly an atmospheric cycle, a group of scientists reported today (Jan. 21, 2019) in the journal Proceedings of the National Academy of Sciences.”
“The researchers found that the ice is vanishing four times faster than it was in 2003 — and a good chunk of that acceleration is happening in southwest Greenland.”
12.5 billion tons: Amount of ice that melted off Greenland’s ice sheet in one single day in August. That’s enough to cover all of Florida in nearly five inches of water.
What is happening in Greenland, in terms of ice melt, is also happening in Antarctica, particularly West Antarctica but also in large areas of East Antarctica. For a long time, scientists were of the opinion that such changes wouldn’t occur in East Antarctica because it’s colder there. Apparently they were wrong.
A recent study found over 65,000 supraglacial lakes on the East Antarctic ice sheet, far more than were expected. The largest was over 27 square miles. The ice on Greenland and Antarctica is being eaten away from above and below due to warm sea currents, atmospheric rivers of rain, warm air temperatures and supraglacial lakes draining through the ice.
Years in which locations such as Sault Ste. Marie had lower positive or negative temperature deviations correspond to years in which a persistent jet stream pattern coming from the Artic occurred. The only year, over the last decade, in which the temperature deviation was negative for Sault Ste. Marie was 2014, a year in which the first five months had negative temperature deviations, with the first three months being strongly negative. The jet stream was persistently coming from the north or northwest during that period. As the Arctic warms, the jet stream slows down and becomes more unstable, leading to a wavier pattern.
In 2019, there was a persistent jet stream flow from the Arctic into the center of northern North America as can be seen in Figure II (The base period in this figure is 1981-2010 not 1971-2000). Note that Alaska was substantially above the 1981-2010 temperature average. That, and the below average temperatures in the center of North America, were due to the jet stream coming up from the south to Alaska and then down into the center of North America. That brought warm air up to Alaska from the south and cold air down from the Arctic into the center of North America.
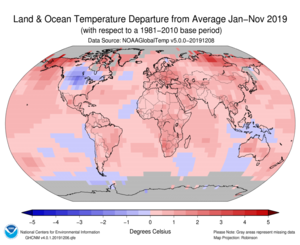
Figure II
Below, Table II contains Dec. 2019 and 2019 annual temperature deviation data (All averages are relative to 1971-2000 averages) for the 9 locations I monitor in northern North America:
| Location | December Temperature Deviation (oF) | 2019 Temperature Deviation (oF) |
| Prudhoe Bay, AK | 4.65 | 8.22 |
| Moosonee, Ont. | 1.21 | 1.28 |
| Nome, AK | 1.18 | 4.70 |
| Churchill, Man. | 3.29 | 2.08 |
| Iqaluit, Nunn. | 16.66 | 5.64 |
| Goose Bay, NFL | 4.15 | 0.61 |
| Yellowknife, NWT | -4.21 | 0.88 |
| Sault Ste. Marie, MI | 4.68 | 0.88 |
| Hibbing, MN | 3.00 | -2.95 |
| Avg. | 3.78 | 2.46 |
Table II
In December 2019, a cold air mass settled over a large area of north-central North America during the first 20 days of the month. A warm-up in the last ~10 days negated much or all of the negative deviations from the first 20 days.
There were wild swings in temperature at many locations between the first 20 days and the remainder of the month. That was particularly evident at Prudhoe Bay and Yellowknife. At Prudhoe Bay the deviation was 11.78oF on December 20 but ended the month with a deviation of only 4.65oF. At Yellowknife, the deviation was -12.10oF on December 20 and ended the month at -4.21oF.
At Sault Ste. Marie, the deviation was -1.5oF on December 20 but Sault Ste. Marie ended the month 4.68oF above the 1971-2000 average.
Iqaluit was exceptionally mild during the month of December with only 1 day where the average temperature was below 0oF. One of those days had an average temperature of only -1oF and the other day was the last day of the month.
Table III contains average temperature data per decade from 1890 through 2019 for Sault Ste. Marie:
| Decade | Average Temperature (oF) |
| 1890-1899 | 39.47 |
| 1900-1909 | 39.86 |
| 1910-1919 | 39.40 |
| 1920-1929 | 39.56 |
| 1930-1939 | 40.84 |
| 1940-1949 | 40.36 |
| 1950-1959 | 40.23 |
| 1960-1969 | 39.86 |
| 1970-1979 | 39.77 |
| 1980-1989 | 40.18 |
| 1990-1999 | 40.85 |
| 2000-2009 | 42.14 |
| 2010-2019 | 42.82 |
Table III
What is obvious in Table III is that there has been a consistent increase in the average temperature per decade since the 1970s. Figure III is a graph of decadal temperature data for Sault Ste. Marie from 1890 through 2019.
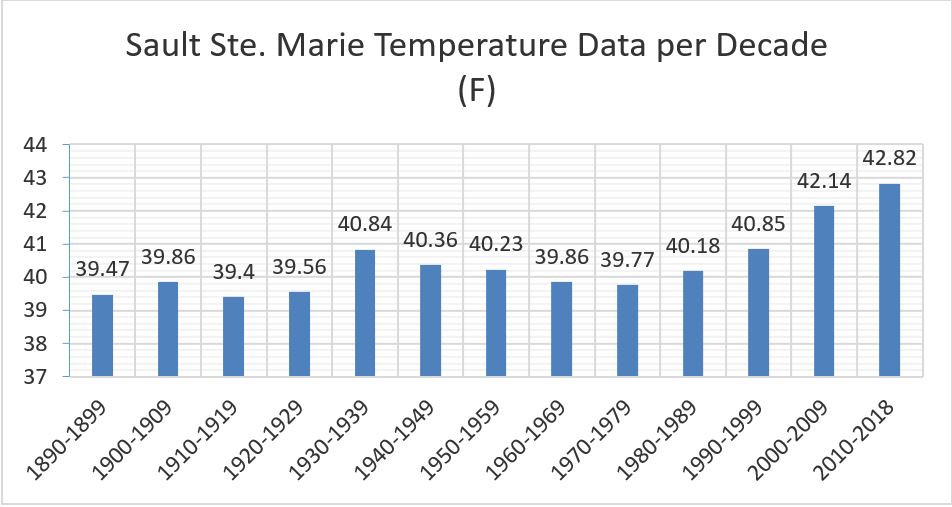
Figure III