This post is an update of a graph done in 2015:
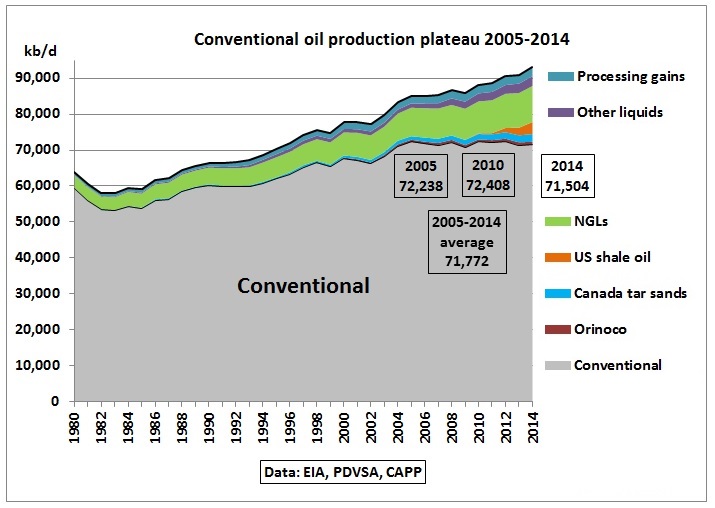
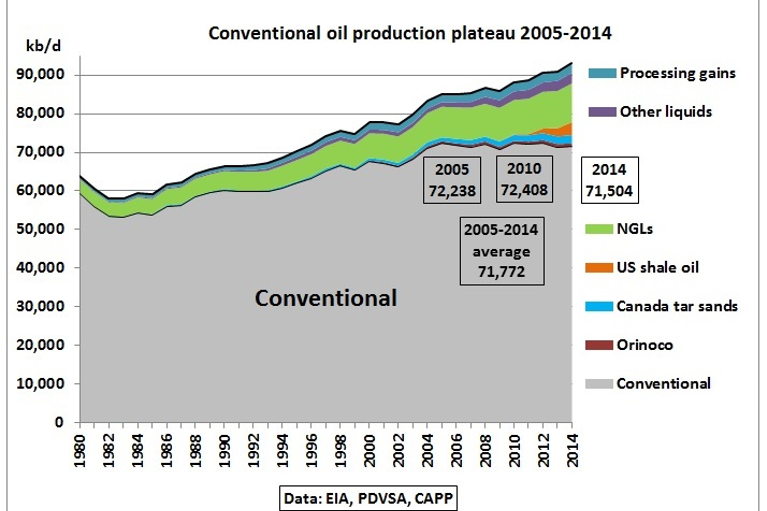
Fig 1: Conventional oil production on bumpy plateau 2005-2014
In http://crudeoilpeak.info/latest-graphs
When adding the new data for 2015-2018 it was discovered that the 1980-2014 data had been changed – mainly increased by up to 1.24 mb/d in 2014 as shown in this graph:
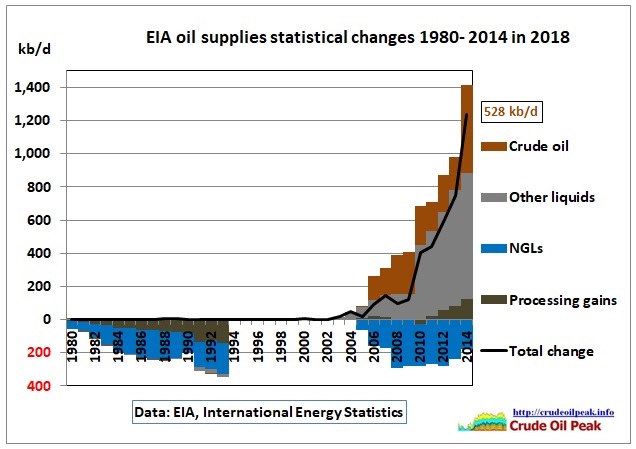
Fig 2: Total EIA oil supplies were retrospectively changed
When (re-)calculating conventional crude oil production the increase in crude oil (528 kb/d in 2014) matters most so the following graph shows this difference.
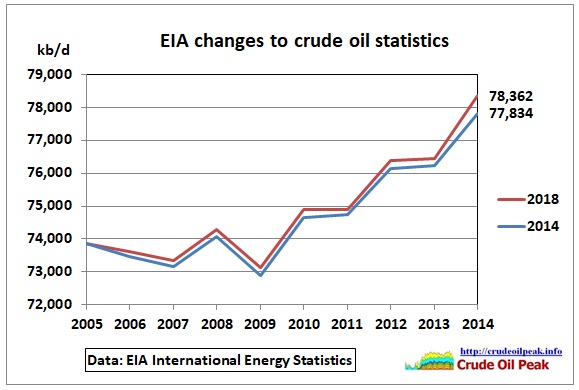 Fig 3: Changes in EIA crude oil statistics
US shale oil production
This is unconventional oil as the source rock has low permeability and low porosity and therefore needs to be fracked.
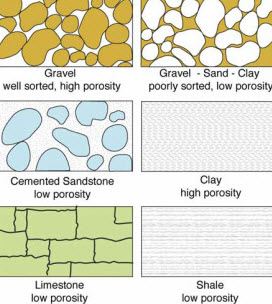
Fig 4a: Porosity in different types of rocks and soils
https://www.petropedia.com/the-significance-of-porosity-to-original-hydrocarbon-in-place/2/9898
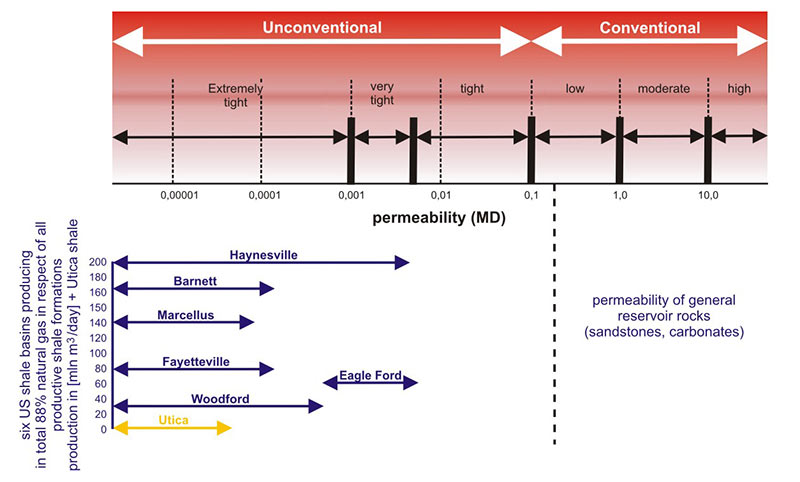 Fig 4b: Permeability in various reservoir rocks
https://infolupki.pgi.gov.pl/en/gas/petrophysical-properties-shale-rocks
As a result of this fundamentally different geology, shale oil decline rates are more than 10 times higher than in conventional oil fields. From an initial peak, shale oil production can decline by 80% within 1 year and 90% within 2 years. Conventional decline is usually around 5% pa.
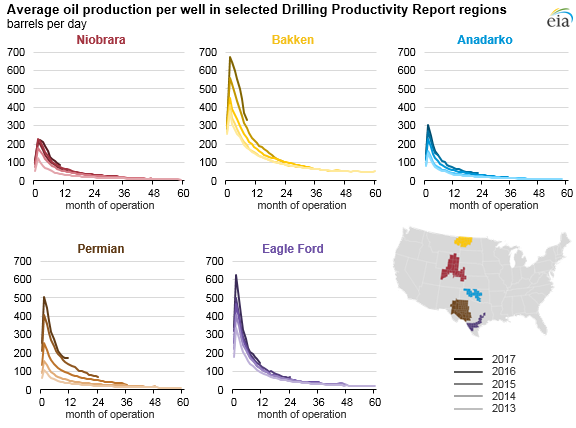 Fig 5: Production profiles in selected shale oil regions in the US
https://www.eia.gov/todayinenergy/detail.php?id=36012
Initial well production – varying depending on geology – has increased over the years but decline rates have not improved.
US shale oil production can be obtained from the drilling productivity report (Excel file https://www.eia.gov/petroleum/drilling/xls/dpr-data.xlsx). This file is regularly modified (retrospectively) and updated. The corrections are usually upwards as the original drilling reports are estimates.
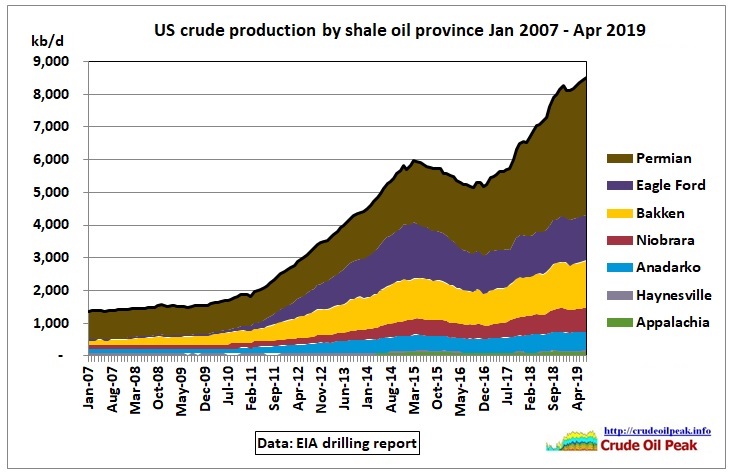
Fig 6: Crude production with data from drilling reports
https://www.eia.gov/petroleum/drilling/
The colors in Fig 6 are the same as those adopted by the EIA in this article https://www.eia.gov/todayinenergy/detail.php?id=39332
When comparing the drilling report data with the State data, we find a good match:
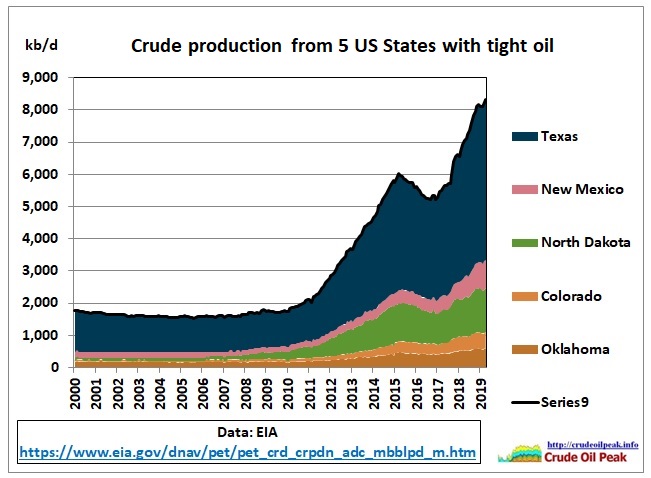
Fig 7: Crude production with data from
https://www.eia.gov/dnav/pet/pet_crd_crpdn_adc_mbblpd_m.htm
How does that fit into the production statistics for the whole of the US? First, we have to find the conventional component of the Permian:
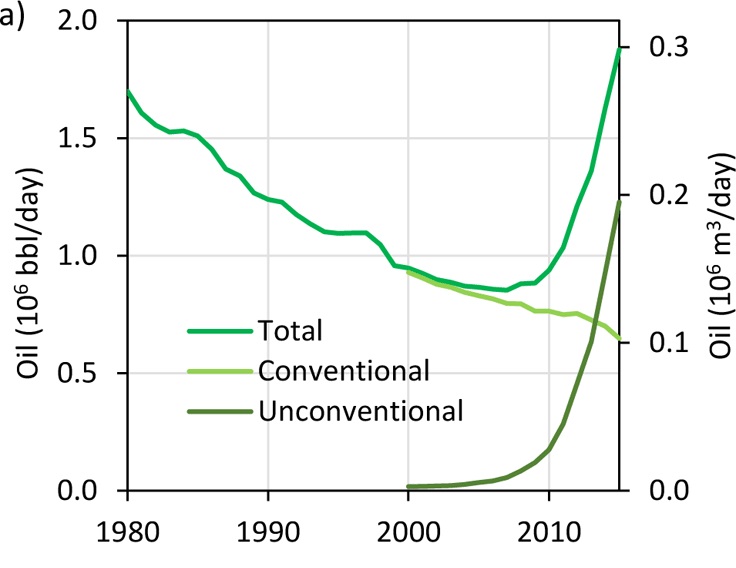
Fig 8: Permian basin oil production https://www.researchgate.net/publication/319530733_Water_Issues_Related_to_Transitioning_from_Conventional_to_Unconventional_Oil_Production_in_the_Permian_Basin/download
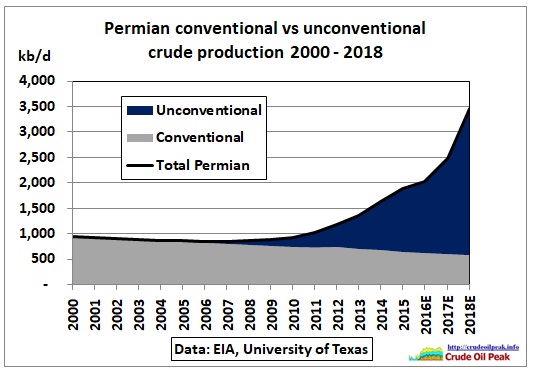
Fig 9: Permian crude production by type
We incorporate the conventional wedge into Fig 9 and add production from other States:
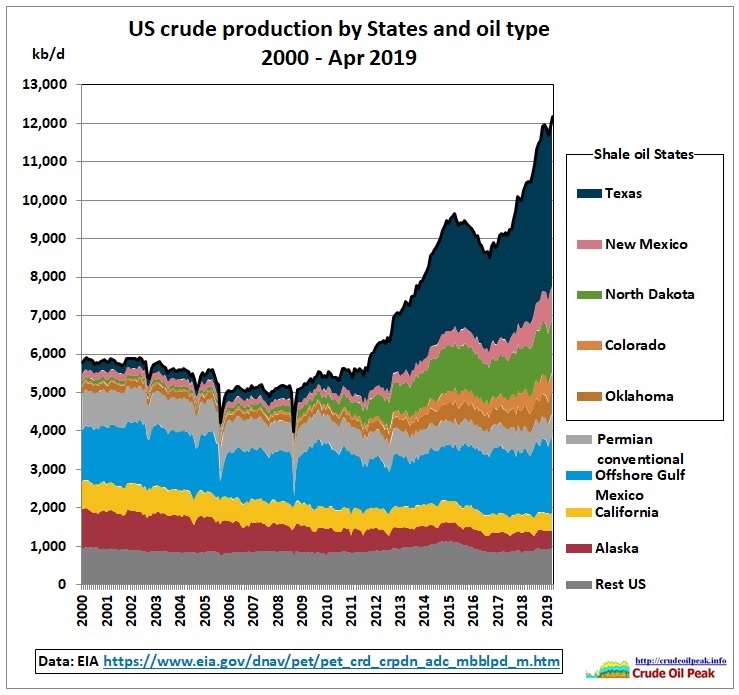 Fig 10: US crude production by State and oil type
Shale oil production really started only after 2004:
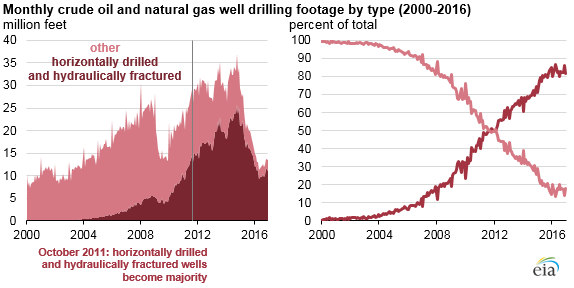
Fig 11: Fracking horizontal wells started in the early 2000s https://www.eia.gov/todayinenergy/detail.php?id=34732
So we still have to separate the conventional production from the shale oil States.
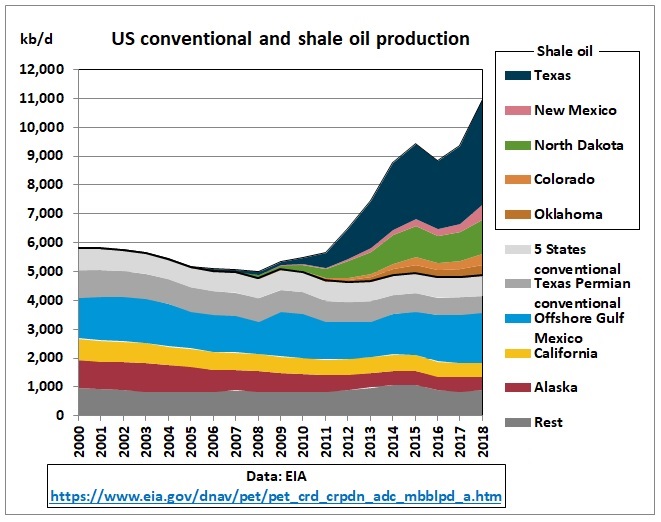
Fig 12: US shale oil production above black line
Canadian tar sands
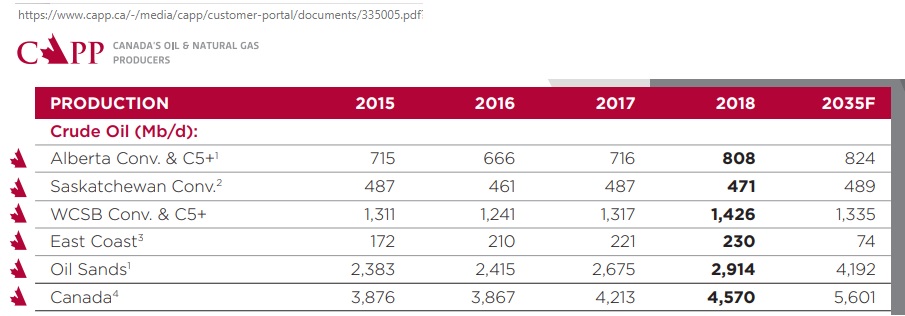
Fig 13: Canadian crude production
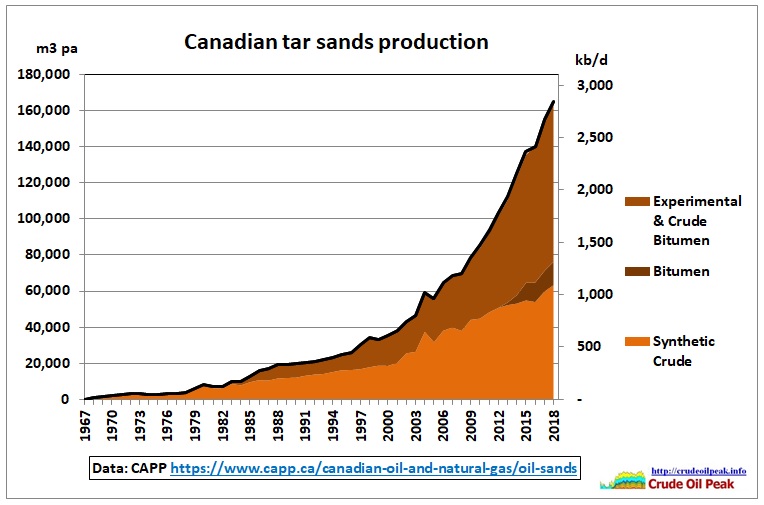
Fig 14: Canadian tar sands production by type
https://www.capp.ca/publications-and-statistics/statistics
Venezuela extra heavy oil (Orinoco)
Extra heavy oil production data have been used from these sources:
PODE the statistical publication of PVDSA http://www.minpet.gob.ve/index.php/es-es/comunicaciones/pode
Weathering Collapse: An Assessment of the Financial and Operational Situation of the Venezuelan Oil Industry
Hernandez and Monaldi
November 2016
The Growth Lab, Centre for International Development
Page 66
https://growthlab.cid.harvard.edu/files/growthlab/files/venezuela_oil_cidwp_327.pdf

Fig 15: The late Comandante Chavez showing properties of extra heavy oil
Informe del Comisario 2017
Tables on pages 206-7 and 220
http://petroleumag.com/wp-content/uploads/2019/01/2017-INFORME-DEL-COMISARIO-2017-700-paginas.pdf
The Oil Industry Won’t Save Venezuela
CSIS
Andrew Stanley
28 March 2019
https://www.csis.org/analysis/oil-industry-wont-save-venezuela
Spanish translation:
https://www.laranadigital.com/analisis-del-csis-energy-program-la-industria-petrolera-de-venezuela-no-sera-lo-que-fue/
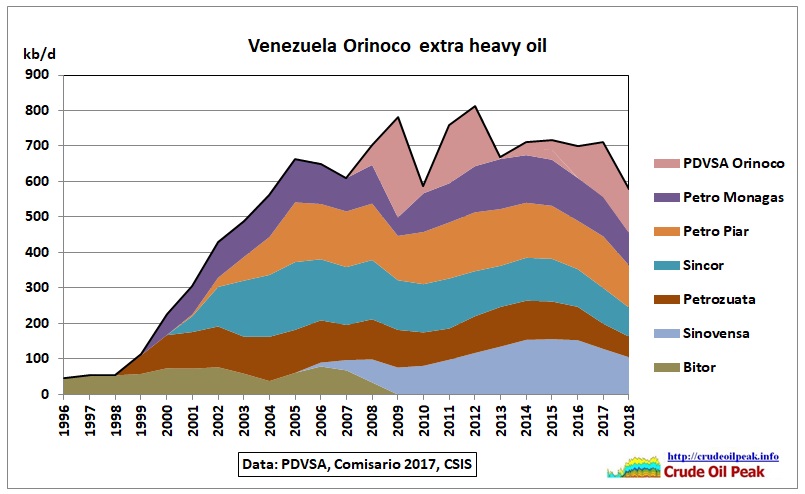
Fig 16: Venezuela extra heavy oil production by field/company
The data are difficult to reconcile and not very reliable, especially for PDVSA Orinoco (esfuerzo propio). 2018 has been guestimated on the basis of the above mentioned CSIS article.
Nelson Hernandez https://twitter.com/energia21 describes the data confusion: “It is noteworthy that in 2008, seeing that the promised production (4 mb/d) was unattainable, they created the FPO Division (Faja Petrolifera del Orinoco), extending the geographic limits of the FPO and incorporating fields with crude oils other than the typical FPO (extra heavy) oil. In other words, the production of the FPO Division is a mixture of different crude gravities. For 2016, the division produced some 1,300 kb/d.”
https://www.lapatilla.com/2018/03/21/tras-cinco-planes-fallidos-la-produccion-en-la-faja-petrolifera-del-orinoco-declina/
All together now
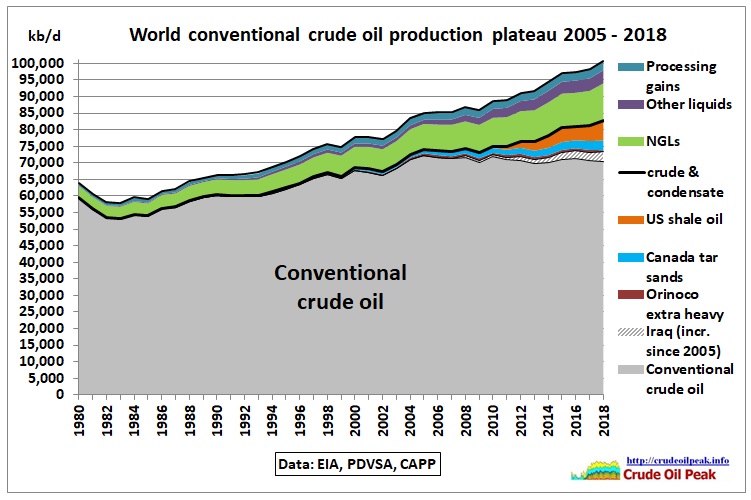
Fig 16: Conventional crude production plus unconventionals and other liquids
Summary:
In the last 4 years, conventional crude production was just 1 mb/d higher than in 2005. This was mainly an increase from Iraq (which was 2.7 mb/d).


