Some people would argue that 2016 was the year that the world economy started to come apart, with the passage of Brexit and the election of Donald Trump. Whether or not the “coming apart” process started in 2016, in my opinion we are going to see many more steps in this direction in 2017. Let me explain a few of the things I see.
[1] Many economies have collapsed in the past. The world economy is very close to the turning point where collapse starts in earnest.
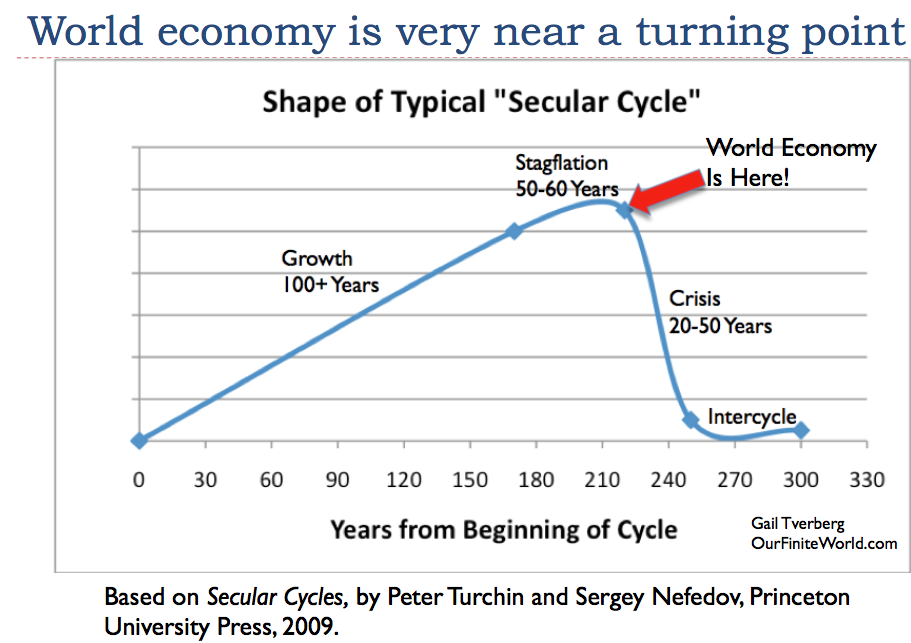
Figure 1
The history of previous civilizations rising and eventually collapsing is well documented.(See, for example, Secular Cycles.)
To start a new cycle, a group of people would find a new way of doing things that allowed more food and energy production (for instance, they might add irrigation, or cut down trees for more land for agriculture). For a while, the economy would expand, but eventually a mismatch would arise between resources and population. Either resources would fall too low (perhaps because of erosion or salt deposits in the soil), or population would rise too high relative to resources, or both.
Even as resources per capita began falling, economies would continue to have overhead expenses, such as the need to pay high-level officials and to fund armies. These overhead costs could not easily be reduced, and might, in fact, grow as the government attempted to work around problems. Collapse occurred because, as resources per capita fell (for example, farms shrank in size), the earnings of workers tended to fall. At the same time, the need for taxes to cover what I am calling overhead expenses tended to grow. Tax rates became too high for workers to earn an adequate living, net of taxes. In some cases, workers succumbed to epidemics because of poor diets. Or governments would collapse, from lack of adequate tax revenue to support them.
Our current economy seems to be following a similar pattern. We first used fossil fuels to allow the population to expand, starting about 1800. Things went fairly well until the 1970s, when oil prices started to spike. Several workarounds (globalization, lower interest rates, and more use of debt) allowed the economy to continue to grow. The period since 1970 might be considered a period of “stagflation.” Now the world economy is growing especially slowly. At the same time, we find ourselves with “overhead” that continues to grow (for example, payments to retirees, and repayment of debt with interest). The pattern of past civilizations suggests that our civilization could also collapse.
Historically, economies have taken many years to collapse; I show a range of 20 to 50 years in Figure 1. We really don’t know if collapse would take that long now. Today, we are dependent on an international financial system, an international trade system, electricity, and the availability of oil to make our vehicles operate. It would seem as if this time collapse could come much more quickly.
With the world economy this close to collapse, some individual countries are even closer to collapse. This is why we can expect to see sharp downturns in the fortunes of some countries. If contagion is not too much of a problem, other countries may continue to do fairly well, even as individual small countries fail.
[2] Figures to be released in 2017 and future years are likely to show that the peak in world coal consumption occurred in 2014. This is important, because it means that countries that depend heavily on coal, such as China and India, can expect to see much slower economic growth, and more financial difficulties.
While reports of international coal production for 2016 are not yet available, news articles and individual country data strongly suggest that world coal production is past its peak. The IEA also reports a substantial drop in coal production for 2016.
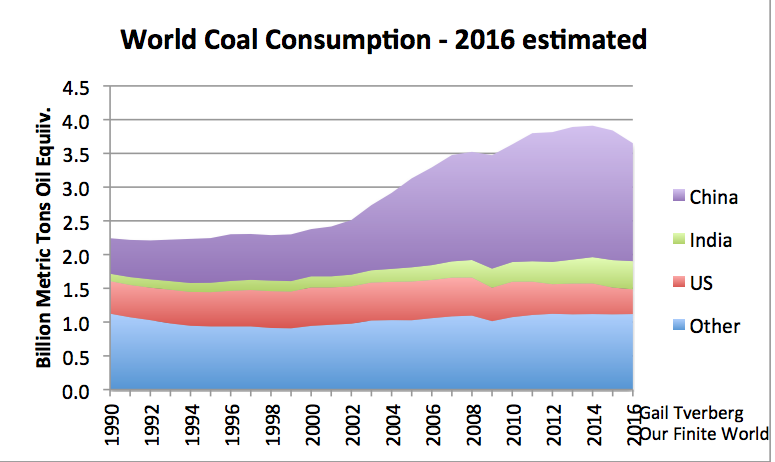
Figure 2. World coal consumption. Information through 2015 based on BP 2016 Statistical Review of World Energy data. Estimates for China, US, and India are based on partial year data and news reports. 2016 amount for “other” estimated based on recent trends.
The reason why coal production is dropping is because of low prices, low profitability for producers, and gluts indicating oversupply. Also, comparisons of coal prices with natural gas prices are inducing switching from coal to natural gas. The problem, as we will see later, is that natural gas prices are also artificially low, compared to the cost of production, So the switch is being made to a different type of fossil fuel, also with an unsustainably low price.
Prices for coal in China have recently risen again, thanks to the closing of a large number of unprofitable coal mines, and a mandatory reduction in hours for other coal mines. Even though prices have risen, production may not rise to match the new prices. One article reports:
. . . coal companies are reportedly reluctant to increase output as a majority of the country’s mines are still losing money and it will take time to recoup losses incurred in recent years.
Also, a person can imagine that it might be difficult to obtain financing, if coal prices have only “sort of” recovered.
I wrote last year about the possibility that coal production was peaking. This is one chart I showed, with data through 2015. Coal is the second most utilized fuel in the world. If its production begins declining, it will be difficult to offset the loss of its use with increased use of other types of fuels.
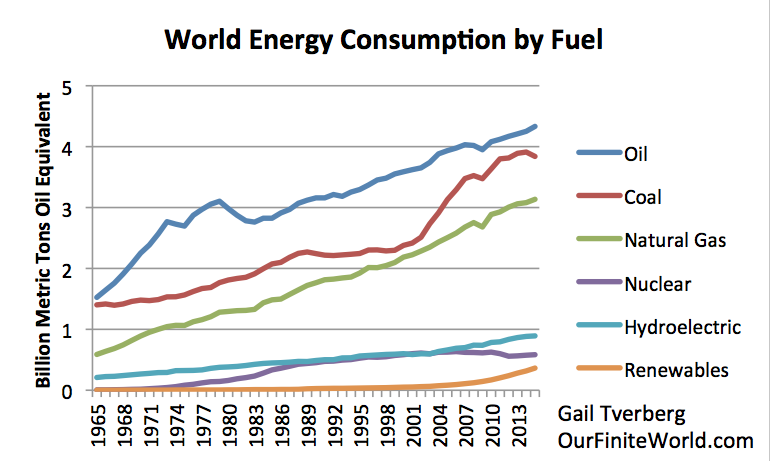
Figure 3. World per capita energy consumption by fuel, based on BP 2016 SRWE.
[3] If we assume that coal supplies will continue to shrink, and other production will grow moderately, we can expect total energy consumption to be approximately flat in 2017.
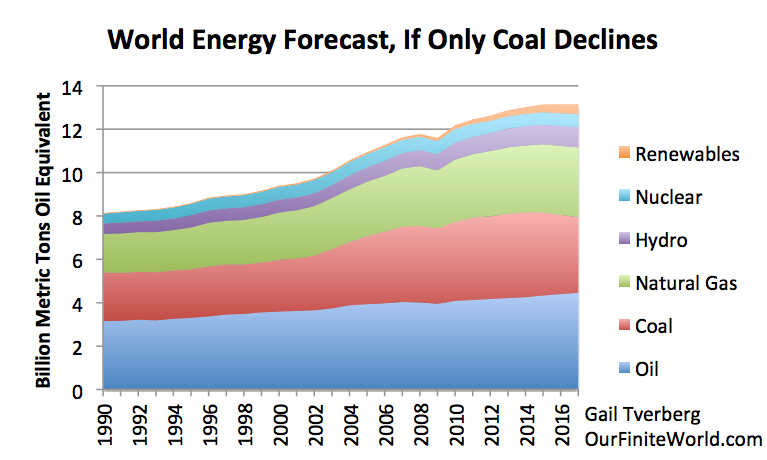
Figure 4. World energy consumption forecast, based on BP Statistical Review of World Energy data through 2015, and author’s estimates for 2016 and 2017.
In a way, this is an optimistic assessment, because we know that efforts are underway to reduce oil production, in order to prop up prices. We are, in effect, assuming either that (a) oil prices won’t really rise, so that oil consumption will grow at a rate similar to that in the recent past or (b) while oil prices will rise significantly to help producers, consumers won’t cut back on their consumption in response to the higher prices.
[4] Because world population is rising, the forecast in Figure 4 suggests that per capita energy consumption is likely to shrink. Shrinking energy consumption per capita puts the world (or individual countries in the world) at the risk of recession.
Figure 5 shows indicated per capita energy consumption, based on Figure 4. It is clear that energy consumption per capita has already started shrinking, and is expected to shrink further. The last time that happened was in the Great Recession of 2007-2009.
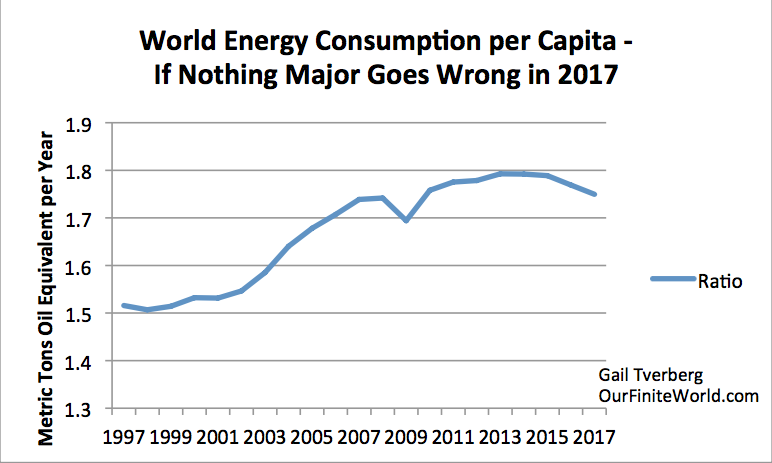
Figure 5. World energy consumption per capita based on energy consumption estimates in Figure 4 and UN 2015 Medium Population Growth Forecast.
There tends to be a strong correlation between world economic growth and world energy consumption, because energy is required to transform materials into new forms, and to transport goods from one place to another.
In the recent past, the growth in GDP has tended to be a little higher than the growth in the use of energy products. One reason why GDP growth has been a percentage point or two higher than energy consumption growth is because, as economies become richer, citizens can afford to add more services to the mix of goods and services that they purchase (fancier hair cuts and more piano lessons, for example). Production of services tends to use proportionately less energy than creating goods does; as a result, a shift toward a heavier mix of services tends to lead to GDP growth rates that are somewhat higher than the growth in energy consumption.
A second reason why GDP growth has tended to be a little higher than growth in energy consumption is because devices (such as cars, trucks, air conditioners, furnaces, factory machinery) are becoming more efficient. Growth in efficiency occurs if consumers replace old inefficient devices with new more efficient devices. If consumers become less wealthy, they are likely to replace devices less frequently, leading to slower growth in efficiency. Also, as we will discuss later in this post, recently there has been a tendency for fossil fuel prices to remain artificially low. With low prices, there is little financial incentive to replace an old inefficient device with a new, more efficient device. As a result, new purchases may be bigger, offsetting the benefit of efficiency gains (purchasing an SUV to replace a car, for example).
Thus, we cannot expect that the past pattern of GDP growing a little faster than energy consumption will continue. In fact, it is even possible that the leveraging effect will start working the “wrong” way, as low fossil fuel prices induce more fuel use, not less. Perhaps the safest assumption we can make is that GDP growth and energy consumption growth will be equal. In other words, if world energy consumption growth is 0% (as in Figure 4), world GDP growth will also be 0%. This is not something that world leaders would like at all.
The situation we are encountering today seems to be very similar to the falling resources per capita problem that seemed to push early economies toward collapse in [1]. Figure 5 above suggests that, on average, the paychecks of workers in 2017 will tend to purchase fewer goods and services than they did in 2016 and 2015. If governments need higher taxes to fund rising retiree costs and rising subsidies for “renewables,” the loss in the after-tax purchasing power of workers will be even greater than Figure 5 suggests.
[5] Because many countries are in this precarious position of falling resources per capita, we should expect to see a rise in protectionism, and the addition of new tariffs.
Clearly, governments do not want the problem of falling wages (or rather, falling goods that wages can buy) impacting their countries. So the new game becomes, “Push the problem elsewhere.”
In economic language, the world economy is becoming a “Zero-sum” game. Any gain in the production of goods and services by one country is a loss to another country. Thus, it is in each country’s interest to look out for itself. This is a major change from the shift toward globalization we have experienced in recent years. China, as a major exporter of goods, can expect to be especially affected by this changing view.
[6] China can no longer be expected to pull the world economy forward.
China’s economic growth rate is likely to be lower, for many reasons. One reason is the financial problems of coal mines, and the tendency of coal production to continue to shrink, once it starts shrinking. This happens for many reasons, one of them being the difficulty in obtaining loans for expansion, when prices still seem to be somewhat low, and the outlook for the further increases does not appear to be very good.
Another reason why China’s economic growth rate can be expected to fall is the current overbuilt situation with respect to apartment buildings, shopping malls, factories, and coal mines. As a result, there seems to be little need for new buildings and operations of these types. Another reason for slower economic growth is the growing protectionist stance of trade partners. A fourth reason is the fact that many potential buyers of the goods that China is producing are not doing very well economically (with the US being a major exception). These buyers cannot afford to increase their purchases of imports from China.
With these growing headwinds, it is quite possible that China’s total energy consumption in 2017 will shrink. If this happens, there will be downward pressure on world fossil fuel prices. Oil prices may fall, despite production cuts by OPEC and other countries.
China’s slowing economic growth is likely to make its debt problem harder to solve. We should not be too surprised if debt defaults become a more significant problem, or if the yuan falls relative to other currencies.
India, with its recent recall of high denomination currency, as well as its problems with low coal demand, is not likely to be a great deal of help aiding the world economy to grow, either. India is also a much smaller economy than China.
[7] While Item [2] talked about peak coal, there is a very significant chance that we will be hitting peak oil and peak natural gas in 2017 or 2018, as well.
If we look at historical prices, we see that the prices of oil, coal and natural gas tend to rise and fall together.
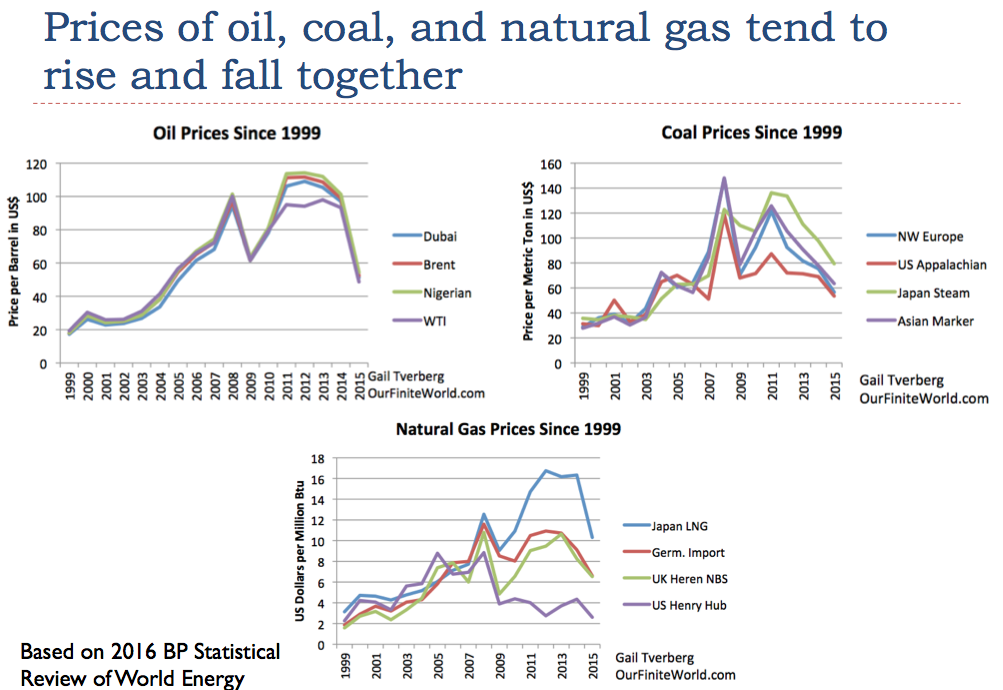
Figure 6. Prices of oil, coal and natural gas tend to rise and fall together. Prices based on 2016 Statistical Review of World Energy data.
The reason that fossil fuel prices tend to rise and fall together is because these prices are tied to “demand” for goods and services in general, such as for new homes, cars, and factories. If wages are rising rapidly, and debt is rising rapidly, it becomes easier for consumers to buy goods such as homes and cars. When this happens, there is more “demand” for the commodities used to make and operate homes and cars. Prices for commodities of many types, including fossil fuels, tend to rise, to enable more production of these items.
Of course, the reverse happens as well. If workers become poorer, or debt levels shrink, it becomes harder to buy homes and cars. In this case, commodity prices, including fossil fuel prices, tend to fall. Thus, the problem we saw above in [2] for coal would be likely to happen for oil and natural gas, as well, because the prices of all of the fossil fuels tend to move together. In fact, we know that current oil prices are too low for oil producers. This is the reason why OPEC and other oil producers have cut back on production. Thus, the problem with overproduction for oil seems to be similar to the overproduction problem for coal, just a bit delayed in timing.
In fact, we also know that US natural gas prices have been very low for several years, suggesting another similar problem. The United States is the single largest producer of natural gas in the world. Its natural gas production hit a peak in mid 2015, and production has since begun to decline. The decline comes as a response to chronically low prices, which make it unprofitable to extract natural gas. This response sounds similar to China’s attempted solution to low coal prices.
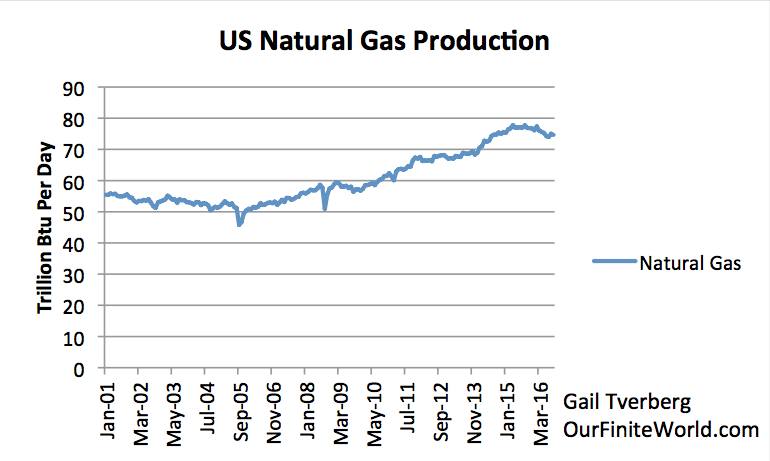
Figure 7. US Natural Gas production based on EIA data.
The problem is fundamentally the fact that consumers cannot afford goods made using fossil fuels of any type, if prices actually rise to the level producers need, which tends to be at least five times the 1999 price level. (Note peak price levels compared to 1999 level on Figure 6.) Wages have not risen by a factor of five since 1999, so paying the prices that fossil fuel producers need for profitability and growing production is out of the question. No amount of added debt can hide this problem. (While this reference is to 1999 prices, the issue really goes back much farther, to prices before the price spikes of the 1970s.)
US natural gas producers also have plans to export natural gas to Europe and elsewhere, as liquefied natural gas (LNG). The hope, of course, is that a large amount of exports will raise US natural gas prices. Also, the hope is that Europeans will be able to afford the high-priced natural gas shipped to them. Unless someone can raise the wages of both Europeans and Americans, I would not count on LNG prices actually rising to the level needed for profitability, and staying at such a high level. Instead, they are likely to bounce up, and quickly drop back again.
[8] Unless oil prices rise very substantially, oil exporters will find themselves exhausting their financial reserves in a very short time (perhaps a year or two). Unfortunately, oil importers cannot withstand higher prices, without going into recession.
We have a no win situation, no matter what happens. This is true with all fossil fuels, but especially with oil, because of its high cost and thus necessarily high price. If oil prices stay at the same level or go down, oil exporters cannot get enough tax revenue, and oil companies in general cannot obtain enough funds to finance the development of new wells and payment of dividends to shareholders. If oil prices do rise by a very large amount for very long, we are likely headed into another major recession, with many debt defaults.
[9] US interest rates are likely to rise in the next year or two, whether or not this result is intended by the Federal reserve.
This issue here is somewhat obscure. The issue has to do with whether the United States can find foreign buyers for its debt, often called US Treasuries, and the interest rates that the US needs to pay on this debt. If buyers are very plentiful, the interest rates paid by he US government can be quite low; if few buyers are available, interest rates must be higher.
Back when Saudi Arabia and other oil exporters were doing well financially, they often bought US Treasuries, as a way to retain the benefit of their new-found wealth, which they did not want to spend immediately. Similarly, when China was doing well as an exporter, it often bought US Treasuries, as a way retaining the wealth it gained from exports, but didn’t yet need for purchases.
When these countries bought US Treasuries, there were several beneficial results:
- Interest rates on US Treasuries tended to stay artificially low, because there was a ready market for its debt.
- The US could afford to import high-priced oil, because the additional debt needed to buy the oil could easily be sold (to Saudi Arabia and other oil producing nations, no less).
- The US dollar tended to stay lower relative to other currencies, making oil more affordable to other countries than it otherwise might be.
- Investment in countries outside the US was encouraged, because debt issued by these other countries tended to bear higher interest rates than US debt. Also, relatively low oil prices in these countries (because of the low level of the dollar) tended to make investment profitable in these countries.
The effect of these changes was somewhat similar to the US having its own special Quantitative Easing (QE) program, paid for by some of the counties with trade surpluses, instead of by its central bank. This QE substitute tended to encourage world economic growth, for the reasons mentioned above.
Once the fortunes of the countries that used to buy US Treasuries changes, the pattern of buying of US Treasuries tends to change to selling of US Treasuries. Even not purchasing the same quantity of US Treasuries as in the past becomes an adverse change, if the US has a need to keep issuing US Treasuries as in the past, or if it wants to keep rates low.
Unfortunately, losing this QE substitute tends to reverse the favorable effects noted above. One effect is that the dollar tends to ride higher relative to other currencies, making the US look richer, and other countries poorer. The “catch” is that as the other countries become poorer, it becomes harder for them to repay the debt that they took out earlier, which was denominated in US dollars.
Another problem, as this strange type of QE disappears, is that the interest rates that the US government needs to pay in order to issue new debt start rising. These higher rates tend to affect other rates as well, such as mortgage rates. These higher interest rates act as a drag on the economy, tending to push it toward recession.
Higher interest rates also tend to decrease the value of assets, such as homes, farms, outstanding bonds, and shares of stock. This occurs because fewer buyers can afford to buy these goods, with the new higher interest rates. As a result, stock prices can be expected to fall. Prices of homes and of commercial buildings can also be expected to fall. The value of bonds held by insurance companies and banks becomes lower, if they choose to sell these securities before maturity.
Of course, as interest rates fell after 1981, we received the benefit of falling interest rates, in the form of rising asset prices. No one ever stopped to think about how much of the gains in share prices and property values came from falling interest rates.
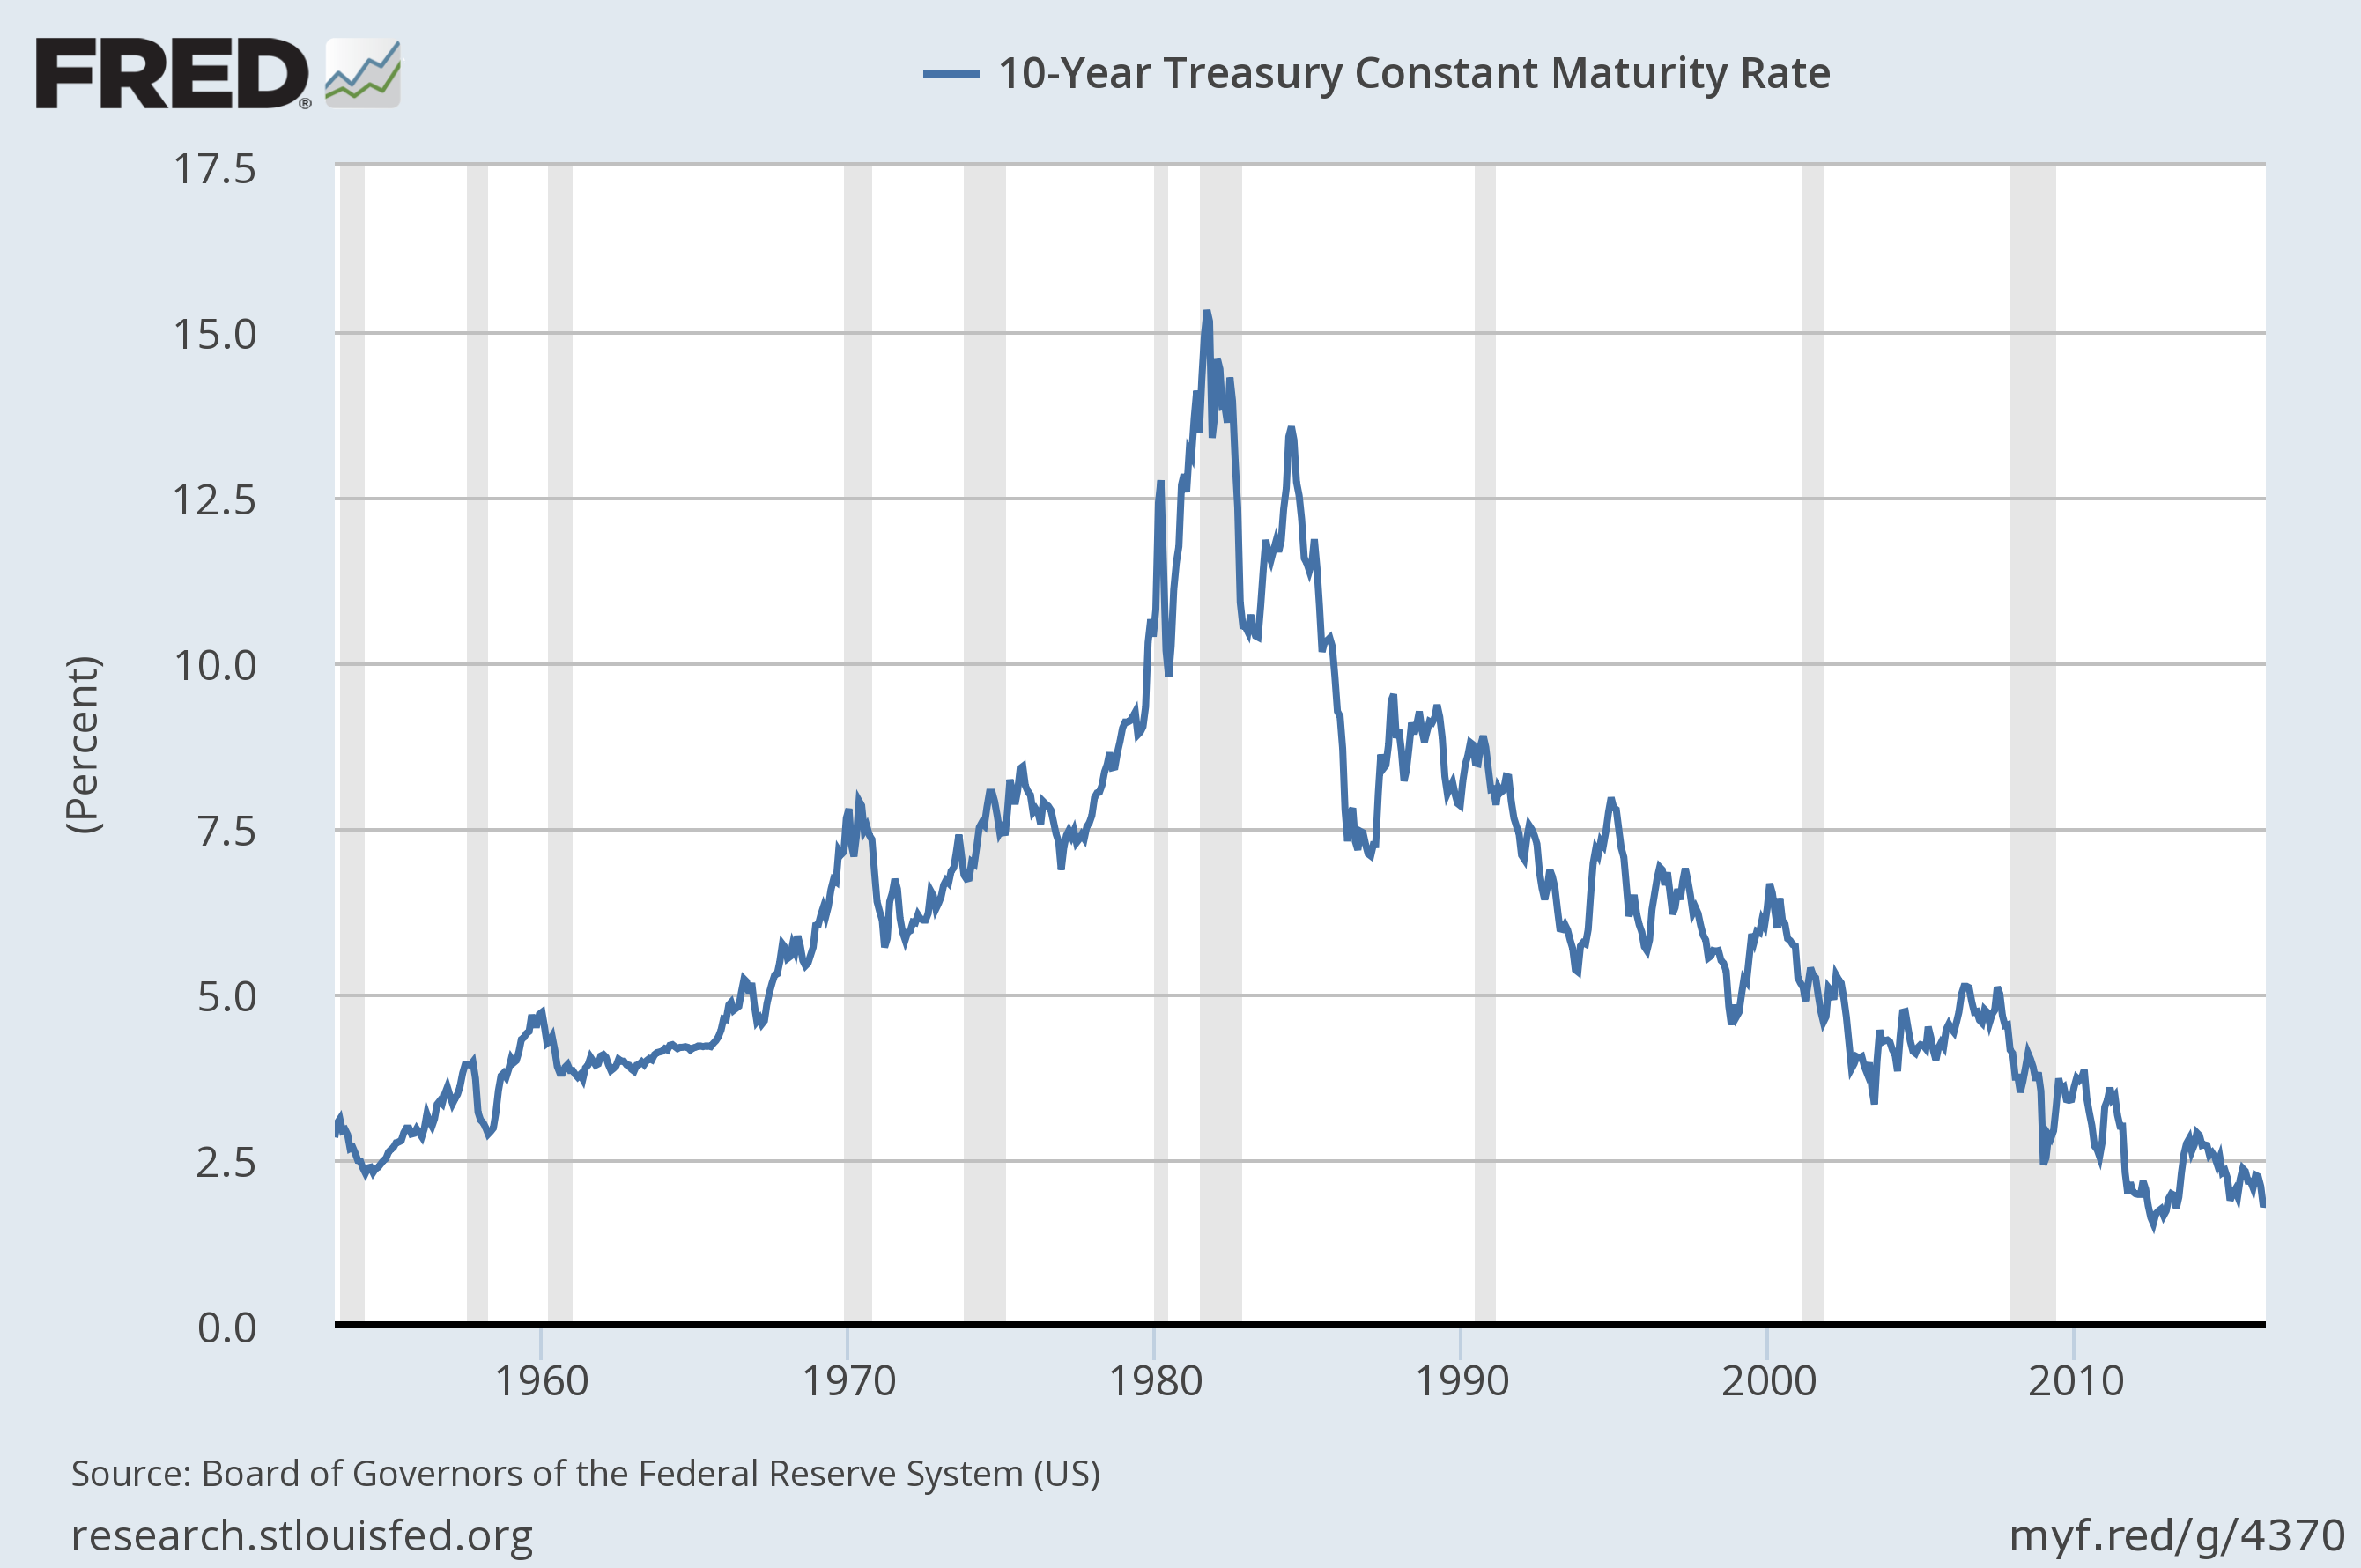
Figure 8. Ten year treasury interest rates, based on St. Louis Fed data.
Now, as interest rates rise, we can expect asset prices of many types to start falling, because of lower affordability when monthly payments are based on higher interest rates. This situation presents another “drag” on the economy.
In Conclusion
The situation is indeed very concerning. Many things could set off a crisis:
- Rising energy prices of any kind (hurting energy importers), or energy prices that don’t rise (leading to financial problems or collapse of exporters)
- Rising interest rates.
- Defaulting debt, indirectly the result of slow/negative economic growth and rising interest rates.
- International organizations with less and less influence, or that fall apart completely.
- Fast changes in relativities of currencies, leading to defaults on derivatives.
- Collapsing banks, as debt defaults rise.
- Falling asset prices (homes, farms, commercial buildings, stocks and bonds) as interest rates rise, leading to many debt defaults.
Things don’t look too bad right now, but the underlying problems are sufficiently severe that we seem to be headed for a crisis far worse than 2008. The timing is not clear. Things could start falling apart badly in 2017, or alternatively, major problems may be delayed until 2018 or 2019. I hope political leaders can find ways to keep problems away as long as possible, perhaps with more rounds of QE. Our fundamental problem is the fact that neither high nor low energy prices are now able to keep the world economy operating as we would like it to operate. Increased debt can’t seem to fix the problem either.
The laws of physics seem to be behind economic growth. From a physics point of view, our economy is a dissipative structure. Such structures form in “open systems.” In such systems, flows of energy allow structures to temporarily self-organize and grow. Other examples of dissipative structures include ecosystems, all plants and animals, stars, and hurricanes. All of these structures constantly “dissipate” energy. They have finite life spans, before they eventually collapse. Often, new dissipative systems form, to replace previous ones that have collapsed.
The one thing that gives me hope is the fact that there seems to be some type of a guiding supernatural force behind the whole system that allows so much growth. Some would say that this supernatural force is “only” the laws of physics (and biology and chemistry). To me, the fact that so many structures can self-organize and grow is miraculous, and perhaps evidence of a guiding force behind the whole universe.
I don’t know precisely what is next, but it seems quite possible that there is a longer-term plan for humans that we are not aware of. Some of the religions of the world may have insights on what this plan might be. It is even possible that there may be divine intervention of some type that allows a change in the path that we seem to be on today.