Oil production can be confusing because there are various “pieces” that may or may not be included. In this analysis, I look at oil production of the United States broadly (including crude oil, natural gas plant liquids, and biofuels), because this is the way oil consumption is defined. I also provide some thoughts regarding the direction of future world oil prices.

Figure 1. US Liquid Fuels production by month based on EIA March 2016 Monthly Energy Review Reports.
US oil production clearly flattened out in 2015. If we look at changes relative to the same month, one-year prior, we see that as of December 2014, growth was very high, increasing by 18.0% relative to the prior year.

Figure 2. US Liquids Growth Over 12 Months Prior based on EIA’s March 2016 Monthly Energy Review.
By December 2015, growth over the prior year finally turned slightly negative, with production for the month down 0.2% relative to one year prior. It should be noted that in the above charts, amounts are on an “energy produced” or “British Thermal Units” (Btu) basis. Using this approach, ethanol and natural gas liquids get less credit than they would using a barrels-per-day approach. This reflects the fact that these products are less energy-dense.
Figure 3 shows the trend in month-by-month production.

Figure 3. US total liquids production since January 2013, based on EIA’s March 2016 Monthly Energy Review.
The high month for production was April 2015, and production has been down since then. The production of natural gas liquids and biofuels has tended to continue to rise, partially offsetting the fall in crude oil production. Production amounts for recent months include estimates, and actual amounts may differ from these estimates. As a result, updated EIA data may eventually show a somewhat different pattern.
Taking a longer view of US liquids production, this is what we see for the three categories separately:

Figure 4. US Liquid Fuel Production since 1949, based on EIA’s March 2016 Monthly Energy Review.
Growth in US liquid fuel production slowed in 2015. The increase in liquid fuels production in 2015 amounted to 1.96 quadrillion Btus (“quads”), or about 59% as much as the increase in production in 2014 of 3.34 quads. On a barrels-per-day (bpd) basis, this would equate to roughly a 1.0 million bpd increase in 2015, compared to a 1.68 million bpd increase in 2014.
The data in Figure 4 indicates that with all categories included, 2015 liquids exceeded the 1970 peak by 16%. Considering crude oil alone, 2015 production amounted to 98% of the 1970 peak.
Figure 5 shows an approximate breakdown of crude oil production since 1945 on a bpd basis. The big spike in production is from tight oil, which is another name for oil from shale.
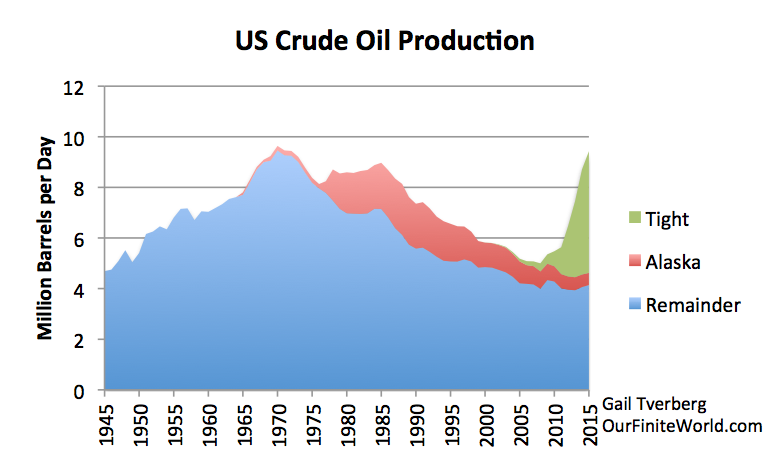
Figure 5. Oil crude oil production separated into tight oil (from shale), oil from Alaska, and all other, based on EIA oil production data by state.
Here again, US crude oil production in 2015 appears to amount to 98% of the 1970 crude oil peak. Thus, on a crude oil basis alone, we have not yet hit the 1970 peak.
Prospects for an Oil Price Rise
Most recent analyses of oil prices have focused on the amount of mismatch between supply and demand, and the need to craft a temporary agreement to reduce oil production. The thing that is missing in this discussion is an analysis of buying power of consumers. Is the problem a temporary problem, or a permanent one?
In order for oil product demand to keep rising, the buying power of consumers needs to keep rising. In other words, some combination of consumer wages and debt levels of consumers needs to keep rising. (Rising debt is helpful because, with more debt, it is often possible to buy goods that would not otherwise be affordable.)
We know that in many countries, wages for lower-level workers have stagnated for a number of reasons, including competition with wages in lower-wage countries, computerization, and the use of automation (Figure 6). Thus, we know that low wages for a large share of consumers may be a problem.
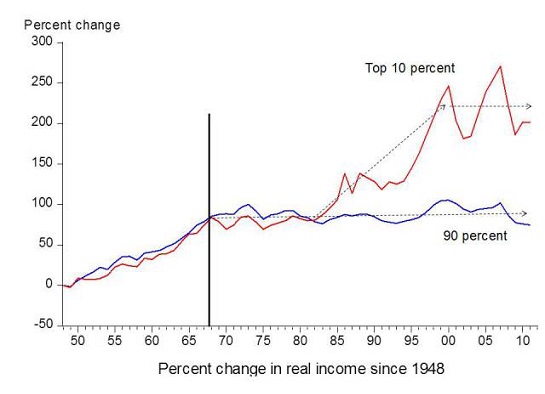
Figure 6. Chart comparing US income gains by the top 10% to income gains by the bottom 90% by economist Emmanuel Saez. Based on an analysis IRS data, published in Forbes.
Figure 7 shows that world debt has been falling since June 30, 2014. This is precisely the time when world oil prices started falling.
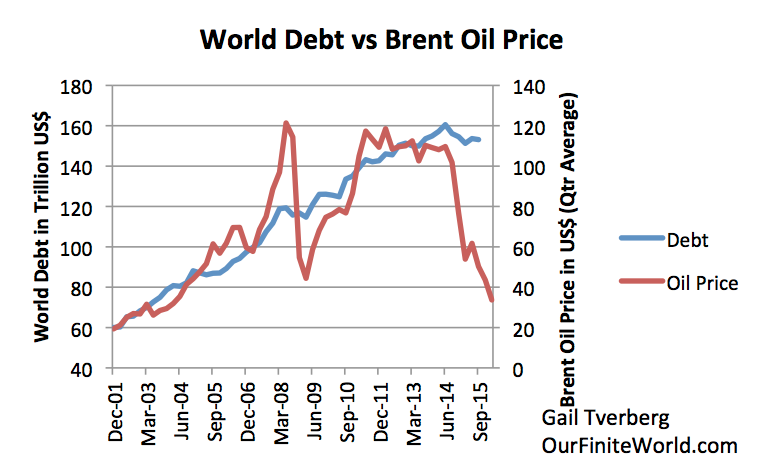
Figure 7. Total non-financial world debt based on Bank for International Settlements data and average Brent oil price for the quarter, based on EIA data.
One reason for the fall in world debt, measured in US dollars, is the fact that the US dollar started rising relative to other currencies about this time. Oil is priced in dollars; if the US dollar rises relative to other currencies, it makes oil less affordable to those whose currencies have lower values. The big rise in the level of the dollar came when the US discontinued quantitative easing in 2014. World debt, as measured in US dollars, began to fall as the US dollar rose.
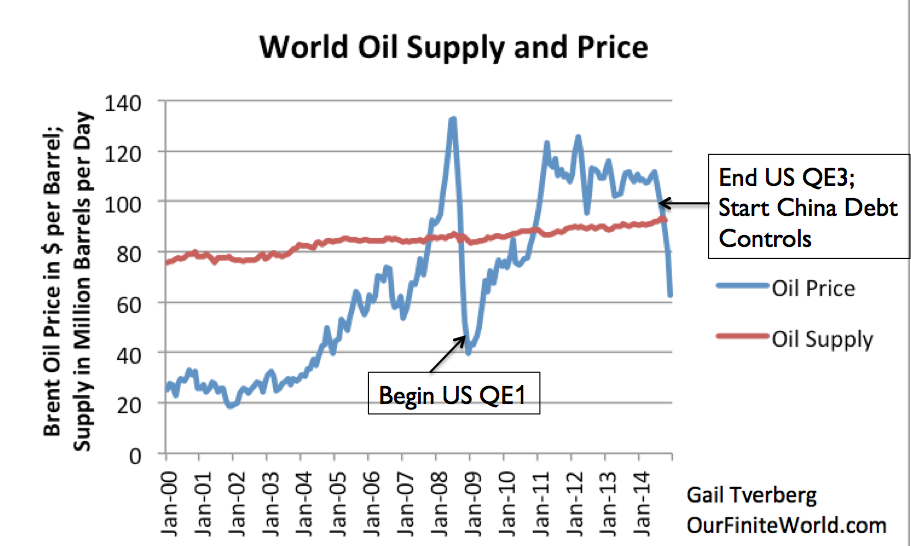
Figure 8. World Oil Supply (production including biofuels, natural gas liquids) and Brent monthly average spot prices, based on EIA data.
As long as the US dollar is high relative to other currencies, oil products remain less affordable, and demand tends to stay low.
Another issue that struck me in looking at world debt data is the way the growth in debt is distributed (Figure 9). Debt growth for households has been much lower than for businesses and governments.

Figure 9. World non-financial debt divided among debt of households, businesses, and governments, based on Bank for International Settlements data.
Since March 31, 2008, non-financial debt of households has been close to flat. In fact, between June 30, 2014 and September 30, 2015, it shrank by 6.3%. In contrast, non-financial debt of both businesses and governments has risen since March 31, 2008. Government debt has shrunk by 5.6% since June 30, 2014–almost as large a percentage drop as for household debt.
The issue that we need to be aware of is that consumers are the foundation of the economy. If their wages are not rising rapidly, and if their buying power (considering both debt and wages) is not rising by very much, they are not going to be buying very many new houses and cars–the big products that require oil consumption. Businesses may think that they can continue to grow without taking the consumer along, but very soon this growth proves to be a myth. Governments cannot grow without rising wages either, because the majority of their tax revenue comes from individuals, rather than corporations.
Today, there is a great deal of faith that oil prices will rise, if someone, somewhere, will reduce oil production. In fact, in order to bring oil demand back up to a level that commands a price over $100 per barrel, we need consumers who can afford to buy a growing quantity of goods made with oil products. To do this, we need to fix three related problems:
- Low wages of many consumers
- World debt that is no longer rising (especially for consumers)
- A high dollar relative to other currencies
These problems are likely to be difficult to fix, so we should expect low oil prices, more or less indefinitely. Lack of oil supply may bring a temporary spike in oil prices, but it cannot fix a permanent problem with consumer spending around the world.