The rapid growth in global carbon dioxide emissions over the last decade appears to have stalled, a new study says. Early estimates suggest that global emissions will decrease by 0.6% this year, following a small increase of 0.6% in 2014.
The break in the emissions trend is mainly down to a drop in coal use in China, the study says, which drives a projected decrease in Chinese emissions of around 4% compared to 2014.
However, this is unlikely to signal a peak in global emissions just yet, the researchers say.
Stalled emissions
Last month, the World Meteorological Organisation (WMO) announced that the concentration of CO2 in the Earth’s atmosphere passed 400 parts per million (ppm) in spring this year.
This is an increase from around 280ppm since the industrial revolution began, and is higher than at any time in the last 800,000 years.
Humans continue to add more CO2 to the atmosphere through burning fossil fuels and industrial processes such as cement production.
But the new study, just published in Nature Climate Change, suggests that the increase in these emissions has slowed in the last two years. You can see from the circles in the chart below that the rapid rise in global emissions since the early 2000s has tailed off in 2014 and 2015.
Also in the chart, the squares show that emissions intensity – the amount of carbon dioxide emitted per unit of GDP – has decreased steadily since 1990. This is largely a result of global wealth increasing more quickly than emissions.
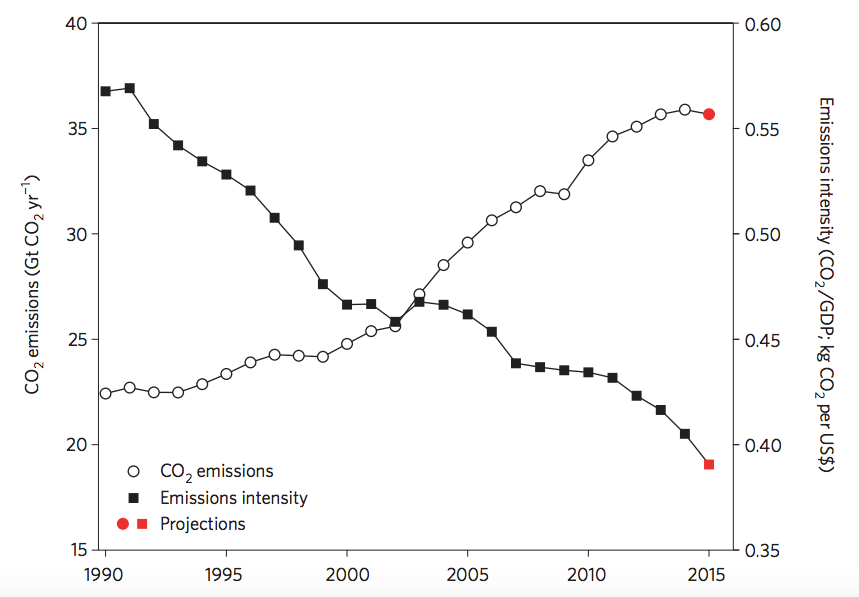
Global CO2 emissions from fossil fuels and industry since 1990 (left-hand axis) and emissions intensity (right-hand axis). Source: Jackson et al. (2015).
Global emissions rose by an average of 2.4% per year between 2004 and 2013, but the last two years marks a break in this growth, the researchers say. As you can see below, global emissions are estimated to have slowed in 2014 to an increase of 0.6%, and have decreased by the same percentage in 2015.
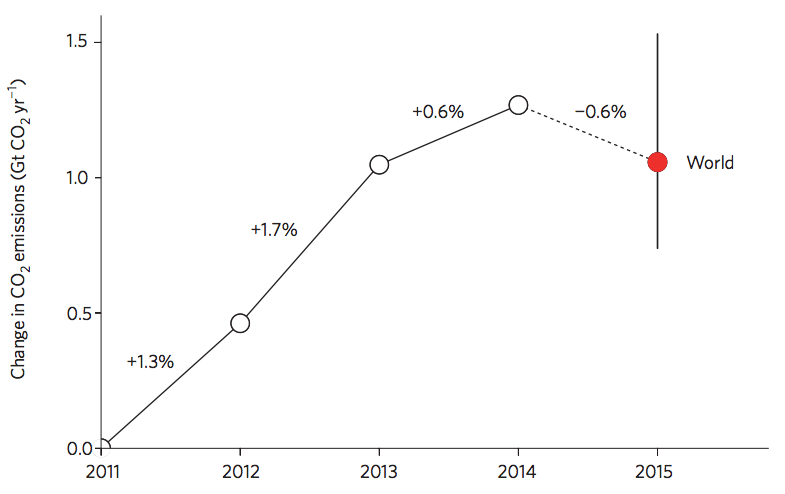
Yearly changes in global CO2 emissions from fossil fuel use and industry since 2011. Source: Jackson et al. (2015).
The emissions projection for 2015 is based on data up to August this year, so these figures are only preliminary. However, even the uncertainty range around the 0.6% figure that the study gives – anything from a bigger decrease of 1.6% up to a small increase of 0.5% – suggests that 2015 will still follow 2014 by bucking the rising trend of the past decade.
The study is part of the Global Carbon Project, set up in 2001 to develop a complete picture of the global carbon cycle. Below is an animation the researchers produced to explain their new findings.
Chinese coal consumption
There are several reasons why global emissions seem to have stalled, the researchers say, such as slow growth in use of petrol and rapid growth in renewable energy.
But the main reason is a fall in coal consumption China, the paper says. This is partly down to a more diverse mix of energy sources in China – over half of the increase in energy consumption from 2013 to 2014 came from hydropower, nuclear and other renewables – and a reduction in burning coal in urban areas to try and tackle air pollution.
As lead author Prof Robert Jackson, a senior fellow at Stanford Woods Institute for the Environment, put it at a press conference at the COP21 talks in Paris:
It’s interesting to note that the rapid rise in global emissions in the 2000s coincided with an acceleration of Chinese coal use.
Following increases of 6.7% in the past decade, the growth of China’s CO2 emissions slowed to 1.2% in 2014 and is projected to decline by 3.9% in 2015, the study says. In the chart below you can see the fall in emissions from 2014 to 2015 in China, the EU and the US, and increases in India and the rest of the world.
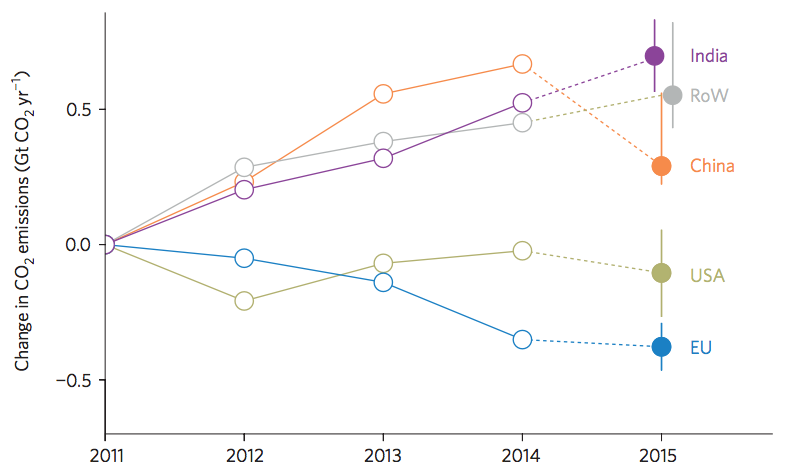
Observed (empty circles) and estimated (filled circles) of yearly changes in CO2 emissions from fossil fuel use and industry since 2011 in India, Rest of the World, China, USA, and the EU. Source: Jackson et al. (2015).
Does a stall mean a peak?
The study isn’t the first to suggest a slowing of global emissions growth. Earlier this year, the International Energy Agency (IEA) announced that worldwide emissions of CO2 had not increased in 2014.
The Nature Climate Change study found a small increase in emissions for 2014 rather than no growth. Its estimate covers a slightly broader range of emissions, including from cement production, and counts emissions in a slightly different way.
But with all this talk of stalling emissions, does this mean global emissions have a hit a peak and are set to decline from here? This is unlikely, says co-author Prof Corinne Le Quéré, professor of climate change science and policy at the University of East Anglia, at the press conference:
This break is unlikely to be the peak in global emissions, and that is because energy needs of growing economies rely still primarily on coal and emission decreases in some industrialised countries are still modest at best.
A global peak is still likely to be at least 15 years away, says co-author Dr Glen Peters, a senior researcher Center for International Climate and Environmental Research (CICERO) in Oslo:
You wouldn’t expect a global peak until 2030 or later – based on the data we have.
Indeed, global emissions growth has stalled in the past before accelerating again, the paper notes – such as during the breakup of the Soviet Union in the early 1990s and as recently as the global financial crisis that began in 2007.
But the flattening off of growth in 2014 and 2014 is different, Le Quéré tells Carbon Brief:
This time we’re seeing two years with either low growth or even possibly a little decrease. But in particular this is happening in the context of very strong global economic growth – more than 3% per year every year.
This shows that cutting CO2 emissions doesn’t have to be to the detriment of the economy, says Prof Myles Allen, director of the Safe Carbon project at the University of Oxford, who wasn’t involved in the study:
Evidence that it is possible to grow the world economy while reducing emissions is of course good news.
But to limit global temperature rise to 2C, emissions have to decline to zero, not just stabilise at zero growth, points out Le Quéré:
So really, maybe it’s encouraging that we’re seeing a stalling in emissions now, but that drivers underneath remain for growth, so we really need to put the elements in place so that the emissions start going in the other direction.
Regions of change
One of the main unknowns about when global emissions will eventually peak is India, says Le Quéré:
Emissions in India are now at the same level as China in the 1990s, so we expect in the near future that they could actually eventually dominate global growth [in emissions] in the same way that China has done in the past – unless the development occurs differently.
In 2014, for example, all of the emissions savings in the EU – around 200m tonnes of CO2 – were offset by increases in India. And India will soon overtake Europe as the third largest emitter of CO2 after China and the US, says Peters:
At current growth rates – the EU going down and India going up – India will emit more than the EU in two, three, maybe four years’ time.
The EU has seen a substantial decline in emissions in recent years, the paper says – averaging 2.4% a year in the past decade, for example. Much of the decrease in the EU emissions since 1990 was because we “outsourced” our emissions to other countries by manufacturing less in Europe and importing more products from overseas. But since 2007 that has changed, says Le Quéré, and both our emissions from within Europe and how much stuff we import has declined:
In the last decade, the [emissions] decreases in the European Union are real.”
A little closer to home, what has happened in the UK specifically?
The UK emitted 0.43bn tonnes of CO2 in 2014, making up 1.2% of the worldwide total. The new study doesn’t have estimates for 2015 yet, but the 2014 data confirms the 9% drop in emissions from 2013 that Carbon Brief estimated in January this year.
Main image: Workers sort out waste rocks from coal on a belt conveyer at a coal mine in Huaibei city, east China’s Anhui province, 12 May 2015. © Imaginechina/Corbis./p>
Jackson, R. B. et al. (2015) Reaching peak emissions, Nature Climate Change, doi:10.1038/nclimate2892.