NOTE: Images in this archived article have been removed.
On December 3, 2014, Nature published “Natural Gas: The Fracking Fallacy”, which suggested that the forecasts of the Energy Information Administration (EIA) for four major U.S. shale gas plays were wildly optimistic, based on a comparison to forecasts for the same plays by the University of Texas Bureau of Economic Geology (UT/BEG). This was followed by a formal denunciation of the article both by the EIA and UT/BEG, despite the fact that the substance of the article was correct. Arthur Berman provided an excellent overview of the merits—or in this case the lack thereof—of the attack by both of these agencies on what is essentially the reality behind the shale revolution.
The Nature piece steered clear of any discussion of my recent Drilling Deeper report (published by Post Carbon Institute), which looked at twelve major shale gas and tight oil plays accounting for most of U.S. shale production, and which also came to the conclusion that the EIA’s projections were extremely optimistic. Nature focused instead on the four plays described in two published and two unpublished studies by UT/BEG. The Nature article sparked a lot of media attention, which prompted the EIA and UT/BEG to issue rebuttals.
The argument of the EIA and UT/BEG that their projections of shale gas production from the plays mentioned in theNature article are fundamentally similar is untrue, given the publicly available data. The implications of the EIA being wrong on its projections of cheap and abundant gas for decades are considerable, given that investment decisions are now being made based on these projections— including construction of infrastructure for LNG exports, gas-fired generation and even crude oil exports. Hence it is worthwhile to examine the EIA’s optimistic projections in more detail in light of the projections available from UT/BEG and the Drilling Deeper report (DD).
Three Methodologies
The two
published UT/BEG studies are indeed complex, focusing on myriad estimated and measured variables and the development of a tiering of sections utilizing well productivity and other data from which they infer cost of production and future production profiles. They limit the prospective area of a play at the section level and exclude portions of drained and undrained blocks in their analysis. They also determine the number of prospective drilling locations by tier and potential interference between wells which limits downspacing. Production projections are based on price.
The
DD approach is also based on an assessment of all wells in a play. The play area is delimited by productive and non-productive wells, and key fundamentals including well- and field-decline rates, EUR, and first-year production rates. Well quality is determined at the play level and at the county- and partial county-levels. The number of prospective drilling locations is determined from industry and other literature as well as a consideration of surface land use which may limit access to some drilling locations. Production projections are based on assumed drilling rates which in turn are based on price. Drilling is assumed to progress from areas of highest well quality to the well quality of outlying counties as a play is developed.
The EIA uses a system known as the National Energy Modelling System (NEMS) which, although purported to be based on a county level analysis for shale, is complex, is not transparent and its outputs for future shale play production at times defy logic. A statement at the EIA’s
NEMS link says: “Most people who have requested NEMS in the past have found out that it was too difficult or rigid to use.”
The four shale gas plays examined in the Nature article are the Barnett, Fayetteville, Haynesville and Marcellus. Each of these is outlined and compared below. The UT/BEG projections were extended to 2040 using the annual percentage decrease in the final year (2029-2030) to make them comparable to the EIA and DD projections. The data for the UT/BEG and EIA projections are
available here. The DD projections are
available here.
Barnett Play
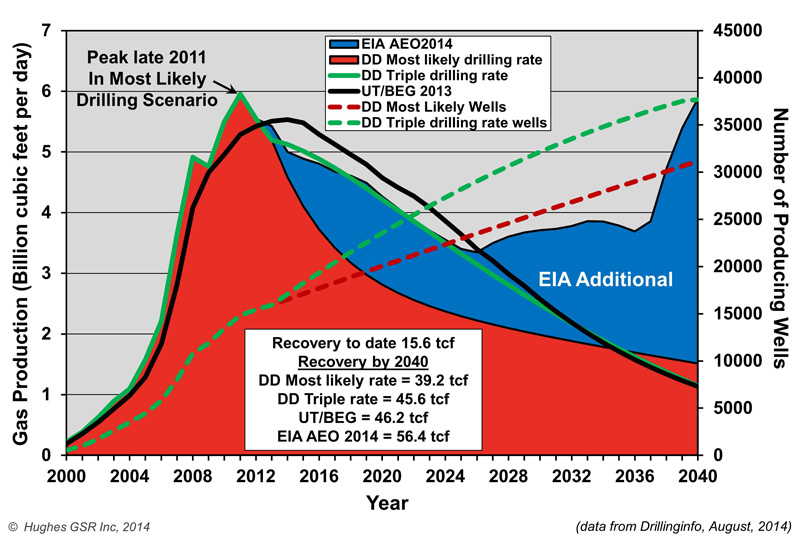
The Barnett Play comparison is illustrated in Figure 1.
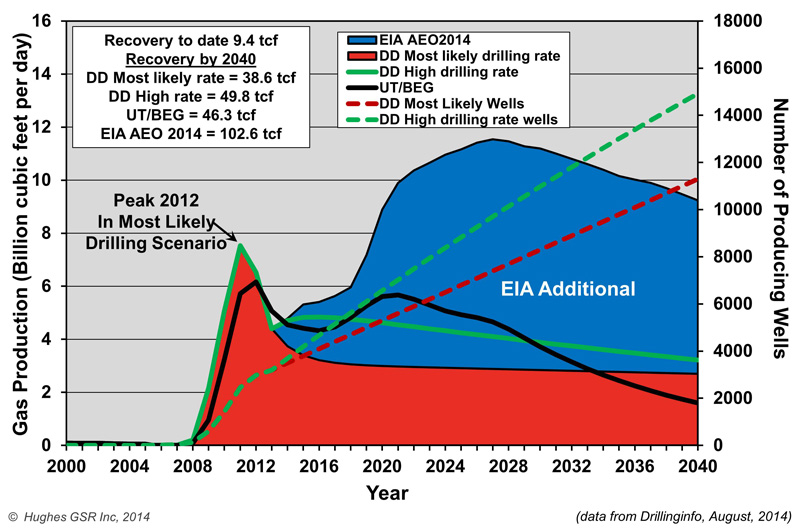
Figure 1 – Comparison of shale gas production projections for the Barnett Play through 2040. Two projections are shown from DD compared to the UT/BEG projection, which assumes reference case natural gas prices in the EIA Annual Energy Outlook 2014 (AEO2014), and the EIA reference case projection from AEO2014.
Historical production data is current to yearend 2010 for the UT/BEG projection, 2012 for the EIA projection and mid-2014 for the DD projections. Drilling rates would have to triple from the current 400 wells/year to 1200 wells/year for the DD projection to match the EIA projection out to 2026 – after that the EIA assumes a bizarre ramp up to the level of the 2011 peak by 2040 for which there is no apparent justification. The UT/BEG projection underestimates historical production and assumes peak production in 2014 whereas production peaked in late 2011 and is now down 18% from peak. UT/BEG also apparently assumes a ramp up to much higher drilling rates to meet its projection after peak.
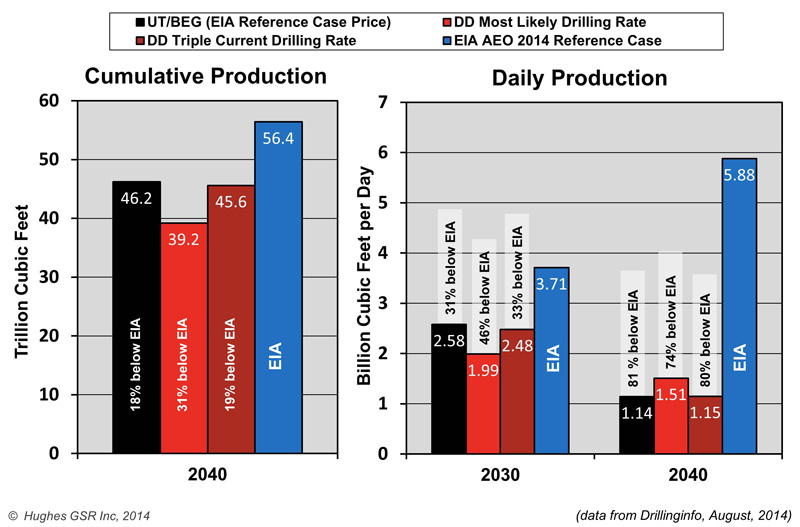
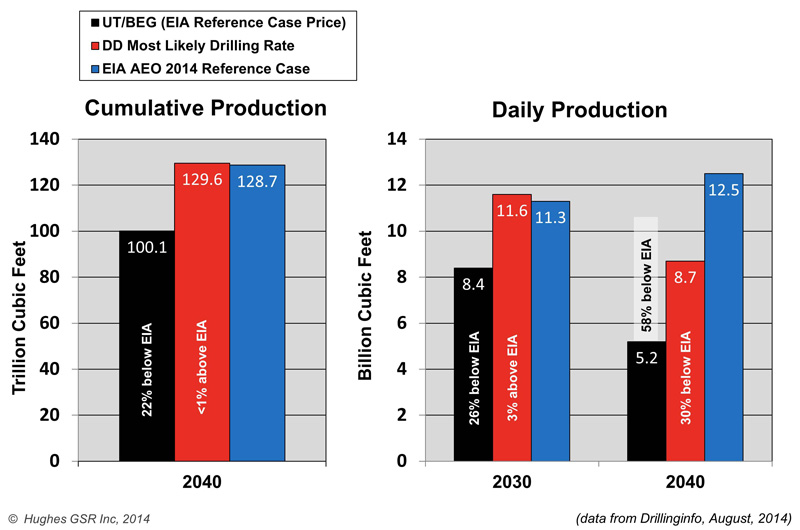
Figure 2 summarizes the EIA overestimates in both cumulative production through 2040 and projected production rates in 2030 and 2040 compared to the other projections. Cumulative production of gas through 2040 is overestimated by the EIA by between 22% and 44%. Daily production in 2030 is overestimated by between 44% and 87%, and daily production in 2040 is overestimated by between 288% and 417%.
Figure 2 – Comparison of cumulative production through 2040 and projected daily production in 2030 and 2040 for four projections for the Barnett Play. The EIA overestimates daily production in 2030 by between 44% and 87%, and daily production in 2040 by between 288% and 417%.
Fayetteville Play
The Fayetteville Play comparison is illustrated in Figure 3.
Figure 3 – Comparison of shale gas production projections for the Fayetteville Play through 2040. The “most likely drilling rate” projection from DD is shown compared to the UT/BEG projection, which assumes reference case natural gas prices in the EIA AEO2014, and the EIA reference case projection from AEO2014.
Historical production data is current to yearend 2011 for the UT/BEG projection, 2012 for the EIA projection and mid-2014 for the DD projection. Both the UT/BEG and EIA projections underestimate production at the 2012 peak but have the timing of peak correct. However the EIA assumes a bizarre ramp up in production, starting in 2014, to nearly double the level of the 2012 peak in 2036, for which there is no apparent justification. The UT/BEG projection assumes a more rapid ramp down of production after peak than DD.
Figure 4 summarizes the EIA overestimates in both cumulative production through 2040 and projected production rates in 2030 and 2040 compared to the other projections. Cumulative production of gas through 2040 is overestimated by the EIA by between 82% and 125%. Daily production in 2030 is overestimated by between 162% and 286%, and daily production in 2040 is overestimated by between 247% and 895%.
Figure 4 – Comparison of cumulative production through 2040 and projected daily production in 2030 and 2040 for three projections for the Fayetteville Play. The EIA overestimates daily production in 2030 by between 162% and 286%, and daily production in 2040 by between 247% and 895%.
Haynesville Play
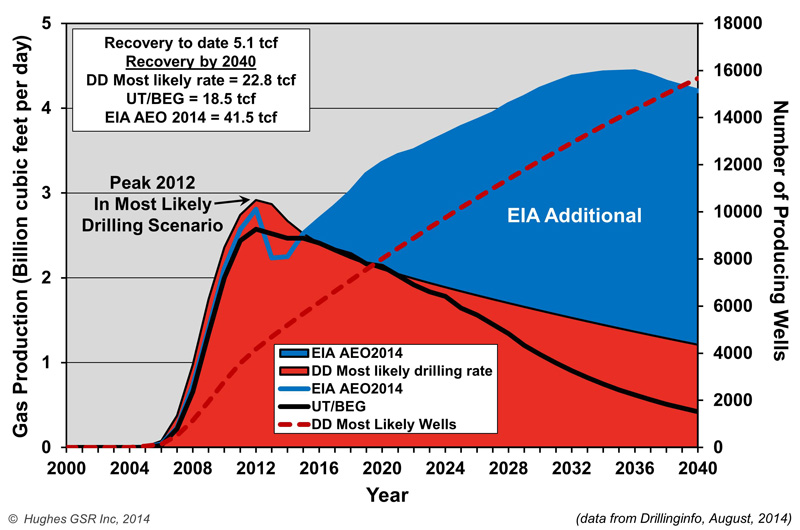
The Haynesville Play comparison is illustrated in Figure 5.
Figure 5 – Comparison of shale gas production projections for the Haynesville Play through 2040. Two projections are shown from DD compared to the UT/BEG projection, which assumes reference case natural gas prices in the EIA Annual Energy Outlook 2014 (AEO2014), and the EIA reference case projection from AEO2014.
Historical production data is likely current to at least yearend 2011 for the UT/BEG projection (vintage is not mentioned in the data source), 2012 for the EIA projection and mid-2014 for the DD projections. Drilling rates for the DD “high drilling rate” projection assume an increase from the current 210 wells/year to 500 wells/year whereas the “most likely drilling rate” assumes an increase to 300 wells/year. The EIA assumes a bizarre production ramp up beginning in 2014 rising to a new peak in 2027 at a level more than 50% higher than the early 2012 peak for which there is no apparent justification. The UT/BEG projection underestimates historical production and production at the 2012 peak but assumes a production rise presumably due to higher drilling rates in the 2020 timeframe followed by a decline to levels considerably lower than any other projection by 2040.
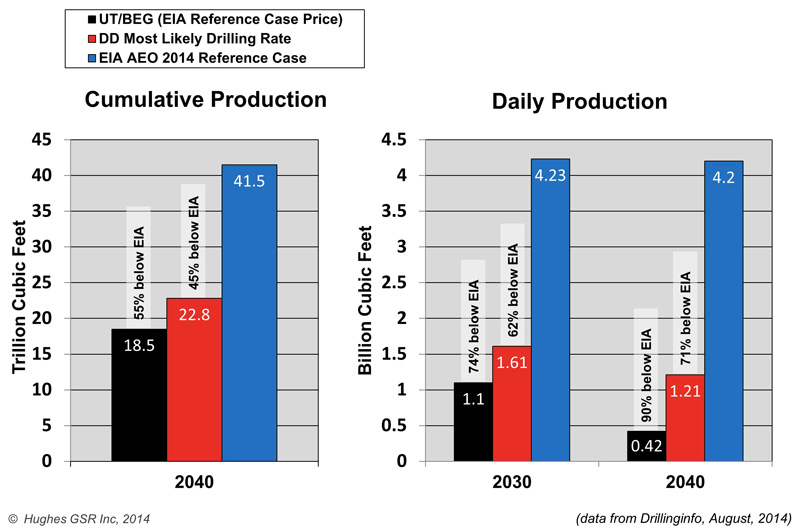
Figure 6 summarizes the EIA overestimates in both cumulative production through 2040 and projected production rates in 2030 and 2040 compared to the other projections. Cumulative production of gas through 2040 is overestimated by the EIA by between 106% and 165%. Daily production in 2030 is overestimated by between 188% and 294%, and daily production in 2040 is overestimated by between 187% and 477%.
Figure 6 – Comparison of cumulative production through 2040 and projected daily production in 2030 and 2040 for four projections for the Haynesville Play. The EIA overestimates daily production in 2030 by between 188% and 294%, and daily production in 2040 by between 187% and 477%.
Marcellus Play
The Marcellus Play comparison is illustrated in Figure 7.
Figure 7 – Comparison of shale gas production projections for the Marcellus Play through 2040. The “most likely drilling rate” projection from DD is shown compared to the UT/BEG projection, which assumes reference case natural gas prices in the EIA AEO2014, and the EIA reference case projection from AEO2014.
Historical production data is likely current to at least yearend 2011 for the UT/BEG projection (vintage is not mentioned in the data source), 2012 for the EIA projection and mid-2014 for the DD projection. Both the UT/BEG and EIA projections seriously underestimate production in the early years of their forecasts. The EIA assumes that production in 2040 will be considerably higher than either of the other projections in 2040. Cumulative recovery of gas by 2040 is similar for both the EIA and DD projections however the UT/BEG projects a considerably lower cumulative production.
Figure 8 summarizes the EIA overestimates in both cumulative production through 2040 and projected production rates in 2030 and 2040 compared to the other projections. The EIA overestimated cumulative production through 2040 by 29% according to UT/BEG. The EIA’s estimate of daily production in 2030 is overestimated by 36% in the UT/BEG projection. EIA daily production in 2040 is overestimated by between 45% and 142%.
Figure 8 – Comparison of cumulative production through 2040 and projected daily production in 2030 and 2040 for three projections for the Marcellus Play. The EIA overestimates daily production in 2030 by up to 36%, and daily production in 2040 by between 45% and 142%.
Combined Plays
Figure 9 illustrates the projections for all plays combined.
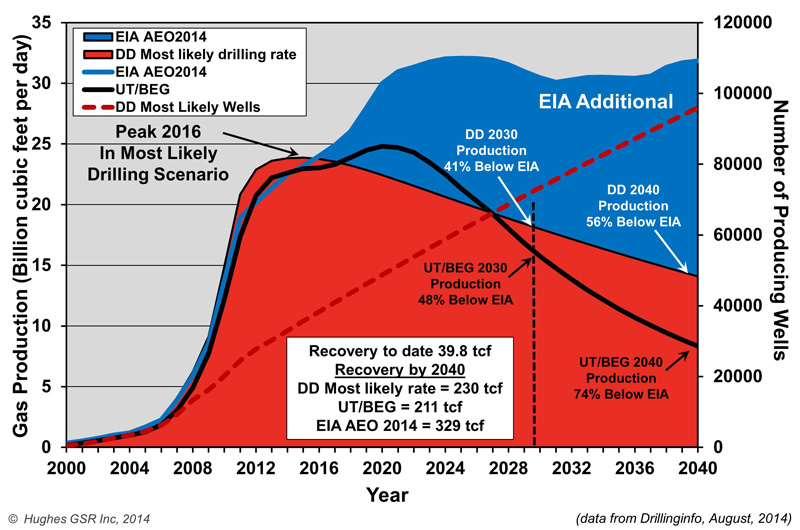
Figure 9 – Comparison of shale gas production projections for all four plays combined through 2040. The “most likely drilling rate” projection from DD is shown compared to the UT/BEG projection, which assumes reference case natural gas prices in the EIA AEO2014, and the EIA reference case projection from AEO2014.
Both the UT/BEG and EIA underestimate historical production, likely due to the fact that the data they used is current only to yearend 2010 to 2012. DD projects a peak in 2016 followed by a gradually increasing decline with a cumulative recovery of 230 tcf, which is nearly six times as much gas as has been recovered from these plays so far. UT/BEG projects a later peak, in 2020, at slightly higher levels, followed by a much steeper decline rate with considerably lower cumulative production and 2030- and 2040-production rates than DD. The EIA projects a peak in 2025 at 43% above current levels followed by an undulating plateau, with cumulative production through 2040 that is 43% higher than DD and 56% higher than UT/BEG.
Figure 10 summarizes the EIA overestimates in both cumulative production through 2040 and projected production rates in 2030 and 2040 compared to the other projections. Cumulative production of gas through 2040 is overestimated by between 43% and 56%. Daily production in 2030 is overestimated by between 69% and 93%. Daily production in 2040 is overestimated by between 126% and 282%.
Figure 10 – Comparison of cumulative production through 2040 and projected daily production in 2030 and 2040 for three projections for all four plays combined. The EIA overestimates daily production by between 69% and 93% in 2030, and by between 126% and 282% in 2040.
Summary and Implications
Projections by the UT/BEG and DD, based on all available well production data, suggest that the projections from the EIA for the four plays examined are vastly overstated, including both cumulative gas recovery and production rates. Production from these plays will likely peak between 2017 and 2020, and be less than half to as little as a quarter of that estimated by the EIA by 2040. Projections from the UT/BEG are the most conservative overall, although both the UT/BEG and DD projections are much more conservative than those of the EIA. Taken together, these plays make up 70% of the EIA’s projected shale gas production through 2040 and 59% of its daily shale gas production in 2040.
Using the same methodology, DD analyzed other shale gas plays, along with associated gas from tight oil production, which total 88% of the shale gas production projected by the EIA through 2040. DD found that the EIA has overestimated cumulative shale gas production from all of these plays by 64%, and daily production by 92% and 182% in 2030 and 2040, respectively.
Two things appear certain from the UT/BEG and DD analyses: prices will have to go considerably higher than EIA estimates in the medium- and long-term to keep production up; and that supply will become problematic within a decade barring the emergence and full development of a Marcellus-class play or two that are as yet undiscovered.
The EIA’s production and price projections for both gas and oil are seen as fundamental inputs to energy policy considerations and investment decisions in many quarters. These include:
- Development of LNG capacity to export the perceived shale gas bounty and monetize it at higher international prices.
- Development of gas-fired generation capacity on the assumption of low long term prices and abundant supply, in preference to other alternatives.
- Development of industrial capacity on the assumption of low prices and abundant supply for the foreseeable future. Industrial users are justifiably concerned about the impact of LNG exports on domestic prices.
- Development of pipeline infrastructure to distribute the projected bounty.
Both Drilling Deeper and the University of Texas Bureau of Economic Geology analyses raise serious questions about the wisdom of these policy and investment choices. Although it is certain that natural gas will be an important part of the long-term energy future, a sustainable energy plan behooves us to have a clear vision of future supply and price constraints in the longer term, and the EIA is letting us down in this regard with its extremely optimistic projections. TheNature piece raised the question and it was taken up by the mainstream media – let’s hope the message is not forgotten amid the hype promoting “Saudi America” and “Energy Independence”.
Paper smile teaser image via shutterstock. Reproduced at Resilience.org with permission.