
The tiny ghost town of Desdemona is situated in Eastland County, Texas, about halfway between Fort Worth and Abilene. It was founded in the mid-19th century as a fort to protect settlers from Indians, its early economy revolving mostly around peanut farming. In 1918, Tom Dees of Hog Creek Oil Company discovered an oil field nearby, and within weeks 16,000 speculators and rig workers crowded Desdemona’s dusty streets. Fortunes were quickly made—less often on actual oil production than on the trading of stock shares, which appreciated dramatically in value during the first couple of years of the boom. (Some shares that originally sold for one hundred dollars soon fetched over ten thousand.) Fortunes were just as suddenly lost in gambling or robberies. By 1920, rampant lawlessness had drawn the attention of the Texas Rangers, who at the time operated as a paramilitary organization employing tactics like targeted killing and enhanced interrogation. The Rangers effectively ran Desdemona—but they didn’t stay long. Between 1919 and 1921, oil production rates dropped by two-thirds. The value of oil stocks collapsed. By 1936, Desdemona’s city government had dissolved itself; the town’s lone school closed its doors in 1969, and as of 2013 only two businesses remain.
Booms go bust: it is a story as old as civilization. Historically, most booms have been associated with resource extraction—gold, silver, oil, gas, or coal. Often, financial speculation based on an extravagant (and sometimes deliberate) overestimation of resource potential drives the peak of the boom higher than would otherwise be the case, thus making the bust all the more devastating. Though the pattern is consistent, on each occasion the participants assure themselves and one another that “this time it’s different.”
The current fracking frenzy in the oil and gas fields of Texas, North Dakota, Oklahoma, Louisiana, Arkansas, Colorado, and Pennsylvania shows all the signs of being a boom in the classic sense. How do we know it’s not different this time, that it won’t end in a colossal bust? And if it is yet another instance of the same old story, how soon will the bust come?
These are questions best answered by data—by realistic resource estimates, per-well production and decline rates, and reliable calculations of the number of possible drilling sites. Compiling these kinds of data is hard work and often requires access to expensive proprietary information. And the rewards are few: investors want good news.
In the previous chapter we surveyed the claims made by the industry regarding reserves and future production of shale gas and tight oil. This chapter tells the story of the data—how they have evolved, and what they tell us now.
THE BOOM THAT FIZZLED
The first indication that the emerging shale gas bonanza might not have a happy ending came in 2007 when Arthur E. Berman, a petroleum geologist and consultant to the oil and gas industry in Sugar Land, Texas, started crunching numbers from the Barnett shale gas play. The results were anything but encouraging. Berman used his regular column (“What’s New in Exploration”) in World Oil magazine to report on his analysis of decline rates and profitability for hydrofractured, horizontally drilled Barnett wells and concluded: “This analysis shows that, while many wells are profitable and some operators are significantly more successful than others, most Barnett shale wells will lose money. . . . The overall resource size for the play is great, but economic reserves are relatively small.”
Berman continued accumulating data from shale plays and publishing his analyses; the following paragraph, from his March 6, 2009, World Oil column titled “Shale Plays, Risk Analysis and Other Perils of Conventional Thinking: Haynesville Shale Sizzle Turns to Fizzle,” is typical of his coverage:
An early analysis of 20 horizontally drilled wells in the Haynesville Shale play in Louisiana and parts of adjacent East Texas suggests a disappointing outcome because of extremely high decline rates. Average monthly decline rates are 24%, with 75% of wells declining 20–35% per month. The impressive initial production rates (IP) for these wells do not, therefore, necessarily translate into high reserves (actual daily production rates from the maximum 30-day period were, in fact, about 20% lower than reported IPs).
Representatives of the shale gas industry hotly denied Berman’s assertions, accusing him of “inconsistent data gathering” and of having “poorly supported opinions.” After all, total production in the shale gas plays was rising, companies were flush with investment capital, and jobs were being created. How could this be anything less than a game-changing economic miracle?
In October 2009, Berman wrote yet another column questioning shale gas prospects; this time World Oil refused to run it. Berman recounted the events this way when I e-mailed him:
Perry Fischer, the editor of World Oil, called to tell me that my column in press would be pulled because of objections from Petrohawk Energy and Seneca Resources. I later had a conversation with John Royall, President and CEO of Gulf Publishing that owns World Oil, who objected to my comments to the press that he had been pressured by industry not to publish my articles on shale. My relationship was based on freedom to choose content. Since the magazine rejected content, I chose to end the relationship.
The incident was reported in the Houston Chronicle (Nov. 3), which noted:
John Royall . . . said he didn’t receive any pressure from gas companies. World Oil serves a global audience, and gas shale is largely a domestic issue. Berman had written on the topic for a year, and Royall decided that was enough. “Art had an interesting take on shale gas,” he said. “It was interesting, provocative stuff, but it was time to move on.”1
Berman continued gathering data, doing the numbers, and writing his conclusions in articles published at TheOilDrum.com and on his own his own blog, PetroleumTruthReport.blogspot.com. He also gave public presentations, including one at the 2009 ASPO-USA conference in Denver, where I first heard him speak.
By 2011, Berman had been joined by other critics of the shale gas boom. Bill Powers, editor of Powers Energy Investor and previously the editor of the Canadian Energy Viewpoint and US Energy Investor, began telling his readers about high decline rates and other problems repeatedly and in detail, relying mostly on Berman’s analysis. “The importance of shale gas has been grossly overstated,” Powers told TheEnergyReport.com. “The US has nowhere close to a 100-year supply. This myth has been perpetuated by self-interested industry, media and politicians.”2 Soon Powers began working on a book, Cold, Hungry and in the Dark: Exploding the Natural Gas Supply Myth, published earlier this year. Art Berman contributed the book’s foreword.
Berman’s work also served as initial inspiration for a major new analytic survey, the most comprehensive to date, authored by David Hughes and published by the Post Carbon Institute (at which I am senior fellow) in February 2013.3 Hughes, a geoscientist who studied the energy resources of Canada for nearly four decades, including 32 years with the Geological Survey of Canada as a scientist and research manager, examined proprietary data on 63,000 US shale gas and tight oil wells, calculating production decline rates in each active play. The data were licensed from DI Desktop. (DI stands for DrillingInfo, a petroleum industry data company headquartered in Austin, Texas.) Hughes’s report fills over 160 pages, including many tables and graphs, and also addresses prospects for expanded production of tar sands and other unconventional fuels. For anyone wanting to understand current and future production from fracking and horizontal drilling, “Drill, Baby, Drill” is the Holy Grail of information and analysis. Here’s the report’s abstract:
It is now assumed that recent advances in fossil fuel production—particularly for shale gas and shale oil—herald a new age of energy abundance, even “energy independence,” for the United States. Nevertheless, the most thorough public analysis to date of the production history and the economic, environmental, and geological constraints of these resources in North America shows that they will inevitably fall short of such expectations, for two main reasons: First, shale gas and shale oil wells have proven to deplete quickly, the best fields have already been tapped, and no major new field discoveries are expected; thus with average per-well productivity declining and ever-more wells (and fields) required simply to maintain production, an “exploration treadmill” limits the long-term potential of shale resources. Second, although tar sands, deepwater oil, oil shales, coalbed methane, and other non-conventional fossil fuel resources exist in vast deposits, their exploitation continues to require such enormous expenditures of resources and logistical effort that rapid scaling up of production to market-transforming levels is all but impossible; the big “tanks” of these resources are inherently constrained by small “taps.”4
From the work of Berman, Hughes, and other analysts, a more realistic picture of the actual potential of shale gas and tight oil plays is emerging. Briefly: The wells in core areas (usually just a few counties) in each of these plays do tend to be productive and profitable, yielding oil or gas in significant amounts for many years. These are not comparable to the conventional oil and gas finds of the mid-20th century, but they do nevertheless provide an important new source of supply for the industry and for the nation. However, these compact core areas tend to be drilled out fairly quickly. Meanwhile, outside these regions, per-well production rates tend to fall quickly and dramatically, and wells are uneconomic. Overall, taking into account decline rates, potential drilling locations, and the variability of regions within resource plays, the industry’s claims for how much oil and gas can be extracted, at what rate, and how profitably, are wildly overblown.
Throughout much of the rest of this chapter, as we explore the energy reality of fracking in more detail, we will be relying primarily on data and analysis in “Drill, Baby, Drill.”
SHALE GAS: THE EVIDENCE IS IN
When discussing US shale gas production, it is always necessary to begin by acknowledging the industry’s accomplishments—as we have already done on more than one occasion in this book. Natural gas production in the United States is now higher than at any point in history, and shale gas currently makes up 40% of America’s total natural gas production. Considering how quickly the new technology has been deployed, this is an impressive achievement.
Nevertheless, it turns out that high productivity shale gas plays are few and far between: just six plays account for 88% of total production. And, as noted at the end of Chapter 2, each play is in effect its own “resource pyramid,” characterized by a few small “sweet spots” surrounded by larger areas capable of only marginal productivity. Drillers invariably concentrate their efforts on the zones of highest productivity first. So, as time goes on and as drillers must stray ever further from sweet spots, the initial productivity of each new well drilled in the play tends to be lower than that of previous wells. The number of available drilling sites is always limited, and, once the play is saturated with wells, per-well decline rates will determine the play’s longevity.
Hughes notes that individual shale gas well decline rates range from 80–95% after 36 months, in the top five US plays. The industry’s claim that America has 100 years of gas is based on the assumption that individual wells will continue to produce for 40 years, but given such steep decline rates, the data do not support this assumption.
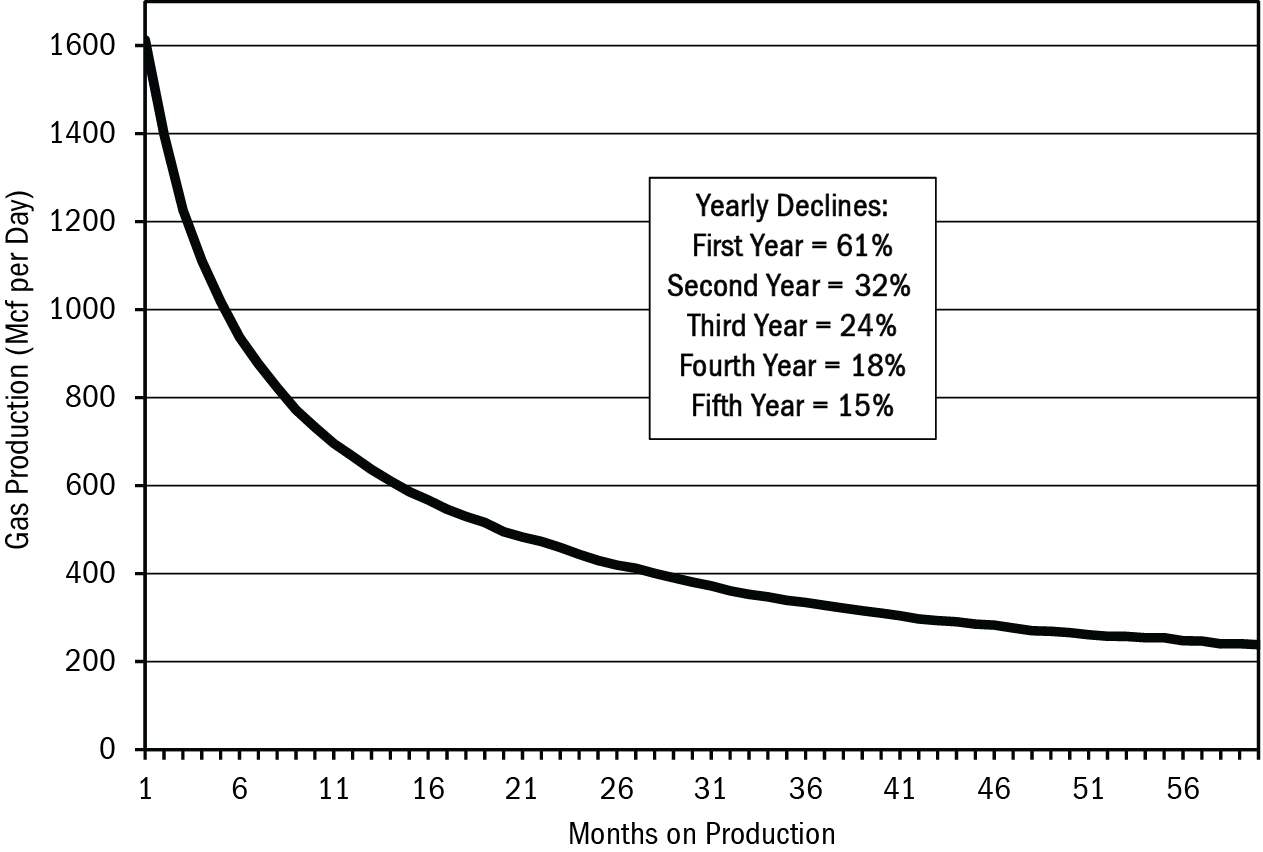
Figure 19. Type Decline Curve for Barnett Shale Gas Wells. Based on data from the most recent five years of this play’s production.
Source: J. David Hughes, “Drill, Baby, Drill,” Figure 48. Data from DI Desktop/HPDI current through May 2012.
One result of high decline rates is that a large proportion of overall field output must be replaced by additional drilling in order to keep the total production rate growing or even flat. Hughes calculates that, for the nation as a whole, between 30 and 50% of shale gas production must be replaced every year with more drilling—amounting to roughly 7,200 new wells a year. Remember: that’s simply to maintain the current production rate. This is the “treadmill to hell” referred to in the title of this chapter. Oil analyst Rune Likvern uses a different metaphor; he calls it the “Red Queen” syndrome, after a character in Lewis Carroll’s Through the Looking-Glass. In that colorful story, the fictional Red Queen jogs along at top speed but never gets anywhere; as she tells Alice, “It takes all the running you can do, to keep in the same place.” Similarly, with such steep decline rates, it takes all the drilling that the industry can do just to keep production steady.5
There were 341,678 operating gas wells in the United States in 2000, prior to the fracking revolution, representing more than a century of drilling efforts. In 2011, that number had swollen to 514,637.6 Here again is evidence that descent to lower levels of the “resource pyramid” ensures diminishing returns from increasing effort: since 1990 the average productivity per well has declined by 38%.
The EIA reports these trends but still believes shale gas production rates can continue to grow. What would it take to make that happen? Only a drilling pace that’s utterly unprecedented can possibly suffice. In the 2005–2008 period, the industry roughly tripled the number of natural gas wells being drilled annually, as compared to 1990s’ rates. To produce the estimated US reserves of shale gas, the EIA calculates that 410,722 shale gas wells will have to be drilled.7 It takes a moment to mentally process the implications of drilling on that scale.
Obviously, this would represent an enormous, unprecedented investment on the part of the gas industry. Already, dry shale gas plays require $42 billion per year in capital investment in drilling in order to offset declines. Given current low natural gas prices (as of this writing, natural gas is selling for about $4 per million Btus), this investment is not recouped by sales: in 2012, US shale gas generated just $33 billion in revenues. As we’ll see in more detail in Chapter 5, gas drilling companies are staving off bankruptcy through a variety of strategies, including asset sales and increased production of liquid fuels. How realistic is it to assume that these companies will double down on their dry gas drilling investments during the next couple of decades, absent much higher gas prices?
And what do these trends suggest about the reliability of shale gas reserves numbers? Clearly, shale gas resources do exist in enormous quantity. But reserves are always a fraction of the total resource base. Some reserves are termed technical reserves: these are resources that theoretically could be extracted given current technology. A smaller but more important category consists of economic reserves: these are resources that can profitably be extracted with current technology and at current prices. If the industry is, on the whole, losing money on shale gas production, this suggests that US economic reserves of shale gas are in fact fairly modest. At higher prices, more resources would fall into this category. If gas prices were $15 per million Btus (as they already are in some parts of the world) instead of $4, then economic reserves would grow accordingly. But the American people are being led to believe that most of the shale gas resource base can be produced at a price low enough so as to enable natural gas to be used for the majority of power generation, and even as a substitute for gasoline in tens of millions of cars and trucks. This is pure folly.
Finally, what are we to make of the familiar claim that the United States is sitting on a hundred years’ worth of natural gas? It is clearly not based on realistic public data. The EIA lists proved and unproved technically recoverable shale gas reserves at almost 600 trillion cubic feet (tcf). This is 24 years of natural gas supplies at current US consumption rates. But even this 24-year supply estimate is questionable. David Hughes notes: “This is an extremely aggressive forecast, considering that most of this production is from unproved resources, and would entail a drilling boom that would make the environmental concerns with hydraulic fracturing experienced to date pale by comparison.”8
Rafael Sandrea of IPC Petroleum Consultants, in a report titled “Evaluating Production Potential of Mature US Oil, Gas Shale Plays,” notes that unusually high field decline rates associated with shale gas plays imply low recovery efficiencies. “The average recovery efficiency is about 7%,” he writes, “in contrast to recovery efficiencies of 75–80% for conventional gas fields. This suggests that the estimate of recoverable gas for all US shale plays should be near 240 tcf.”9 Which is less than 10 years of current United States natural gas consumption.
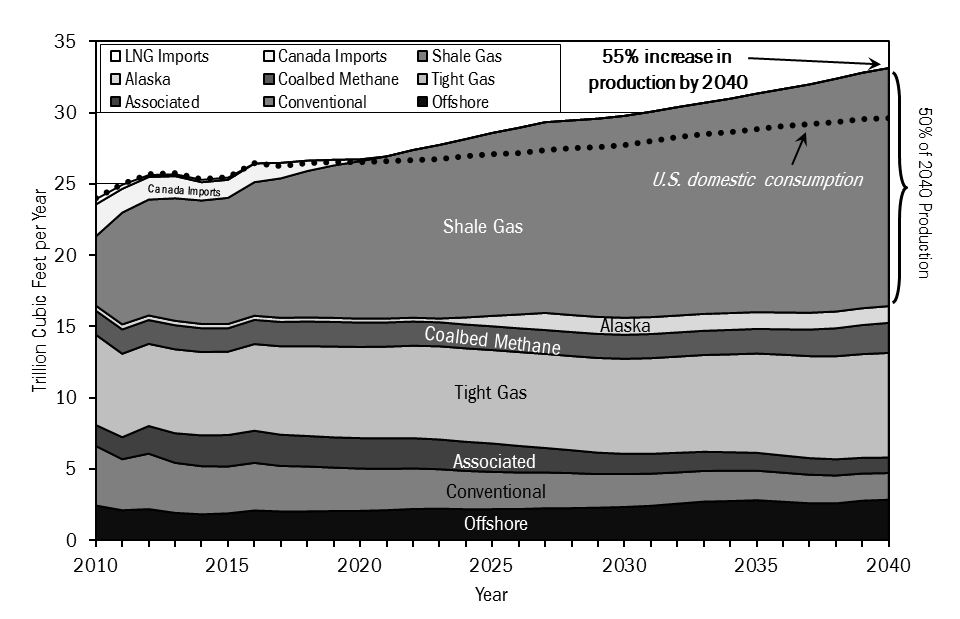
Figure 20. EIA Projection of US Natural Gas Supply by Source, 2010–2040. In this projection, shale gas accounts for 50% of production in 2040.
Source: J. David Hughes, “Drill, Baby, Drill,” Figure 32; data from Energy Information Administration, Annual Energy Outlook 2013 (Early Release), Tables 13 and 14.
BAKKEN BOOM, BAKKEN BUST
The situation we’ve just surveyed with regard to shale gas is largely mirrored in the tight oil plays of North Dakota and south Texas. Again, per-well production decline rates are steep—between 81 and 90% in the first 24 months. Production from individual wells tapers off so quickly that 40% of overall output (from older wells with lower decline rates along with output from newer ones) must be replaced annually by new drilling just to keep the total supply curve flat. According to Hughes, “Together the Bakken and Eagle Ford plays may yield a little over 5 billion barrels—less than 10 months of US consumption.”10
The Bakken play had produced 0.5 billion barrels through May 2012, with an estimated ultimate recovery of about 3 billion barrels by 2025. On one hand, this represents a remarkable accomplishment: who in 2000 or even 2005 expected North Dakota to become a major oil-producing region? Yet the achievement requires extraordinary effort. Drillers can’t let up; if they do, high per-well decline rates will ensure falling overall production.
An article by Jaci Conrad Pearson in the Black Hills Pioneer (September 19, 2012) titled “It Takes Oil Money to Make Oil Money” captures the expense of an enterprise involving hundreds of companies and thousands of wells:
“It takes $3 per second, $180 per minute, $10,800 per hour and $259,000 a day to drill an onshore well,” said Kent Ellis, owner of Aurora Energy Solutions, LLC, an oil and gas brokerage firm with offices in Bismarck, ND and Oklahoma City, Oklahoma, during his address to a crowd of more than 100 gathered for his presentation as part of the Black Hills Pioneer’s Oil, Gas and Mineral Rights Workshop. “. . . It takes 2,200 gallons-plus of diesel fuel a day, just to run the rig.” And moving the rig is another story and another significant cost. “To move a rig from Spearfish to Belle Fourche costs around $250,000,” Ellis said.11
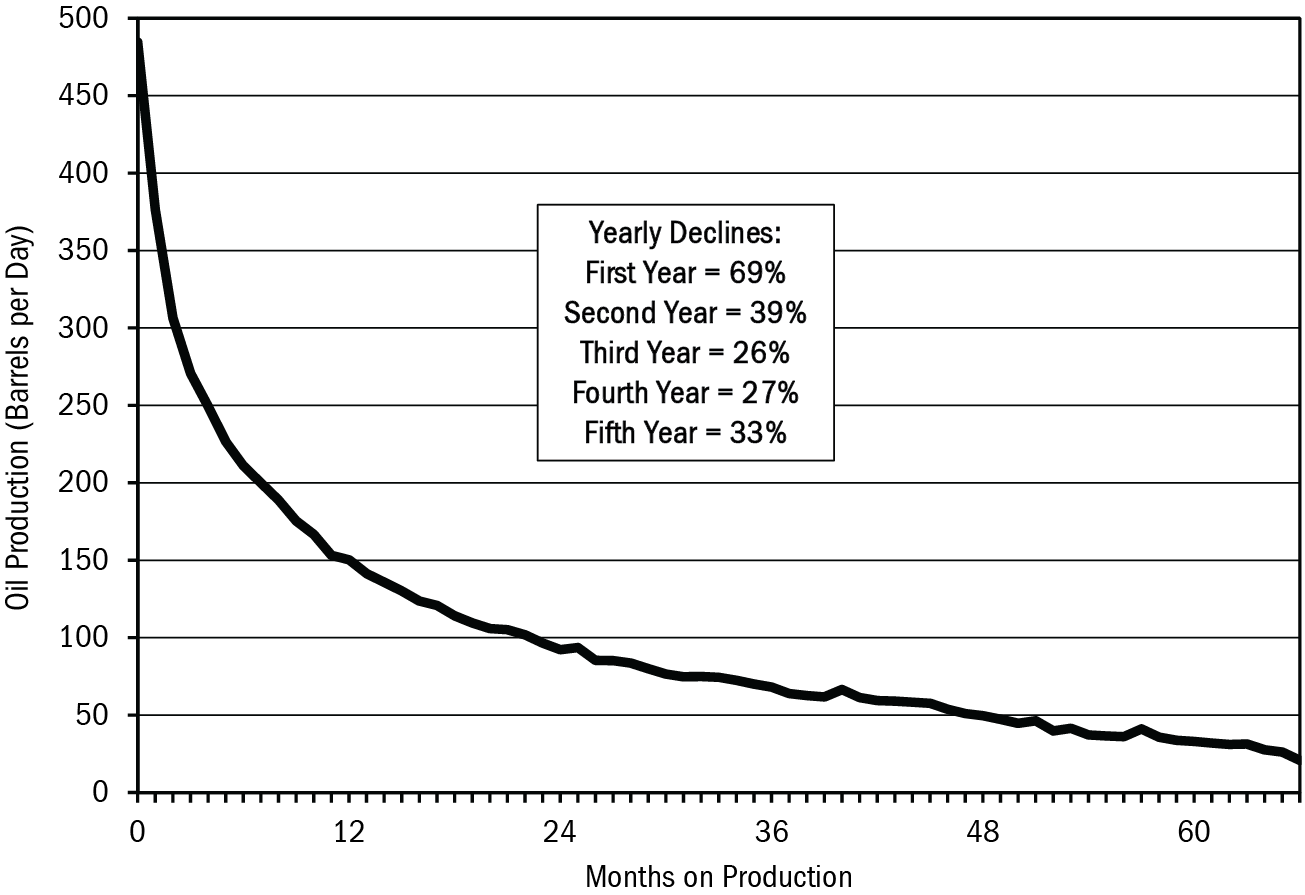
Figure 21. Type Decline Curve for Bakken Tight Oil Wells. Based on data from the most recent 66 months of this play’s oil production.
Source: J. David Hughes, “Drill, Baby, Drill,” Figure 63; data from DI Desktop/HPDI current through May 2012.
This is not your grandfather’s oil business. Tight oil deposits are typically thinner than those in conventional wells, with layers of oil-bearing rock sandwiched between other rock layers. Horizontal drilling enables the operator to go after oil deposits from the side, yielding much higher recovery than a vertical well could achieve. But it also implies a dramatic production decline curve. In effect, operators must chase the deposit sideways, and the cost of drilling horizontally in pursuit of the ever-retreating reserve quickly escalates. “Eventually,” according to Robert Smith, operations geologist with International Western Oil, “horizontal drilling is suspended because operators reach a point where they are just burning cash.”12

Figure 22. Future Oil Production Profile for the Bakken Play, Assuming Current Rate of New Well Additions. Based on data from the most recent 66 months of this play’s oil production.
Source: J. David Hughes, “Drill, Baby, Drill,” Figure 66; historical data from DI Desktop/HPDI current through May 2012.
The Eagle Ford is younger in its production cycle than the Bakken. Operators there are still in the process of identifying sweet spots; while they find and drill these optimum locations, average initial production rates are still rising. Still, Eagle Ford decline rates are even higher than those observed in the Bakken. The first-year decline in production in new Eagle Ford wells is 60% and the overall decline at the end of the second year is 89% below the average initial production levels of wells drilled in 2012. These decline rates mean the average Eagle Ford well will enter the category of “stripper” well (yielding fewer than 15 barrels per day) within about three years.
For every play there are only so many places to drill. For the Eagle Ford, the EIA estimates a total of 11,406 effective locations. With a 40% overall field decline rate, and assuming current rates of drilling with all new wells performing as in 2011, Hughes anticipates a peak of production in the Eagle Ford in 2016 at 0.891 million barrels per day.13 Total oil recovery is estimated at about 2.23 billion barrels by 2025, amounting to a five-month contribution to US oil consumption.14
More than 80% of current tight oil production in the United States comes from the Bakken and Eagle Ford, with the other 20% issuing from 19 other formations. Estimates suggest the biggest prize of all could be the Monterey shale in California, with 41% of America’s total purported tight oil resources. But Hughes is not optimistic about the Monterey play’s prospects: “Recent drilling results have been disappointing and the longer-term performance of the Monterey is mostly at ‘stripper well’ levels . . . with an average of 12.7 barrels per day from [each of] 675 wells. This bears no comparison to the Bakken or Eagle Ford.”15 The problem is geological: California’s seismic history has left the Monterey shale heavily faulted, folded, and fractured, presenting drillers with far more expensive complications than ones they face in North Dakota and Texas.16
The United States’ total tight oil “technically recoverable unproved resources” are estimated at between 23 and 34.6 billion barrels (assuming that 13.7 billion barrels can be produced from the Monterey play). “Although significant,” writes Hughes, “this is hardly cause for celebrating US ‘energy independence,’ as it represents somewhere between three and four years of consumption, even if it all could be recovered—which would take decades.”
WILL THE REST OF THE WORLD GET FRACKED?
Some fracking boosters claim that the United States is merely the thin end of a wedge, and that the same technology that opened up the Barnett and Bakken will soon liberate oil and natural gas from similar reservoirs in China, Europe, and elsewhere. How likely is this?
The US fracking boom is several years old now, and so far little shale gas or tight oil production is occurring in other parts of the world. This could simply be a problem of timing: perhaps the rest of the world will eventually catch up with North America. On the other hand, there could be fundamental barriers to the widespread application of fracking technology outside the United States. Let’s explore the factors at work and see whether they support an expectation of worldwide shale gas and tight oil abundance.
Some countries have banned, tightly regulated, or put off fracking for environmental reasons. Outright bans have been enacted in France, Luxembourg, and Bulgaria. In Germany, Poland, and the United Kingdom, tight regulations constrain drillers. Throughout most of Europe there is strong public opposition to fracking on environmental grounds. Whether these are temporary or persisting impediments to industry development will depend on forthcoming revelations about the environmental safety of fracking, and on industry efforts to address the problems. As we’ll see in Chapter 4, the impacts to air quality, water quality, and climate from shale gas and tight oil production are hardly trivial.
In the United States, public opposition to fracking has been attenuated by the system of private ownership of mineral rights. Households that stand to gain thousands, perhaps even a few million dollars, from leasing drilling rights and from subsequent production royalties are often willing not just to overlook environmental problems, but to actively oppose other members of their communities who seek to enact drilling moratoria or bans. In most other nations, the government owns all mineral rights. Local environmental problems that ensue from fracking are therefore likely to provoke much more local opposition outside the United States.
While large shale gas and tight oil reserves numbers are often touted for other nations, those numbers are highly speculative. According to a 2011 US Energy Information Administration estimate, Poland has Europe’s largest recoverable reserves of shale gas—187 trillion cubic feet, a third more than those of the Marcellus shale. However, this is a fairly meaningless statistic: the Polish Geological Institute estimates the nation’s reserves at 27 trillion cubic feet, only about one-seventh the EIA figure. Until many wells have been drilled and are in production, both numbers are mere guesses. Currently, nearly 1,200 drilling rigs are busy perforating America’s shale beds; Poland so far deploys only half a dozen rigs.
Hence another problem with the worldwide deployment of fracking: the lack of technology. The oil and gas industry got its start in the United States, and America has always enjoyed a technological edge when it comes to drilling. Most of the world’s oil services companies, which pioneered nearly all of the important innovations in drilling during the past century and a half, are headquartered in Texas. The United States has half the world’s drilling rigs, and American colleges and universities still turn out the bulk of the world’s petroleum geologists and engineers. Other countries—China comes quickly to mind—could make the enormous investments required to develop the needed technology, build the rigs, and train the experts. But it would still take time.
Water can also be a limiting factor. Saudi Arabia has plenty of gas-bearing shales, but little of the water that would be necessary to hydrofracture them. As climate change brings more extreme periodic drought conditions to nations like Australia and China, high water demands may make hydrofracturing problematic-to-impossible in those countries as well.17
Geology is a problem too. As we’ve seen, not all US shale plays are created equal, and even in the best of them only localized “core areas” are actually profitable to drill. The same principle holds for the rest of the world. China’s shale gas resources are purported to be the world’s largest, beating even those of the United States. But the Chinese formations are more complex than those in the United States, many having a high clay content, which makes them more pliable and less apt to fracture. Also, many Chinese shale plays are deeper, requiring higher per-well investment in drilling. Compounding these problems, China lacks means for compiling, assessing, and sharing geological data comparable to those developed during the past century in the United States.18
Financial factors also constrain non-US development of shale gas and tight oil. In the United States, the fracking boom was driven by small companies willing to take on substantial financial risk. The industry was also buoyed by investor capital funneled by Wall Street, which tirelessly hyped the nation’s prospects for a century’s worth of cheap gas and oil. In many other countries, state-owned companies do the drilling, and investment decisions are made by risk-averse bureaucrats rather than risk-seeking, hype-driven capitalists.
Altogether, the evidence suggests that other nations are working to develop the means to extract shale gas and tight oil resources, and that they will eventually have some success. But the process will take years, and there is no nation in which the oil and gas industry is likely to fully repeat the performance of the independent companies operating in Texas, North Dakota, Pennsylvania, Louisiana, and Arkansas.
WHY DO OFFICIAL AGENCIES SO OFTEN GET IT WRONG?
The picture we’ve been painting in this chapter is radically different from the one that fracking boosters portray. But it differs also from the forecasts of official agencies—principally, the International Energy Agency and the US Energy Information Administration—and from those of oil industry sources such as BP’s annual “Statistical Review of World Energy.” Reading David Hughes’s “Drill, Baby, Drill” report, one encounters statements like these:
The IEA’s suggestion that these costs will not escalate further over the next 23 years, as assumed in its $10 trillion upstream oil forecast, seems wishful thinking indeed. (p. 26)
The growth in shale/tight oil production in this projection is very aggressive, requiring the consumption of 26 billion barrels, or 78%, of the EIA’s estimated unproved technically recoverable shale/tight oil resource by 2040. The likelihood of this happening is remote. (p. 34)
Why should we believe Hughes but not the EIA? Does the agency ever get its numbers wrong? Yes, as a matter of fact, it frequently does. Hughes provides a graphic of 12 EIA forecasts for world oil production going back to 2000, noting, “Compared to actual 2011 production, these projections invariably overestimated world oil production levels. The 2002 projection, for example, overestimated 2011 production by 13%, or 11 [million barrels per day]—and that was only nine years out.”19
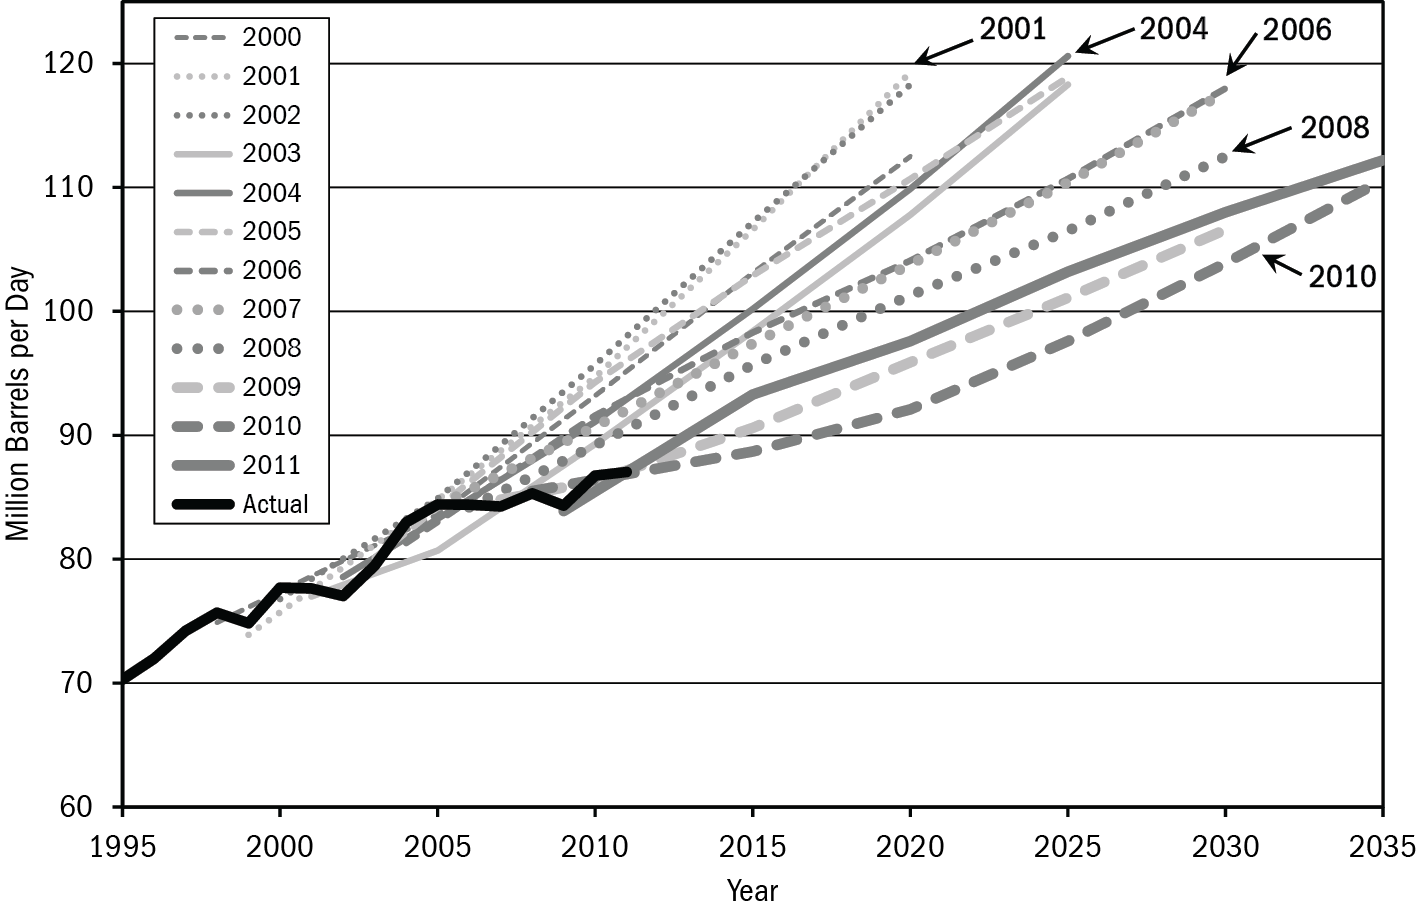
Figure 23. EIA World Oil Production Estimates Compared to Actual Production, 2000–2011. Most cases overestimated actual 2011 production.
Source: J. David Hughes, “Drill, Baby, Drill,” Figure 25. Data from Energy Information Administration.
In March 2012, the EIA published an “Annual Energy Outlook Retrospective Review: Evaluation of 2011 and Prior Reference Case Projections,” in which it found that during the past dozen years it had underestimated oil prices and overestimated oil production most of the time. (More specifically, the agency found that it had overestimated crude oil production 62% of the time and overestimated natural gas production 70.8% of the time.)20
There is evidence to suggest that this pattern of poor forecasting is ongoing. Roger Blanchard, author of The Future of Global Oil Production: Facts, Figures, Trends and Projections by Region, notes that recent EIA reports assume that US offshore oil production will continue to increase over time. However, the agency’s own data show that total Gulf of Mexico oil production achieved its highest level in 2009 and has declined every year since then.
Table. U.S. Offshore Oil Production, Energy Information Administration Estimates Versus Actual, 2009–2012. Estimates are from Annual Energy Outlook 2010.
|
Year |
EIA Estimated Production (mb/d) |
Actual Production (mb/d) |
Difference between EIA Estimates and Actual Production (b/d) |
|
2009 |
N/A |
1.62 |
N/A |
|
2010 |
1.67 |
1.61 |
60,000 |
|
2011 |
1.77 |
1.37 |
400,000 |
|
2012 |
1.82 |
1.29** |
530,000 |
** Data through October 2012.
Source: Roger D. Blanchard, “Commentary: US DOE/EIA Forecast Estimates Face Reality,” ASPO–USA (website), January 14, 2013, http://aspousa.org/2013/01/commentary-us-doeeia-forecast-estimates-face-reality/.
The IEA has a record that’s no better. The 2000 IEA forecast for the price of oil a decade hence, adjusted for inflation to the 2000 dollar, was $28.25. The actual price in 2010 was $79.61, roughly three times the forecast price (and that was in the wake of the Great Recession). Also in 2000, the IEA forecast that total world liquid fuels production would reach 95.8 million barrels per day in 2010. The actual figure was 87.1 mb/d.
More examples could easily be cited—including ones from BP’s annual “Statistical Review of World Energy.” The natural question: Why have these agencies apparently adopted a bias toward overestimating production and underestimating prices? Longtime observers tend to agree that the agencies do not intend to deceive; they are merely producing demand-driven forecasts arrived at by assuming continuous GDP growth and a corresponding increased requirement for energy. Geological limits and the need for capital investment play a minor role in these calculations.
In 2009, the Guardian reported that a senior IEA official accused the agency of deliberately underplaying a looming world oil shortage for fear of triggering panic buying. “The senior official claims,” according to the story, that “the US has played an influential role in encouraging the watchdog to underplay the rate of decline from existing oil fields while overplaying the chances of finding new reserves.”21 The International Energy Agency, set up in the 1970s to warn the world’s industrialized nations about future oil shocks, evidently bows to pressure from the United States. Meanwhile, the US Department of Energy’s Energy Information Administration appears to make its forecasts of future oil production conform to politically comfortable assumptions about economic growth.
During the past decade, there has been one notable exception to the agencies’ tendency toward over-optimism: in the years prior to 2009, the EIA and IEA failed to foresee the substantial increase in US natural gas and oil production resulting from the application of hydrofracturing and horizontal drilling. But as soon as the new trend of growing production in Texas, North Dakota, and Pennsylvania became apparent, the agencies appear to have overcompensated. They quickly reverted to their usual pattern of overestimating future supplies and underestimating future prices.22
THE BOTTOM LINE ON FRACKING’S POTENTIAL TO REVOLUTIONIZE OIL AND GAS PRODUCTION
Raymond Pierrehumbert, Professor of Geophysical Sciences at the University of Chicago, recently summarized the situation with crystalline brevity: “Oil production technology is giving us ever more expensive oil with ever-diminishing returns for the ever-increasing effort that needs to be invested.”23 The numbers tell the story: in the decade between 1994 and 2004, roughly $2.4 trillion in oil industry capital expenditures buoyed the worldwide rate of oil production by 12 million barrels per day. Yet a similar $2.4 trillion in capital expenditures spent from 2005 to 2010 failed to stem the tide of declining production in the world’s older, supergiant oil fields. Global oil production during those five years declined by two hundred thousand barrels per day.24 The ongoing substitution of conventional, cheap oil with expensive, technology-intensive, unconventional oil sources can be compared to the human body’s use of internal energy resources in the absence of sufficient food. If one doesn’t eat for a few days, the body starts burning stored fat, then muscle, and finally tissues surrounding internal organs. Each next step in the process reduces overall health but is necessary to maintain life. Similarly, the global economy naturally prefers to burn regular, conventional, cheap petroleum. But as supplies dwindle, markets prioritize the use of functionally similar fuels, even though their extraction requires much higher rates of drilling, is therefore more expensive (thus impacting oil prices and the global economy), and is more environmentally risky.
Fracking gives our current energy system a brief, fragile reprieve. New extraction technology cannot return us to the bygone era of cheap energy and easy economic growth. The best it can do is to buy us a few years of relative economic stability in which to develop alternative energy sources and build low-energy transport and food systems.
But instead of embarking on that needed project, our political leaders have unquestioningly seized on exaggerated claims from oil industry hucksters promising a century of cheap natural gas and soaring oil production rates. The result is an “all of the above” energy policy with no clear direction, and a dangerous complacency about the fate of essential but highly vulnerable food and transport systems designed during past decades of hydrocarbon abundance.
Rather than a century of plenty, we face the likely recommencement of declines in US oil and gas production before 2020. We’ve purchased a few years of respite from the relentless and inevitable erosion of our nation’s oil and gas production rates, but at what cost?
 BUY THE BOOK
References
1.Loren Steffy, “Shale or Sham? A Skeptic Speaks Out,” Houston Chronicle, November 12, 2009, http://www.chron.com/business/steffy/article/Shale-or-sham-A-skeptic-speaks-out-1748427.php.
2.Bill Powers, “US Shale Gas Won’t Last Ten Years: Bill Powers,” interview by Peter Byrne, The Energy Report (website), November 8, 2012, http://www.theenergyreport.com/pub/na/14705.
3.J. David Hughes, “Drill, Baby, Drill: Can Unconventional Fuels Usher in a New Era of Energy Abundance?” Post Carbon Institute (website), February 2013, http://www.postcarbon.org/drill-baby-drill/.
4.“Drill, Baby, Drill: Can Unconventional Fuels Usher in a New Era of Energy Abundance?” abstract, Post Carbon Institute (website), accessed May 10, 2013, http://www.postcarbon.org/drill-baby-drill/.
5.Rune Likvern, “Is Shale Oil Production from Bakken Headed for a Run with ‘The Red Queen’?” The Oil Drum (blog), September 25, 2012, http://www.theoildrum.com/node/9506.
6.“Number of Producing Gas Wells,” US Energy Information Administration (website), accessed April 30, 2013, http://www.eia.gov/dnav/ng/ng_prod_wells_s1_a.htm.
7.Energy Information Administration, Annual Energy Outlook 2012.
8.Hughes, “Drill, Baby, Drill,” 50.
9.Rafael Sandrea, “Evaluating Production Potential of Mature US Oil, Gas Shale Plays,” Oil & Gas Journal, December 3, 2012, http://www.ogj.com/articles/print/vol-110/issue-12/exploration-development/evaluating-production-potential-of-mature-us-oil.html.
10.Rune Likvern, “Is the Typical NDIC Bakken Tight Oil Well a Sales Pitch?,” The Oil Drum (blog), April 29, 2013, http://www.theoildrum.com/node/9954.
11.Jaci Conrad Pearson, “It Takes Oil Money to Make Oil Money,” Black Hills Pioneer, September 19, 2012, http://www.bhpioneer.com/local_news/article_7bd871d0-0274-11e2-8011-001a4bcf887a.html.
12.Ashley Eady, “Oil Industry Insiders Divided Over Longevity, Feasibility of Shale Play,” Lubbock Avalanche–Journal, February 2, 2013, http://lubbockonline .com/business/2013-02-02/oil-industry-insiders-divided-over-longevity-feasability-shale-play?v=1359873091#.UTDmLBmRrEM.
13.Hughes, “Drill, Baby, Drill,” 95.
14.Hughes, “Drill, Baby, Drill,” 99.
15.Hughes, “Drill, Baby, Drill,” 106.
16.Alison Vekshin, “California’s Fracking Bonanza May Fall Short of Promise,” Bloomberg.com, April 9, 2013, http://www.bloomberg.com/news/2013-04-10/california-s-fracking-bonanza-may-fall-short-of-promise.html.
17.Wael Mahdi, “Saudi Arabia’s Shale Plans May Be Slowed by Lack of Water,” Bloomberg.com, March 12, 2013, http://www.bloomberg.com/news/2013-03-12/saudi-arabia-s-shale-plans-may-be-slowed-by-lack-of-water.html.
18.Jeff Tollefson, “China Slow to Tap Shale-Gas Bonanza,” Nature 494, no. 7437 (February 20, 2013): 294, doi: 10.1038/49429. 19.Hughes, “Drill, Baby, Drill,” 28.
20.US Energy Information Administration, “Annual Energy Outlook Retrospective Review: Evaluation of 2012 and Prior Reference Case Projections,” March 2013, http://www.eia.gov/forecasts/aeo/retrospective/pdf/retrospective.pdf.
21.Terry Macalister, “Key Oil Figures Were Distorted by US Pressure, Says Whistleblower,” Guardian, November 9, 2009, http://www.guardian.co.uk/environment/2009/nov/09/peak-oil-international-energy-agency.
22.Andrew Nikiforuk, “Why Energy Experts Get Things Wrong So Often,” The Tyee (website), March 20, 2013, http://thetyee.ca/News/2013/03/20/Energy-Experts/.
23.Raymond T. Pierrehumbert, “The Myth of ‘Saudi America’,” Slate.com, February 6, 2013, http://www.slate.com/articles/health_and_science/science/2013/02/u_s_shale_oil_are_we_headed_to_a_new_era_of_oil_abundance.single.html.
24.John Westwood, “Energy Business Prospects,” (lecture, SNS 2012, Norwich, England, March 1, 2012). See slide 8 of Westwood’s presentation at http://www.slideshare.net/DouglasWestwood/sns2012-1-mar-2012-jw-slideshare.