Tell Us About Post-1970 Lower 48 Oil Production?
Introduction
Kenneth Deffeyes, in Chapter Three of his recent book, “Beyond Oil: The View From Hubbert’s Peak,” described a simplified way of predicting the production peaks for various regions and for their subsequent declines. One simply plots annual production (P) divided by cumulative production to date (Q) on the vertical axis, or P/Q, versus Q on the horizontal axis (see Figure 1). Stuart Staniford, on The Oil Drum Blog, has described this technique as “Hubbert Linearization” or HL [1].
With time, a HL data set starts to show a linear progression, and one can extrapolate the data down to where P is effectively zero, which gives one Qt, or ultimate recoverable reserves for the region. Based on the assumption that production tends to peak at about 50% of Qt, one can generate a predicted production profile for the region. The Lower 48 peaked at 48.5% of Qt.
Using the HL technique, Dr. Deffeyes, an associate of Dr. Hubbert, predicted that the world crossed the mathematical 50% of Qt mark on December 16, 2005. In other words, Dr. Deffeyes believes that the world is now where the Lower 48 was at in the early Seventies.
Given this prediction, we wondered how accurate has the HL technique been in predicting post-peak cumulative Lower 48 oil production. Also, what can the Lower 48 model tell us about the future of world net oil export capacity? Finally, we have a recommendation, a fundamental shift in US tax policy.
Hubbert Linearization Analysis of Post-Peak Lower 48 Oil Production
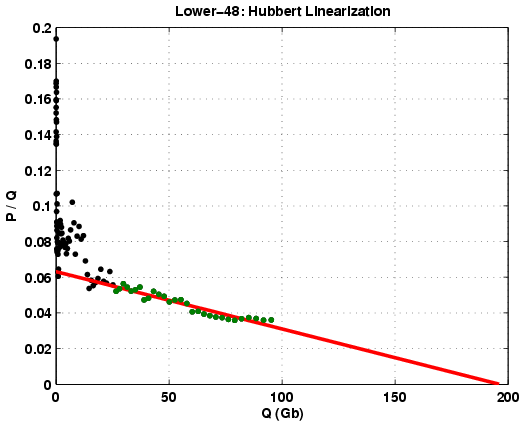 Fig 1. Hubbert Linearization technique applied to the Lower-48. Only the data between 1942 and 1970 are used to perform the fit (green points).
 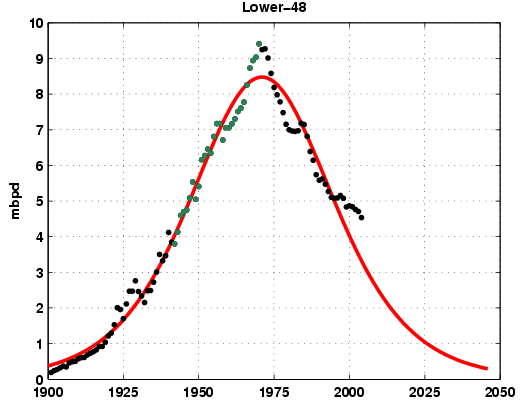 Fig 2. Lower-48 production data and logistic curve resulting from the Hubbert Linearization technique.
 Using only 1970 and earlier production data, the HL plot predicted that post-1970 Lower 48 cumulative oil production would be 78.5 Gb, which is 98.7% of the actual post-1970 cumulative oil production (79.5 Gb). Note that actual oil cumulative production was slightly less than what the HL plot predicted.
This suggests that we can almost certainly place a good deal of confidence in Dr. Deffeyes’ prediction that the world is on the edge of a permanent and irreversible decline in conventional oil production. If the Lower 48 were the sole source of crude oil for the world, for every two gallons of gasoline that the world bought in 1970, we would be bidding for one gallon today.
World Net Oil Export Capacity
Using all available data, we generated a HL plot for the sum of the production from these four countries, deriving a Qt of 569.8 Gb (Figure 3). We then generated a production versus time plot (Figure 4), showing the historical and predicted future production for all four countries. Note that based on the HL analysis, these four countries are collectively about 55.5% depleted. Keep in mind that the Lower 48 analysis was 98.7% accurate in predicting post-1970 cumulative Lower 48 production (using only data through 1970).
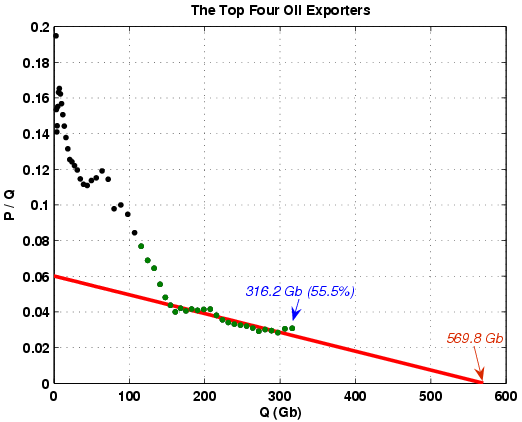 Fig 3. Hubbert Linearization technique applied to the total production of the top four oil exporters. Only the data between 1979 and 2004 are used to perform the fit (green points).
 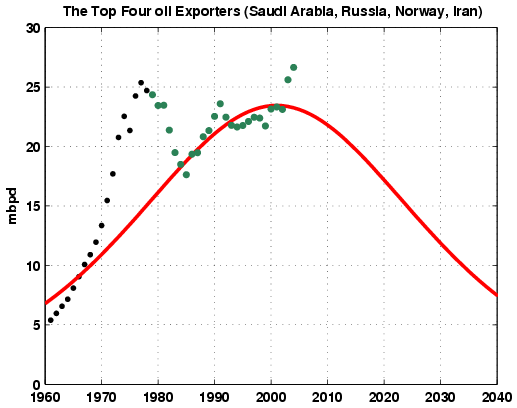 Fig 4. Sum of the top four production data and logistic curve resulting from the Hubbert Linearization technique.
 The predicted Russian production profile is the most controversial of the four plots that we analyzed. However, Russian Minister of Industry and Energy Viktor Khristenko, in an interview with Russian Profile [5], had the following statement, “One important point is that the longer we delay making this decision (encouraging frontier exploration in Russia with tax breaks), the harder it will be to feel the effectiveness of the measures taken: the structure of the country’s reserves will continue to get worse and Russia could end up facing a real collapse in oil production.”
A critical point to keep in mind is that an exporter can only export what is left after domestic consumption is satisfied. Consider a simple example, a country producing 2.0 mbpd, consuming 1.0 mbpd and therefore exporting 1.0 mbpd. Let’s assume a 25% drop in production over a six year period (which we have seen in the North Sea, which by the way peaked at 52% of Qt) and let’s assume a 10% increase in domestic consumption. Production would be 1.5 mbpd. Consumption would be 1.1 mbpd. Net exports would be production (1.5 mbpd) less consumption (1.1 mbpd) = 0.4 mbpd. Therefore, because of a 25% drop in production and because of a 10% increase in domestic consumption, net oil exports from our hypothetical net exporter dropped by 60%, from 1.0 mbpd to 0.4 mbpd, over a six year period.
We are deeply concerned that the world is probably facing an imminent and catastrophic collapse in net oil export capacity because of declining production and increasing domestic consumption in the top exporting countries. Figure 4 predicts that the combined oil production by the current top four net exporters will be reduced by 50% by the year 2028, which would probably equate to a reduction in net oil exports of at least 75% over the next two decades.
As the reality of declining conventional oil production sets in, enormous amounts of capital and energy will be allocated toward nonconventional oil reserves in an effort to try to keep the supply of liquid transportation fuels–gasoline; diesel and jet fuel–growing. The principal effort will be focused on very heavy oil, bitumen (tar sands) and coal liquefaction. These nonconventional sources will help, but the key point to keep in mind is that we are merely discussing increasing the rate of extraction of fossil fuels. The question we have to ask is whether the enormous amounts of capital and energy might be better spent on renewable energy projects. In any case, we predict that nonconventional sources of oil will only serve to slow–and not reverse–the long term decline in world oil production.
Proposal: Replace the Payroll Tax with an Energy Tax
We recommend that the United States abolish the payroll tax (Social Security + Medicare tax) and replace it with either a liquid transportation (petroleum) fuel tax or an overall (nonrenewable) energy tax.
The majority of American households pay more in the payroll tax than in the income tax. This would be a tax cut for most households and it would a massive tax increase on those who are profligate in their use of energy. No matter where one lives, the cost of goods would go up, but if you lived close to where you work, your effective tax rate would go down. Of course, those who persisted in long commutes would pay the price.
There would of course be very powerful forces opposed to this idea–the housing industry; auto industry; airlines; trucking–the list goes on. But the fates of these industries are sealed. It’s not a question of if they will contract; it’s just a question of when. The sooner it happens, and the sooner these industries start emphasizing energy efficiency, the better off we all will be.
A high gasoline tax does not necessarily equate to a lower standard of living. Norway, with the highest gasoline tax in the world, has the highest standard of living in the world, perhaps partly because their car ownership per 1,000 people is about half of what it is in the US.
There would be some other benefits. As we turned to walking, biking and mass transit, our health would improve. There is pretty much a linear correlation between obesity rates and total miles driven (here in the US, we are the world champs in both categories). In addition, since this is in effect a consumption tax, everyone who now avoids paying Social Security taxes would no longer be able to avoid paying them.
However, the primary reason for implementing the proposal is that it would cause an immediate and massive across the board push for greater energy efficiency and it would unleash enormous free market forces against profligate energy use.
Jeffrey J. Brown is an independent petroleum geologist in Addison, Texas
E-mail: [email protected]
Khebab has a Masters Degree in Physics and a Ph.D. in signal processing. He is currently a researcher in a computer vision lab in Quebec, Canada, with ten years experience in R&D.
References:
[1] TOD: Another Way of Looking at CERA
[2] EIA: Lower-48 production data (1859-1948)
[3] EIA: Lower-48 production data (1949-2004)
[4] BP: Statistical Review of World Energy 2005
[5] russiaprofile.org: The Need for Energy Dialogue
Related Posts:
Saudi Arabia’s Ability to Export Oil
Iran’s Ability to Export Oil
Uncertainties About Russian Reserves and Future Production