A new study published in the Nature Geosciences journal this week by largely UK-based climate scientists has led to claims in the media that climate models are “wrong” and have significantly overestimated the observed warming of the planet.
Here Carbon Brief shows why such claims are a misrepresentation of the paper’s main results. In reality, the results obtained from the type of model-observation comparisons performed in the paper depend greatly on the dataset and model outputs used by the authors.
Much of the media coverage surrounding the paper, Millar et al, has focused on the idea that climate models are overestimating observed temperatures by around 0.3C, or nearly 33% of the observed warming since the late 1800s. For example, the Daily Mailreported:
According to these models, temperatures across the world should now be at least 1.3 degrees above the mid-19th century average, which is taken as a base level in such calculations. But the British report demonstrates that the rise is only between 0.9 and 1 degree.
Lead author Dr Richard Millar and his co-authors have pushed back against such media coverage, releasing a statement which says:
A number of media reports have asserted that our [study] indicates that global temperatures are not rising as fast as predicted by the Intergovernmental Panel on Climate Change (IPCC), and hence that action to reduce greenhouse gas emissions is no longer urgent. Both assertions are false. Our results are entirely in line with the IPCC’s 2013 prediction that temperatures in the 2020s would be 0.9-1.3 degrees above pre-industrial [levels].
[Carbon Brief’s guest post by Dr Millar earlier this week includes the paper’s key figures. Additionally, one of his co-authors, Prof Piers Forster, provides further reaction at the end of this article.]
Contrary to media claims, the study found that warming is consistent with the range of IPCC models, albeit a bit lower than the average of all the models.
Indeed, as Carbon Brief explains in detail below, the difference between models and observations turns out to depend largely on what climate model outputs and observational temperature series are used. The 0.3C value is based on a misinterpretation of the paper by the media and was not intended by the authors as an estimate of current model/observation temperature differences.
Other temperature datasets not used by the authors, such as those from NASA and Berkeley Earth, show much smaller model/observation differences than the one used in the paper, and these model/observation difference in turn disappear when model outputs more comparable to how temperature data is actually collected are incorporated, though differences in the implied future carbon budget would still remain.
Daily Mail has this letter today from authors of recent 1.5C carbon budgets paper criticising Graham Stringer for misrepresenting it pic.twitter.com/pwfKGPB0ZA
— Leo Hickman (@LeoHickman) September 21, 2017
Models do not overestimate warming by 0.3C
It all started with one line in the paper, which states that “after 2020…the CMIP5 ensemble-mean human-induced warming is over 0.3C warmer than the central estimate for human-induced warming to 2015″. This referred to the first figure in the paper, which showed the cumulative carbon emissions in 2015 and a similar model value in 2020 associated with that level of cumulative carbon emissions.
There are three problems with this statement and how it has been interpreted.
First, and most confusingly, the authors of the paper are comparing 2015 observations to a 2020 subset of model estimates, using a statistical approach to remove natural variability and isolate the human contribution in the observational data. They did this to illustrate how their carbon budget estimate that excluded variability differed from values inferred by previous model simulations, so it was not an apples-to-apples comparison of warming since the 2020 models have higher atmospheric CO2 concentrations than today.
This exercise, aimed at assessing the remaining carbon budget for aggressive climate targets, such as 1.5C, was not intended to be a detailed comparison of the performance of climate models and observations to-date, and cannot be used to determine if the models are accurately estimating the climate response to increased atmospheric concentrations of CO2 and other greenhouse gases.
A more straightforward comparison to determine how well models and observations agree would be to look at what both observations and models predict during the same time period, as models expect quite a bit of additional warming to occur between 2015 and 2020 associated with increased atmospheric CO2 concentrations. Using the same approach as Millar et al to compare 2015 observations with 2015 model results, the difference shrinks by nearly 50%, from 0.3C down to 0.17C.
Second, the analysis only looks at one dataset (the Met Office Hadley Centre’s HadCRUT). The authors examine how much warming has occurred in this dataset since the period from 1861 to 1880 (their “baseline period”). There are a number of different groups who use different methodologies and slightly different observations to estimate global temperatures since the 1800s. Of these, three datasets go all the way back to 1850: HadCRUT, Cowtan and Way and Berkeley Earth. (NASA and NOAA’s datasets only starts in 1880.)
Both Berkeley Earth and Cowtan and Way datasets show more warming than HadCRUT since the mid-1800s. If the Cowtan and Way dataset were used in the analysis, the difference between observations and models in 2015 would be reduced to 0.11C. If the Berkeley Earth dataset were used, the difference would only be 0.01C. Some of this difference is due to coverage, as the HadCRUT dataset excludes large areas of the Arcticand does more limited infilling of areas with missing data.
Differences between datasets mean that uncertainties in measured temperature data make the comparisons between models and observations much less certain. These differences mostly arise from the period prior to 1900, when the uncertainties in the observational record are the largest. The approach taken by Millar et al is quite sensitive to differences in the early part of the record, though the authors present a range of possible carbon budgets to try and account for this.
Because they focused on the remaining carbon budget necessary to avoid 1.5 C warming, Millar et al had to look at warming since the mid-1800s. Other researchers have looked more directly at the question of model-observation comparisons using approaches that rely much less on the pre-1900 years and have generally found relatively small differences between models and observations. There is a related challenge of just how pre-industrial temperatures are defined, as different values for different groups makes it difficult to pin down.
Third, the comparisons between models and observations in the paper are not comparing like with like. The models used in the paper generate an estimated air temperature slightly above the Earth’s surface for the entire planet. However, in reality we measure air temperature over land and the temperature of the water near the surface over the oceans. This mismatch can be problematic, because in climate models the surface of the ocean is warming noticeably more slowly than the air over the ocean.
To address this, researchers have produced blended model outputs, which combine air temperatures over land with surface water temperatures over the ocean to mirror the way temperatures are actually measured. These model outputs show about 0.08C less warming in 2015 than models that simply use the surface air temperatures globally.
When blended land/ocean model outputs are used the difference between models and observations shrinks even further, with HadCRUT showing 0.09C less warming, Cowtan and Way showing 0.03C less warming, and Berkeley Earth actually showing 0.08C more warming than the average of the climate models. The differences between models and observations for each dataset and each model type–model air temperatures or blended model air/ocean temperatures–are shown in the figure below.
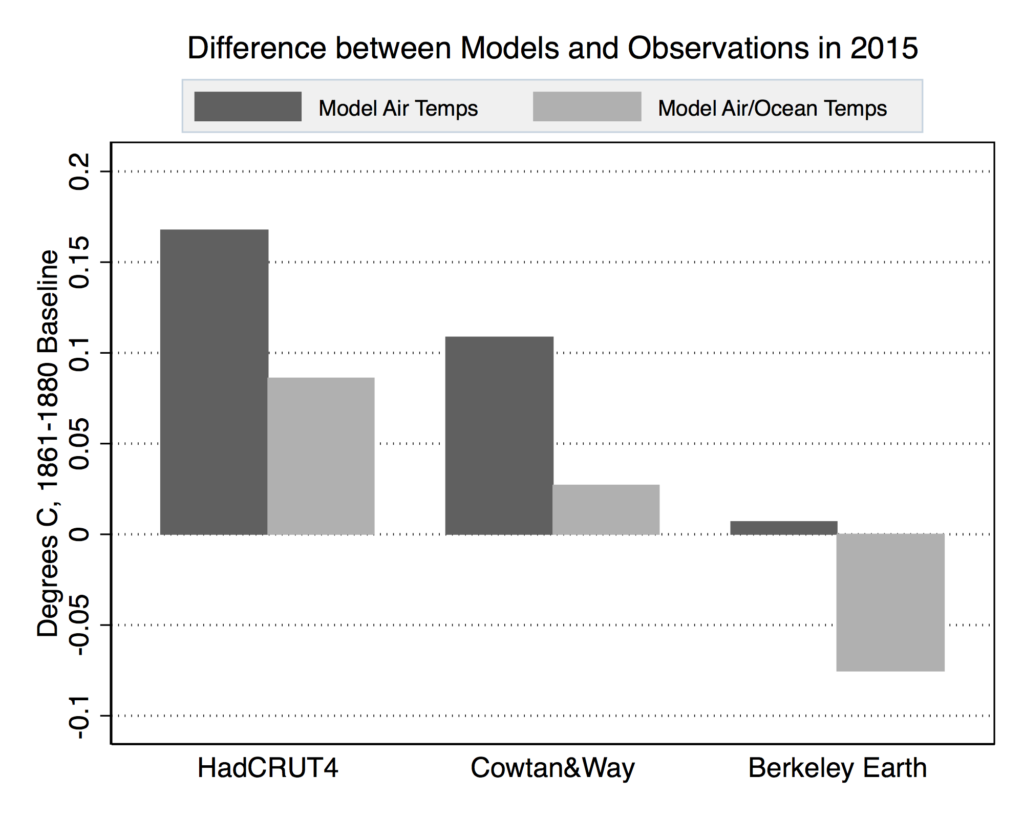
Difference between modeled and observed warming in 2015, with respect to the 1861-1880 average. Observational data has had short-term variability removed per the Otto et al 2015 approach used in the Millar et al 2017. Both RCP4.5 CMIP5 multimodel mean surface air temperatures (via KNMI) and blended surface air/ocean temperatures (via Cowtan et al 2015) are shown. Chart by Carbon Brief.
In the figure above, positive values mean that models are overestimating warming. Negative values mean that models are underestimating warming. The wide range of values suggests that concluding that there is a problem with the models based in this single paper’s analysis may be premature, especially since blended model air/ocean temperatures may provide a more accurate comparison.
Other global temperature datasets, such as NASA and NOAA, are not included in the figure above because their records only go back to 1880, and the paper uses a 1861-1880 baseline period for its analysis. If a more recent 1880-1900 baseline is used, NASA observations actually shows 0.06C more warming than blended model air/ocean temperatures. NOAA shows 0.03C more warming, as shown in the figure below.

Difference between modeled and observed warming in 2015, with respect to the 1880-1900 average. Observational data has had short-term variability removed per the Otto et al 2015 approach used in Millar et al 2017. Both RCP4.5 CMIP5 multimodel mean surface air temperatures (via KNMI) and blended surface air/ocean temperatures (via Cowtan et al 2015) are shown. Chart by Carbon Brief.
Dr Gavin Schmidt, the NASA Goddard Institute for Space Studies director, has made a similar argument on Twitter, suggesting the results will be quite sensitive to the dataset chosen.
Headline claim from carbon budget paper that warming is 0.9ºC from pre-I is unsupported. Using globally complete estimates ~1.2ºC (in 2015) pic.twitter.com/B4iImGzeDE
— Gavin Schmidt (@ClimateOfGavin) September 20, 2017
Comparing models and observations
To compare climate model projections with observations since the late 1800s, the simplest approach is just to overlay the two time-series. Carbon Brief’s figure below shows blended model air/ocean temperatures from the models featured in the 2013 IPCC report. The black line represents the average of all the climate models, while the grey area shows the two-sigma range of model values (e.g. the 95% confidence interval).
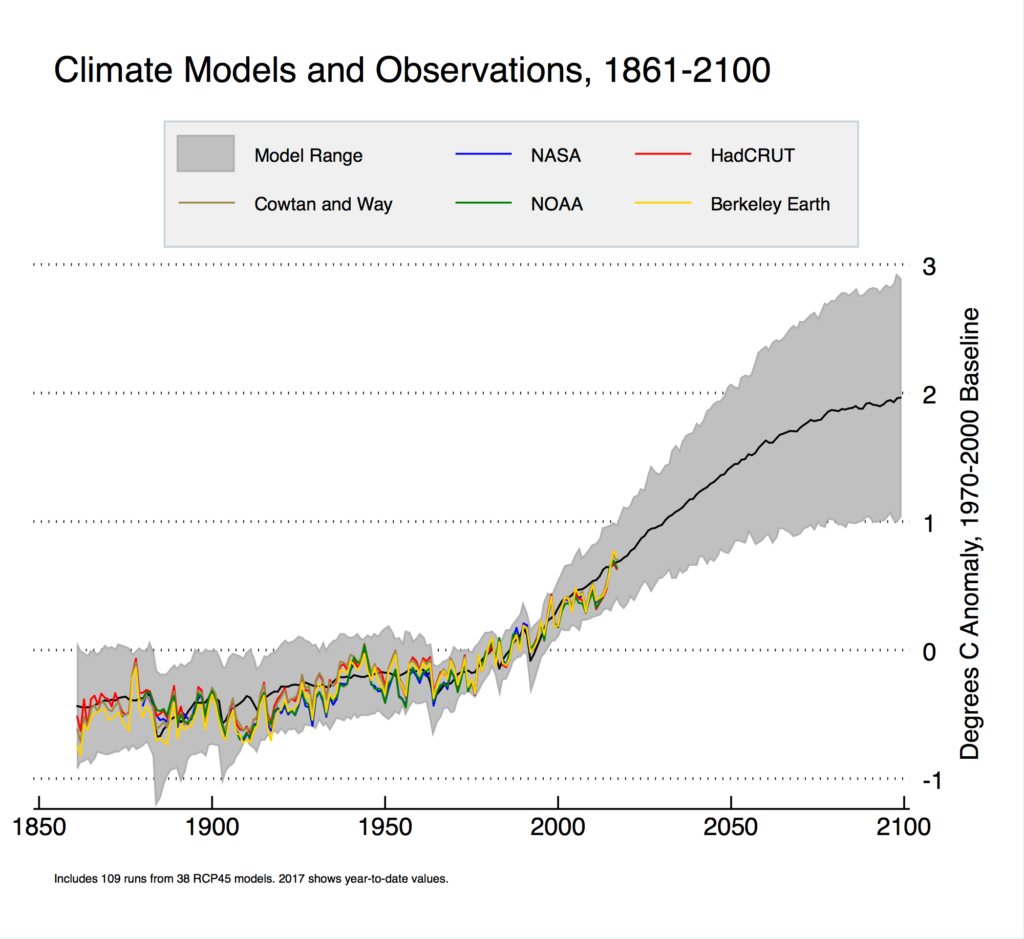
RCP4.5 CMIP5 multimodel mean anomalies (in black), two-sigma model range (in grey), and observational temperature records from NASA, NOAA, HadCRUT, Cowtan and Way, and Berkeley Earth from 1861 to 2100. Model data uses blended land/ocean fields. NASA and NOAA data begins in 1880. A preliminary value for 2017 is based on temperature anomalies through the end of July. Chart by Carbon Brief.
The coloured lines in the figure above show annual measured temperatures from the five different major global temperature records. While there are a few periods where models and observations diverge – around 1910 and the early 2000s, for example – current temperatures for 2015, 2016 and the first half of 2017 are pretty close to the multi-model mean.
The figure below zooms in on the modern warming period post-1970s, when atmospheric greenhouse gas concentrations have increased rapidly. The dips in the model average are due to large volcanoes, such as El Chichon in 1982 and Pinatubo in 1991.
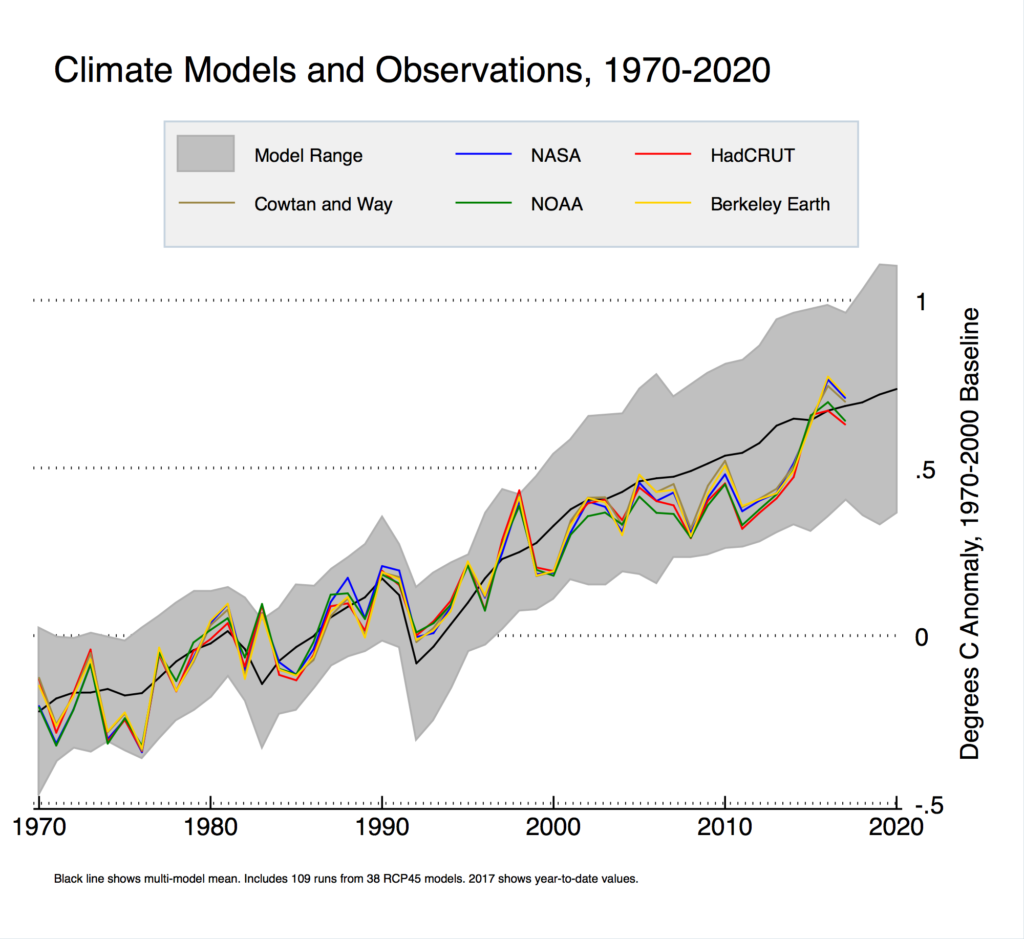
RCP4.5 CMIP5 multimodel mean anomalies (in black), two-sigma model range (in grey), and observational temperature records from NASA, NOAA, HadCRUT, Cowtan and Way, and Berkeley Earth from 1970 to 2020. Model data uses blended land/ocean fields. A preliminary value for 2017 is based on temperature anomalies through the end of July. Chart by Carbon Brief.
An apparent slowdown of the rise in temperatures can be seen in the early part of the 21st century. There is a potential disagreement with climate models that show no slowdown in warming, though observations remain within the model uncertainty range. A number of different studies have examined the causes and implications of this model/observation disagreement, with a recent paper in Nature neatly reconciling all the explanations.
How the rate of warming has compared between climate models and observations can be examined by looking at the trends in both. The figure below shows the rate of warming in celsius per decade both for the period from 1880 to 2016 (when all five records are available) and 1970 to 2016. The black error bars show the 2-sigma range of model trends for each period, as well as the uncertainty in observational trends.
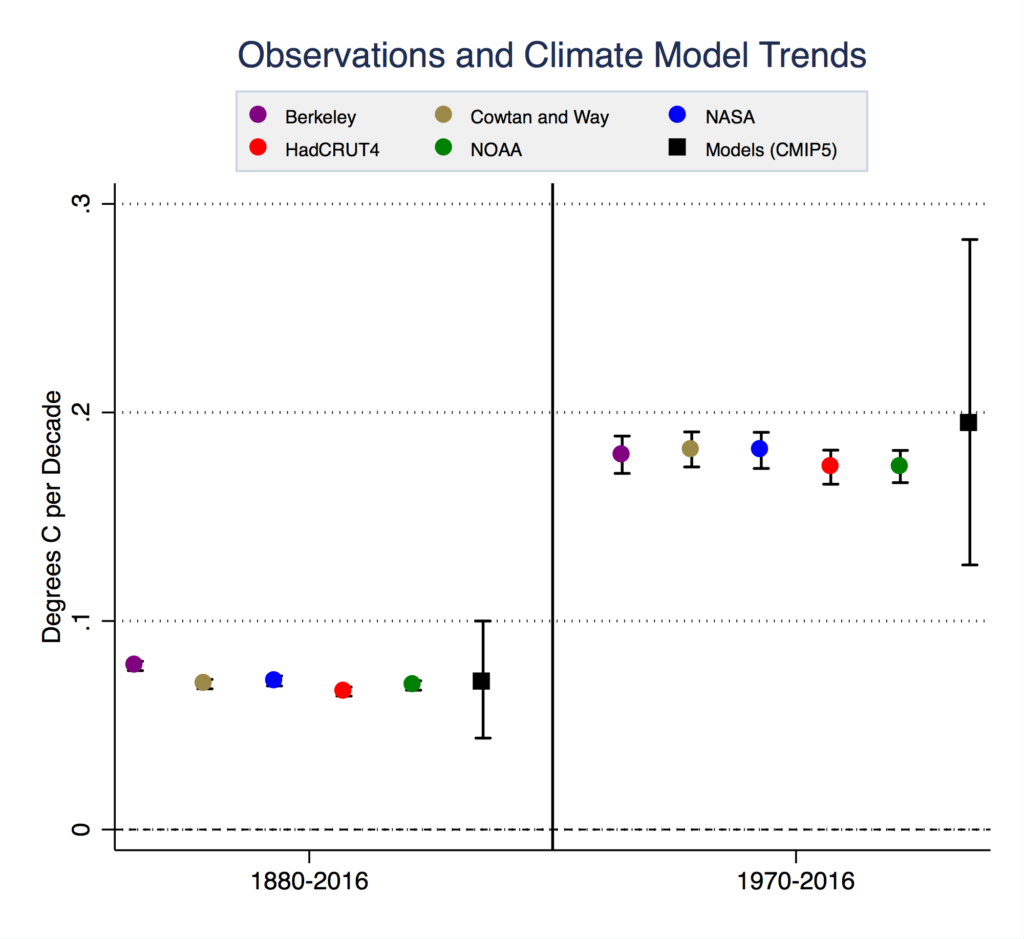
RCP4.5 CMIP5 multimodel mean trend (in black) and observational temperature trends from NASA, NOAA, HadCRUT, Cowtan and Way, and Berkeley Earth. Error bars represent the 95% confidence interval of model trends, and the trend uncertainty for observational records. Model data uses blended land/ocean fields. Chart by Carbon Brief.
Over the 1880-2016 period, models and observations are generally quite close, with some observations showing more warming than models and some showing less. The Berkeley Earth record shows the most warming, at a rate around 11% faster than the model average. NASA’s record warms 1% faster than the models, while Cowtan and Way warm 1% slower than the models. NOAA’s record shows 2% slower warming, while HadCRUT trails the pack with 6% slower warming.
Since 1970, models on average predict around just over 0.19 C warming per decade globally. Observations show a bit less warming over the modern period, ranging from 0.17C to 0.18C per decade. Over this period, the model average predicts between 6% and 11% more warming than has actually been observed. However, those models that predict a bit less warming since 1880 or 1970 don’t necessarily show less warming in 2100 compared to today, so it is difficult to draw firm conclusions about the sensitivity of climate to greenhouse gases, or which models are more accurate, solely based on the historical surface temperature record.
Conclusion
The results of model/observation comparisons differ greatly based on the dataset used, the model outputs analysed – model air temperatures or blended model air/ocean temperatures – and the time period examined. While the Millar et al study points out some sizable differences between the HadCRUT record and the model air temperature field, this should not be generalised to conclude that warming projections are unreliable or that warming has been ‘exaggerated by faulty models’. The paper’s real focus is on carbon budgets and carbon cycle accuracy, rather than model/observation comparisons of the warming associated with increased atmospheric greenhouse gas concentrations, and their results have little bearing on our understanding of climate sensitivity.
Additionally, Carbon Brief has asked Prof Piers Forster, one of the authors, to further clarify some of the paper’s findings and methodologies in light of the media coverage:
Our paper focussed on carbon emissions and the feasibility of limiting future warming to 1.5C. We concluded that we would only succeed with strengthened policies to bring rapid and sustained emission reduction.
We made estimates of the allowable future emissions of carbon before we pass 1.5C. To do this we made assumptions about past warming, exploring different levels of warming from 2015 to address the role of uncertainty in historic warming levels. Readers should note that our method is only one way of computing the budget. The IPCC special report on 1.5C will need to consider it alongside other lines of evidence. The usefulness of the carbon budget concept will also likely be assessed given its inherent uncertainty due to the uncertain historic warming.
I think some press reporting is misleading as our paper did not assess climate impacts or climate model performance. Rather, our paper confirms the need for much increased urgent action from around the world if society stands a chance of limiting warming to 1.5C.