Nothing we do (or try to do) seems to be able to stop carbon dioxide from accumulating in the atmosphere. And, as a consequence, nothing seems to be able to stop climate change. With the situation getting worse and worse (see here for an example), we are hoping that some kind of international agreement can be reached to limit emissions. But, after many attempts and many failures, can we really expect that next time – miraculously – we could succeed?
Another line of thought, instead, has that depletion will save us. After all, if we run out of oil (and of fossil fuels in general) then we’ll have to stop emitting greenhouse gases. Won’t that solve the problem? In principle, yes, but is it going to happen?
The gist of the debate on the future of fossil fuel production is that, despite the theoretically abundant resources, the production rate is strongly affected by diminishing economic returns generated by depletion. This factor forces the production curve to follow a "bell shaped", or "Hubbert," curve that peaks and starts declining much before the resource runs out, physically. In practice, most studies that take into account the diminishing economic returns of production arrive to the conclusion that the IPCC scenarios often overestimate the amount of fossil carbon that can be burned (see a recent review by Hook et al.). From this, some have arrived to the optimistic conclusion that peak oil will save us from climate change (see this post of mine). But that’s way too simplistic.
The problem with climate change is not that temperatures will keep smoothly growing from now until the end of the century. The problem is that we will run into big troubles much earlier if we let temperatures rise over a certain limit. Sea level rise, oceanic acidification, and land desertification are just some of the problems, but a worse one could be the "climate tipping point." That is, over a certain point, the rise in temperatures would start to be driven by a series of feedback effects within the ecosystem and climate change would become unstoppable.
We don’t know where the climate tipping point could be situated, but there exists a general agreement that we should keep temperatures from rising above 2 deg. C to avoid a catastrophe. From the 2009 paper by Meinshausen et al. we can estimate that, from now on, we should not release more than about 1×10+12 t of CO2 in the atmosphere. Considering that we have released so far some 1.3×10+12 t of CO2 (source: global carbon project), the grand total should not be more than about 2.3×10+12 t of CO2.
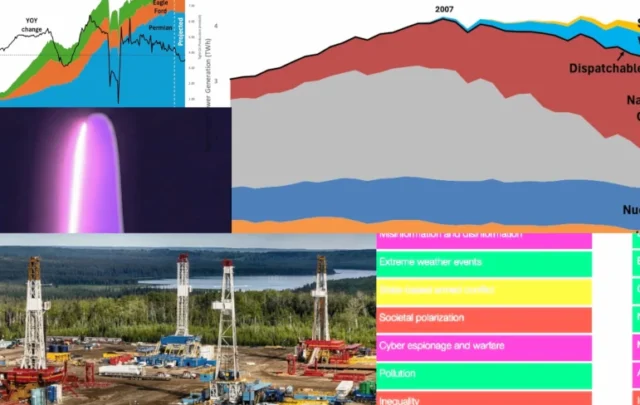
So, what can we expect in terms of total emissions considering a "peaking" scenario? Let me show you some data from Jean Laherrere, who has been among the first to propose the concept of "peak oil."
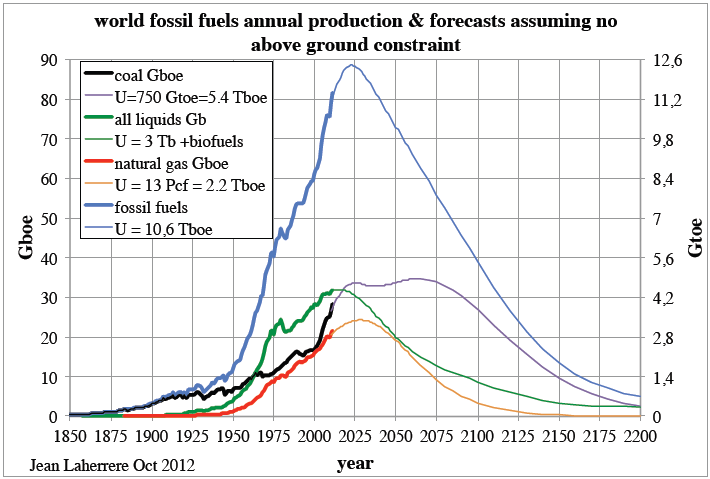
In this figure, made in 2012, Laherrere lists the quantities of fuels burned, with a "U" ("ultimate") measured in Tboe(Terabarrels of oil equivalent, see below for the conversion factors used). As a first approximation, if all the emissions were from crude oil, we would emit some 4.5×10+12 t of CO2. Things change little if we separate the contributions of the three fossil fuels. Crude oil, alone, would produce 1.3×10+12 t of CO2. Coal would produce 2.810+12 t, and natural gas 0.95×10+12 t. The final result is nearly exactly 5×10+12 t of CO2.
In short, even if we follow a "peaking" trajectory in the production of fossil fuels, we are going to emit around twice as much carbon dioxide as what is considered at present to be the "safe" limit.
Of course, there are plenty of uncertainties in these calculations and the tipping point may be farther away than estimated. But it could also be closer. And we should take into account the problem of the increasing CO2 emissions per unit of energy as we progressively move toward dirtier and less efficient fuels. So, we are really toying with disaster, with a good chance to run straight into a climate catastrophe.
This conclusion holds in the assumption that the "peaking" scenario is not too optimistic in the amount of fossil fuels that can be produced and burned in the future. But these scenarios are normally termed "pessimistic" in mainstream studies, so that little would change as long as we work with nearly symmetric, bell shaped curves. At best, we can assume that peaking could take place a few years earlier than in Laherrere’s estimate; but that still leaves us facing the very real possibility of a climate catastrophe.
Could we, instead, consider a different shape for the production curve? The symmetric "bell shaped" or ("Hubbert") curve is the result of the assumption that extraction is performed in a fully functioning economy. But, once the economic system starts unraveling, a series of destructive feedbacks accelerates the decline. This is the "Seneca collapse" that generates an asymmetric production curve (the "Seneca cliff").
A Seneca shaped production curve would considerably reduce the amount of fossil carbon that can be burned in the future. Tentatively, if the collapse were to start within the next 10 years and it were to cut off more than half of the potential coal production, then, we could remain within the safe limit. Hubbert can’t save the ecosystem, but Seneca could (maybe).
But, even if that came to pass, a Seneca collapse is a major disaster in itself for humankind, so there is little to rejoice at the thought that it could save us from runaway climate change. In practice, the only hope to avoid disaster lies in taking a more active role in substituting fossils with renewables. In this way, we can force the production of fossil fuels to go down faster, but without losing the energy supply we need. It is possible – it is a big effort, but we can do it if we are willing to try (see this paper by Sgouridis, Bardi and Csala for a quantitative estimate of the effort needed)

Cliff image via shutterstock. Reproduced at Resilience.org with permission.
____________________________________
Unit conversion
One Boe of crude oil = 0.43 t CO2 (http://www.epa.gov/cleanenergy/energy-resources/refs.html)
One Boe of coal = 0.53 t CO2 (calculation from https://www.unitjuggler.com/convert-energy-from-Btu-to-boe.html?val=1000000 and from http://www.epa.gov/cpd/pdf/brochure.pdf
One Boe of natural gas: 0.31 t CO2 (calculation from https://www.unitjuggler.com/convert-energy-from-Btu-to-boe.html?val=1000000 and from http://www.epa.gov/cpd/pdf/brochure.pdf