The US Energy Information Administration recently released its report showing oil consumption by country updated through 2012. Based on this report, it appears that at current high oil prices, demand in both China and India is being reduced. Thus, for those who are wondering how high oil prices need to be, to be “too high,” the answer is, “We are already there. In fact, continued high oil prices are a big reason behind the recessionary forces we are now seeing around the world.”
A big part of China and India’s problems is that they, like the United States and most of Europe, are oil importers. In this post, I also explain why there is a big difference in the impact of high oil prices on oil importing countries compared to oil exporting countries.

Figure 1. Liquids (including biofuel, etc) consumption for China, based on data of US EIA, together with Brent oil price in 2012 dollars, based on BP Statistical Review of World Energy updated with EIA data.

Figure 2. Liquids (including biofuel, etc) consumption for India, based on data of US EIA, together with Brent oil price in 2012 dollars, based on BP Statistical Review of World Energy updated with EIA data.
We can see from Figures 1 and 2 that at $100 per barrel prices, there is a definite flattening in per capita consumption for both India and China. Per capita consumption is used in this analysis, because if total oil consumption is rising, but by less than population is increasing, consumption on average is falling.
Some Other Countries with Declining Consumption
There are many other importing countries with even sharper drops in consumption than China and India. These declines started in the 2005 to 2007 period, as oil prices rose, and continued as oil prices have remained high. One example is Greece:

Figure 3. Liquids (including biofuel, etc) consumption of Greece, based on data of US EIA, together with Brent oil price in 2012 dollars, based on BP Statistical Review of World Energy updated with EIA data.
In fact, all of the PIIGS (Portugal, Ireland, Italy, Greece, and Spain, known for their problems with recession) have shown steep drops in oil consumption:

Figure 4. Per capita oil (“liquids”) consumption for countries known as PIIGS, based on EIA data.
Europe in total shows a somewhat less steep drop in oil consumption than the PIIGS:

Figure 5. Liquids (oil including biofuel, etc) consumption for Europe, based on data of US EIA, together with Brent oil price in 2012 dollars, based on BP Statistical Review of World Energy updated with EIA data.
The US shows a similar drop in consumption to Europe:

Figure 6. Liquids (oil including biofuel, etc) consumption for United States, based on data of US EIA, together with Brent oil price in 2012 dollars, based on BP Statistical Review of World Energy updated with EIA data.
Where is per capita oil consumption rising?
Oil consumption is rising faster than population in many oil exporting countries. If we look at OPEC in total, we see a big upward jump in per capita oil consumption in 2011 and 2012.

Figure 7. Liquids (oil including biofuel, etc) consumption for OPEC, based on data of US EIA, together with Brent oil price in 2012 dollars, based on BP Statistical Review of World Energy updated with EIA data.
In fact, this pattern occurs both in Saudi Arabia, and for OPEC outside Saudi Arabia:

Figure 8 Liquids (oil including biofuel, etc) consumption for Saudi Arabia, based on data of US EIA, together with Brent oil price in 2012 dollars, based on BP Statistical Review of World Energy updated with EIA data.
For Saudi Arabia, 2012 oil consumption per capita is more than five times as much as that of Europe. Outside Saudi Arabia, there is a definite upward bump in consumption, both during the 2008 price run-up and corresponding to the higher price in 2011 and 2012.

Figure 9 Liquids (oil including biofuel, etc) consumption for OPEC ex Saudi Arabia, based on data of US EIA, together with Brent oil price in 2012 dollars, based on BP Statistical Review of World Energy updated with EIA data.
One reason why oil exporters show higher growth in oil consumption than other countries is because oil is becoming more difficult to extract, and because the easiest to extract oil was extracted first. There are often indirect needs for oil as well, such as desalinization to have sufficient water for a growing population, or a new refinery for difficult-to-refine oil. I talk about these issues in my post, Our Investment Sinkhole Problem.
A second reason why oil exporters often show higher growth in oil consumption is because exporters often provide subsidized prices on oil products, so their citizens do not have to pay the full cost of the product. Thus, their citizens do not really experience the high oil prices that most importers do.
A third reason why oil exporters show higher growth when oil high prices are high has to do with all of the money these exporters receive when they sell high-priced oil. The Economist this week has an article “Saudi Arabia risk: Alert – The next property bubble?” It talks about the huge number of office buildings, schools, low-priced homes, and other building projects underway, thanks to a combination of easy credit availability and lots of oil money. The article indicates that citizens rarely put their new-found wealth into paper investments. Instead, a significant part of their wealth ends up in building projects that require oil use.
Norway is an exporter that does not subsidize oil prices (in fact, it has quite a high tax on oil use in private vehicles). It shows higher per capita oil consumption in the past two years, despite higher world oil prices.

Figure 10. Liquids (oil including biofuel, etc) consumption for Norway, based on data of US EIA, together with Brent oil price in 2012 dollars, based on BP Statistical Review of World Energy updated with EIA data.
Brazil is not an oil exporter, but it has been trying to ramp up its production. Its per capita consumption has been rising recently as well.

Figure 11. Liquids (oil including biofuel, etc) consumption for Brazil, based on data of US EIA, together with Brent oil price in 2012 dollars, based on BP Statistical Review of World Energy updated with EIA data.
In fact, Africa in total, Central and South America in total, and the Middle East in total, all show oil consumption rising faster than population, in 2011 and 2012. These are areas that, in total, are oil exporters.
Some very low oil-use countries, such as Bangladesh, are showing rising per capita oil consumption in 2011 and 2012, even with higher oil prices. This could indicate that some manufacturing is shifting to even lower cost areas than China and India.
Australia is showing growing per capita oil consumption, perhaps because of oil’s use in resource extraction and transport.
Why would a drop in per capita oil consumption for oil importers matter?
A drop in per capita oil consumption is a likely sign that oil is becoming increasingly unaffordable. We know that oil is used to make and transport goods. If less oil is used, or if oil use is growing less rapidly than in the past, there is a real chance that an economy is slowing.
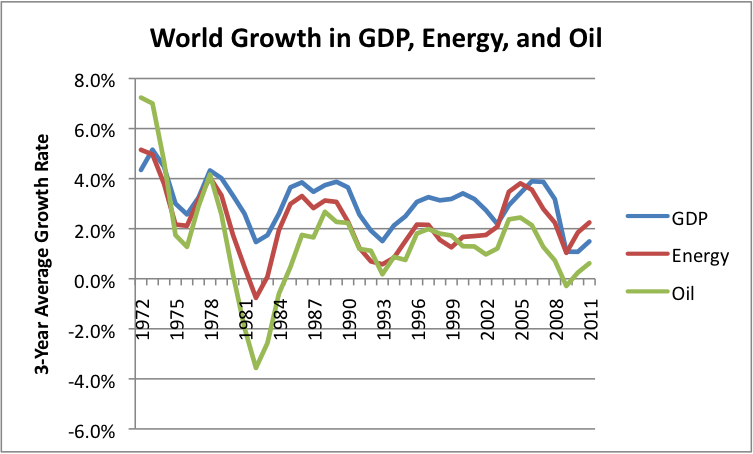
Figure 12. World growth in energy use, oil use, and GDP (three-year averages). Oil and energy use based on BP’s 2012 Statistical Review of World Energy. GDP growth based on USDA Economic Research data.
There are a number of reasons oil consumption may be down. Fewer goods for sale may be being transported, perhaps because European demand is down. Citizens may be driving less in their free time. Or many young people may be unemployed, and be unable to afford to buy a car or motor scooter. Any of these changes could mean a slowing economy.
Obviously, there are situations in which reduced oil consumption doesn’t mean a slowing economy. A shift from manufacturing to a service economy could lead to lower oil consumption; a shift toward more fuel-efficient cars and trucks could lead to lower oil consumption. But these changes tend to take place slowly over time, not all at once, when oil prices rise.
Another way oil consumption can be reduced is if a country has in the past generated electricity using oil, and such generation is shifted to another fuel, such as natural gas. This type of change is being made in Greece, but seems unlikely in China and India. Similarly, if homes are heated with oil, sometimes an alternate fuel can be used, reducing oil consumption. China and India aren’t areas where oil has traditionally been used to heat homes, though.
In general, though, sharp reductions in oil consumption in a growing economies, such as China and India, are cause for concern, if one was expecting growth. Are high oil prices stressing the economy?
United States and European Oil Imports
The US oil consumption pattern looks very much like that of an oil importing nation, under stress from high oil prices. Recently, there has been a lot of publicity about higher US oil production, but this does not really change the situation. If we look at US oil consumption and production (actually “liquids” production and consumption since all kinds of stuff including biofuels are included), we see that the US remains an oil importer. In fact, it is still a long way from becoming an oil exporter. (And, importantly, oil prices aren’t down by much, and high oil prices are our real problem.)

Figure 13: US Liquids (oil including natural gas liquids, “refinery expansion” and biofuels) production and consumption, based on data of the EIA.
The European oil import situation is worse than the United States liquids situation, and no doubt part of its current economic problems. A graph of its recent production and consumption is as follows:

Figure 14: European Liquids (oil including natural gas liquids, “refinery expansion” and biofuels) production and consumption, based on data of the EIA.
Difference Between Oil Importers and Exporters – Additional thoughts
The cost of extraction varies widely by country and by field within country. In order to provide a large enough quantity of oil in total, the world price of oil has to be high enough to provide an adequate profit for the highest cost producer. Clearly, if every oil company charged the price needed for the highest cost producer, many would be collecting far more than they need for future oil extraction and payment of dividends. Where does all of this extra money go?
To a significant extent, this money is “latched onto” by governments. In the case of oil exporting countries, governments often own oil companies directly. But even if they don’t, governments tax oil extraction at very high rates, to make certain that the government gets the benefit of any extra revenue available. Sometimes Production Sharing Agreements are used. A chart by Barry Rodgers Oil and Gas consulting (Figure 15 below) shows that for many oil exporting countries, the government “take” is 70% to 90% of operating income (that is, net of direct expenses of extraction).
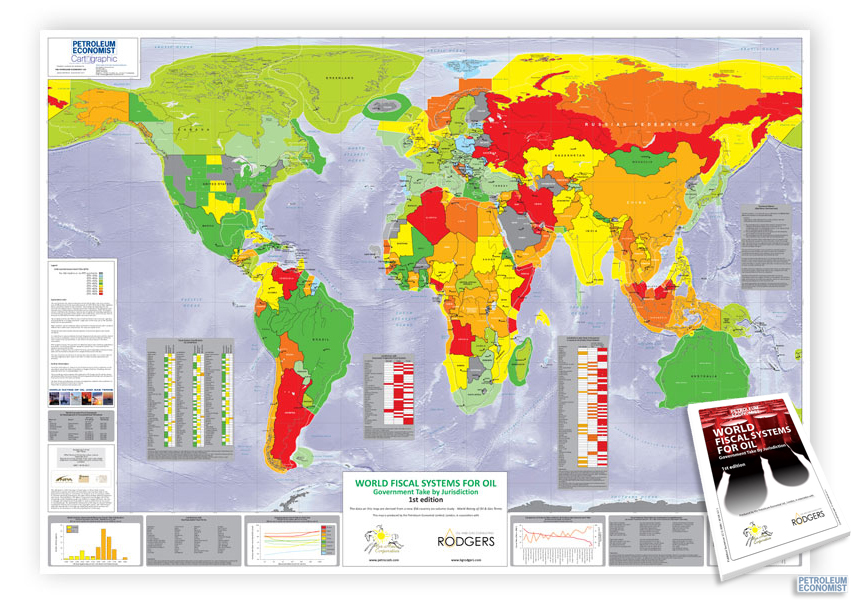
Figure 15. Chart showing “government take” as a percentage of operating income by Barry Rodgers Oil and Gas Consulting.
Even in the case of the United States, the government take is significant. Barry Rodgers, in an article in the May issue of Oil & Gas Journal, calculates that for tight oil (such as oil from the Bakken), the average government take is $33.29 per barrel. This compares to $19.50 per barrel, for tight oil extracted in Canada. These amounts include payments to state governments as well as the federal government. If extraction costs are low, as in the case of Alaska, the state adjusts its tax accordingly.
Oil importing countries would like the world to have a level playing field with respect to the price of oil. In the real world, this doesn’t happen. Oil exporting countries get huge benefits in the form of the tax they collect from the oil they sell abroad. Often, this tax revenue amounts to 70% or more of a country’s tax budget from all sources. If oil exporters have small populations, they can afford to offer oil at subsidized rates to their own populations. (If they have large populations relative to exports, offering a subsidized price would soon eliminate all exports!)
Economists would like us to believe that many of the differences between oil exporters and oil importers will even out because money spent by oil exporters to purchase goods and services together with purchases of government bonds from oil importers should mostly make their way back to oil importing countries. There are several differences though:
(a) Oil exporting countries can choose to charge their citizens a lower price oil, thus insulating them from the high world oil price, and raising their demand for oil (that is, the amount of oil they can afford). This higher demand allows these countries to increase their oil consumption, even as other countries, subject to higher prices, reduce theirs. Evidence presented in this article suggests that this, in fact, is happening at high prices.
(b) Oil exporting countries need not tax the income of individuals and businesses, or institute value added taxes, because their tax needs are mostly met by the taxes they collect on oil that is exported. This gives them a competitive advantage in making goods from oil or natural gas for international trade.
(c) Since world oil supply is limited, the oil that the oil exporting countries are able to purchase at subsidized prices (even if to build unneeded office buildings in Saudi Arabia) is removed from the world market, further driving up oil prices, and leaving less for other countries to consume.
(d) The money that is spent by oil exporters rarely makes it back to the salaries of individuals in oil importing nations who are faced with buying high-priced oil products. In fact, I have shown that in times of oil prices, Unites States salaries tend to stagnate:
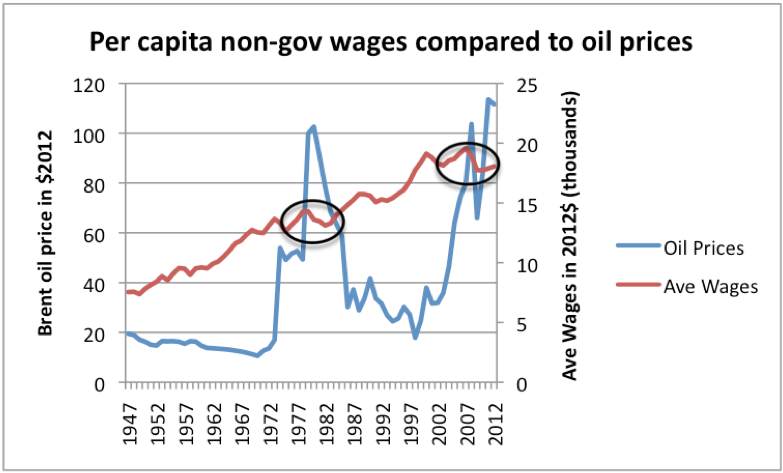
Figure 16. High oil prices are associated with depressed wages. Oil price through 2011 from BP’s 2012 Statistical Review of World Energy, updated to 2012 using EIA data and CPI-Urban from BLS. Average wages calculated by dividing Private Industry wages from US BEA Table 2.1 by US population, and bringing to 2012 cost level using CPI-Urban.
At best, the money makes it back to financial institutions and corporations selling products such as exported grain. The higher demand for grain tends to raise food prices, putting another stress on the economy.