
My dear old friends from McKinsey & Company have come up with their view of the world’s top technologies. As a historical note, beginning in the mid 1980’s and through the 1990’s, McKinsey was instrumental in irreversibly damaging the U.S. oil and gas industry. McKinsey was hired by the scared oil & gas managers to do a hatchet job on the researchers and operations staffs across the U.S. and – for a lot of money – did a awesomely devastating job.
Suffice is to say that the oil and gas industry in the U.S. will never again have the same breadth and depth, ever. This statement of fact has some interesting connotations when it comes to operating in the ultra-difficult, super-inhospitable environments, which seem to enter into our future. In fairness to McKinsey and several other consulting outfits, they acted as expensive external tools used by management to execute (no pun intended) the already agreed upon plans, as in: "What do you want me to conclude, boss?"
But I digressed. So here is how the research arm of McKinsey, their Global Institute (MGI), sees potential benefits from a variety of technologies:
 |
| By 2025, these 12 technologies identified by McKinsey have the potential to deliver economic value of up to $33 trillion a year worldwide. Source: The New York times. Image based on Exhibit E3 in McKinsey’s 178 page report, "Disruptive Technologies: Advances that will transform life, business, and the global economy." |
The sumptuous, 178-page report by MGI is full of colors and smart information that ought to daze you as it dazed me until I came across Exibit E2, and in it a boast about "3x increase in efficiency of U.S. gas wells between 2007 and 2011 [due to] advanced oil and gas exploration and recovery":
 |
| Among others, Exhibit E2 in the MGI Report claims that the efficiency of U.S. gas wells has increased by a factor of three between 2007 and 2011. |
Suddenly, I grew curious just how exactly the three-fold increase of efficiency of U.S. gas wells was calculated. Would this be a 3-fold increase in the efficiency of gas production per new well compared with old wells? Which new well? What old wells? Over what interval of time? A month? A year? How does one define "advanced"?
Since I do not have the resources of MGI to carefully analyze the entire gas production in the U.S., let me focus on Texas, the largest gas producer in the U.S. Luckily, the Texas Railroad Commission provides easily accessible well production data which allowed me to construct the following plots:
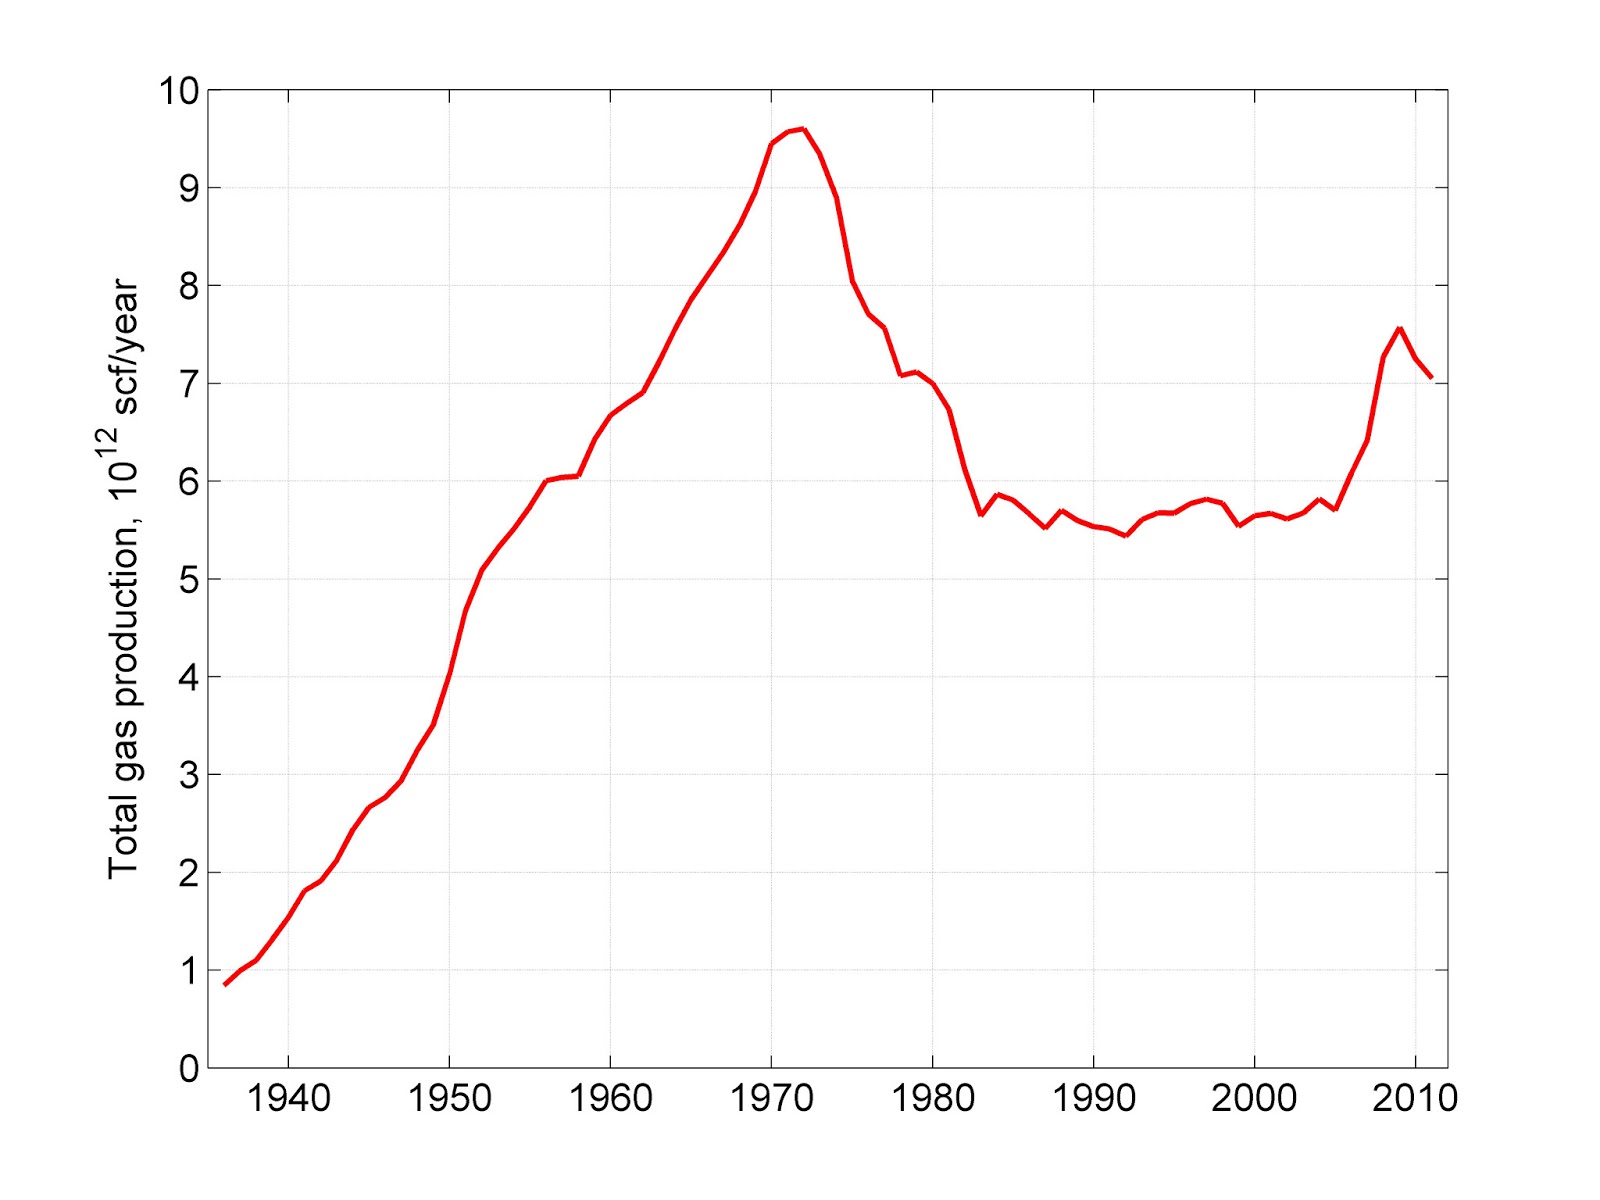 |
| The total rate of gas production in Texas over the last 80 years in Tscf/year. Note that today Texas produces 1/3 of U.S. gas consumption. Also note the fundamental Hubbert peak in 1972 or so. The most recent, separate peak is due to a new resource: The Barnett Shale. This recent production increase was achieved by drilling some 16,500 mostly horizontal wells, and the average production per Texas gas well continued to decline as shown in the next plot. Data source: Texas Railroad Commission. |
 |
| Production rate of an average gas well in Texas in millions of standard cubic feet per day versus time. This figure was obtained by dividing the total gas production rate reported in Texas for a given year by the number of active wells in the same year. If the current trend of production decline continues, an average gas well in Texas will produce nothing 27 years from today. Data source: Texas Railroad Commission. |
One might argue that this plot is not definitive, because the production decline in tens of thousands of older gas wells more than offsets the new production from the fewer new, more productive wells. So how about plotting an increment of production in a given year, divided by the number of new wells that were put on production in the same year? Well, here it is:
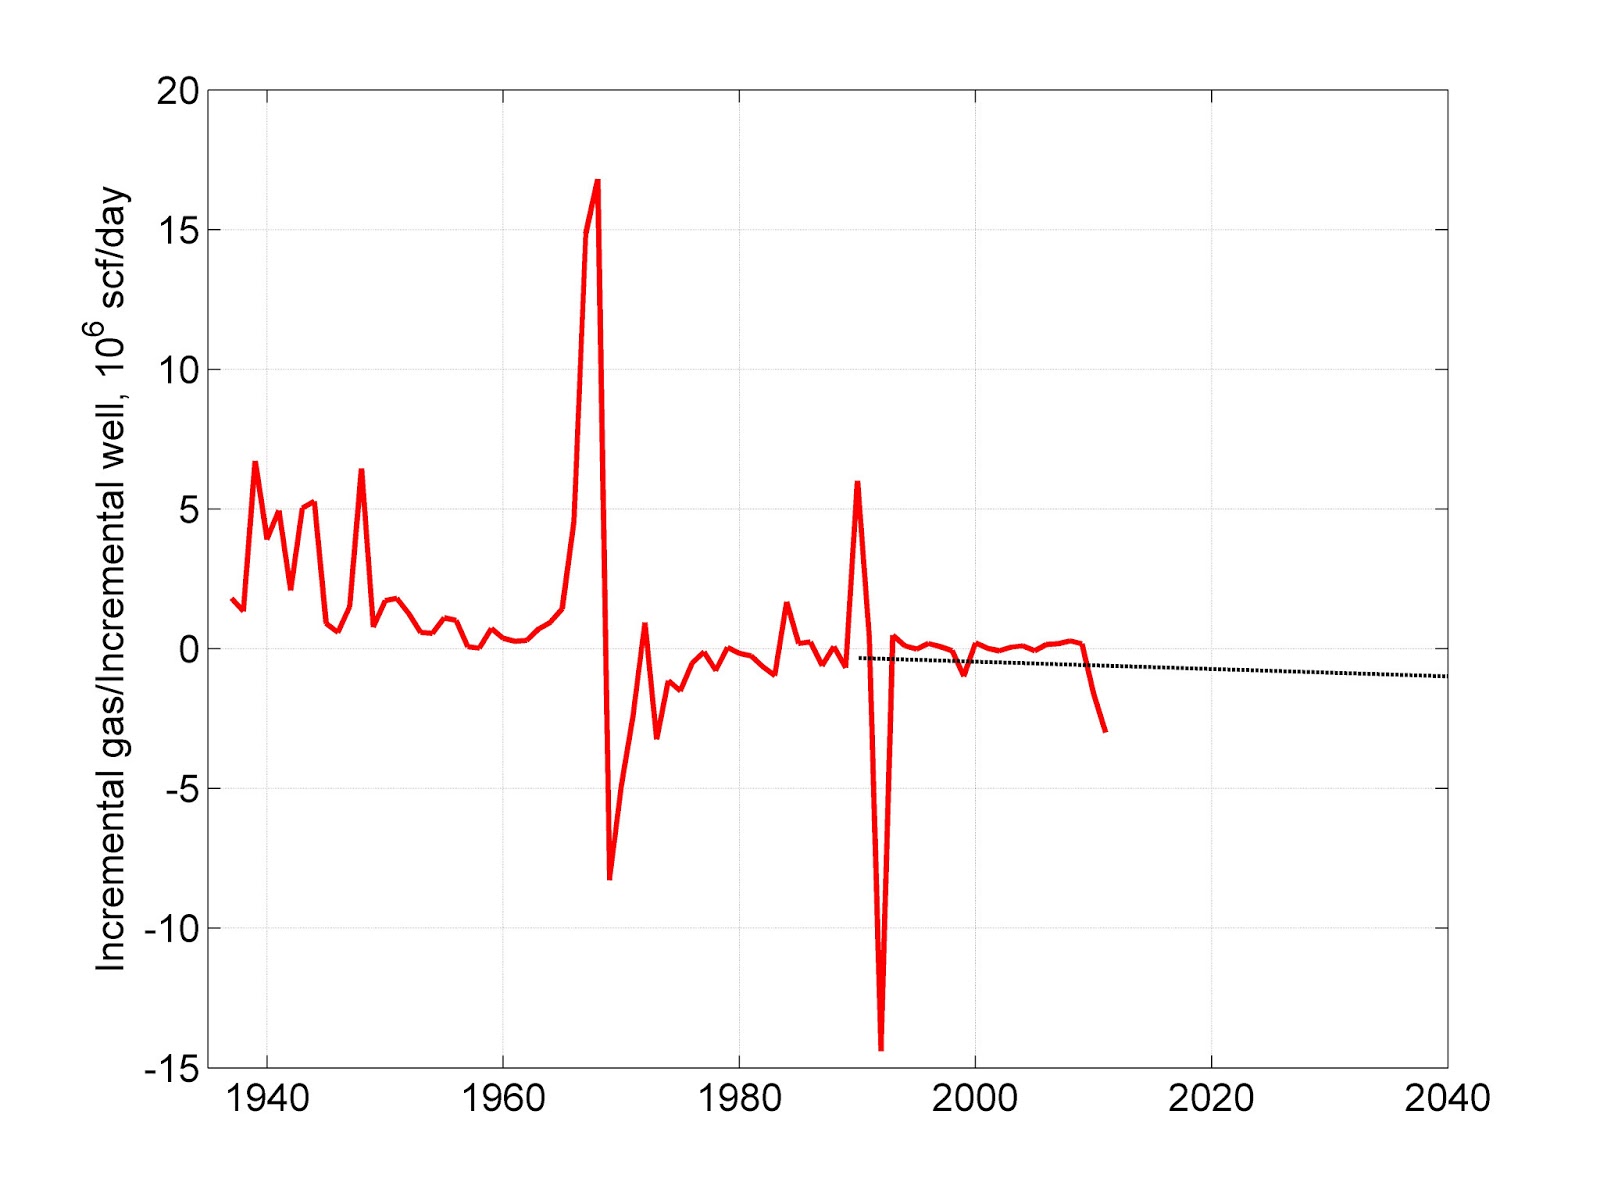 |
| Incremental gas production rate in a given year per incremental well that came on line in the same year. The big spike in the 1970’s is a singularity. If one disregards the second singularity in the early 1990’s, the incremental gas production per incremental gas well in Texas has been either constant or slowly declined over the last 30 years. There was no3X increase of productivity as stated in the MGI report. The only explanation for the MGI claims I can think of is that the flash, initial production from the new massive horizontal wells is many times more that from the older wells. But these horizontal wells also decline much faster, at 20-40% per year. Thus, MGI experts may be confusing a few individual trees with a large forest. Note that this plot approximates the derivative, dq/dn, q being the gas production rate and n the number of active gas wells; hence the spikes or singularities. |
Now, let’s look at the total production of dry natural gas in the U.S. since the beginning of accounting:
 |
||
| Historic production of dry natural gas in the U.S. resolved into several Hubbert cycles. One EJ/year is about 1 Tscf/year. Nothing short of miracle, the U.S. is the only country on the Earth able to create a secondary Hubbert cycle that was almost as large as the fundamental one that peaked in 1971. Much of the production rebound came from offshore wells in increasingly deep water. The recent shale and tight gas revolution thus far has added the rightmost spike. Note that the sum of the current Hubbert cycles declines very rapidly in the near future. Therefore, without continued incredibly intensive drilling, the U.S. will not be able to maintain its current gas production. |
As the plot above shows, petroleum engineers in the United States, created a miracle and maintained essentially the 1970 peak level of gas production for another 40-50 years. This epochal achievement has been largely unnoticed by the public. However, the laws of nature being what they are, will not permit a continuation of the past exponential increase of production rate:
 |
| This semilogarithmic plot of gas production rate in the U.S., shows the uninterrupted exponential increase of the rate for 80 years (the red line denotes exponential growth at 6.6 %/year). Note that production rate has stabilized after 1970. This curve reflects the miracle of U.S. gas technology. This miracle was not duplicated by any other country on the Earth, but there is no 3x growth of well efficiency anywhere. |
So far, I have shown you that the gas production claims in the McKinsey report seem to be exaggerated. I could repeat the same analysis for oil production, but I will spare you. Why spend so much time chasing nonsense?
But wait, there is more insidious nonsense. Let’s look at the MGI claims that the mobile internet, automation of knowledge work (as in layoffs of professionals), internet of things (as in shutting down small stores around the world), cloud, advanced robotics (as in layoffs of industrial workers), etc., will increase the current global GDP of roughly 70 trillion USD by 50%.
What do these technologies have in common? Oh, yes, they all use astronomical quantities of electricity and other forms of mostly fossil fuel power, as well as clean water and rare-earth metals. Without the cheap, reliable, uninterrupted fossil fuel power, ample clean water, and more rare metals than exist on the Earth, the projected growth of these resource-devouring technologies will remain on the glossy pages of MGI reports. So how does one square their estimate that the fundamental enabling technologies (oil and gas exploration and production) will contribute a measly 0.6 trillion of U.S. dollars, but their high-order derivatives will contribute tens of trillions of dollars? Isn’t it all upside down? Like an inverted pyramid of the increasingly imaginary activities of our society, such as insurance and financial services?
 |
| An inverted pyramid of activities of a modern society. Those that matter the most, agriculture and forestry, mining, oil & gas recovery , and utilities are at the very bottom in terms of their importance, while finance is at the top. No wonder that this pyramid is unstable and must tip over. Image adpated from Dr. Kurt Cobb, www.resilience.org/stories/2007-07-29/upside-down-economics |
In summary, there is much more to life than staring at your iPhone that is connected to the Cloud and the Internet of Things. Too many experts from McKinsey and elsewhere seem to think that life is like an iPhone screen. But here is the bad news: Life does not care about iPhones, iPads, and similar. Life will go on regardless and the upside-down pyramid will fall as it must, no matter how hard people like me and their children will try to slow down this fall.
Ipad image via leondel/flickr


