
In this paper, I briefly review recent global crude oil and liquids production numbers, and I review the Export Land Model (ELM). I also introduce the concept of the Export Capacity Index (ECI), which is simply the ratio of total petroleum liquids production to liquids consumption in net oil exporting countries. I then compare the ELM to actual case histories, and I discuss Global Net Exports of oil (GNE) and what I call Available Net Exports (ANE), or GNE less the Chindia (China + India) region’s combined net oil imports.
Recent (2002 to 2011) Global Crude Oil and Liquids Production
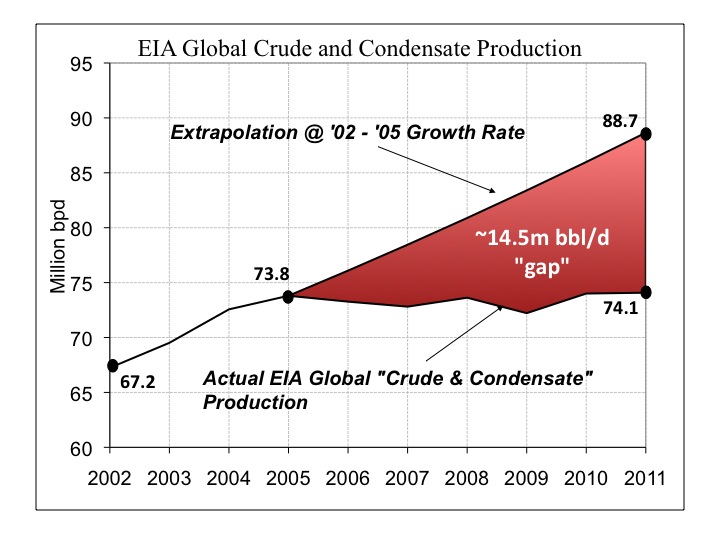
The following chart, Figure One, shows the EIA’s (US Energy Information Administration) numbers for annual global crude oil production (crude + condensate) for 2002 to 2011 inclusive. The area shaded in red is the gap—close to 15 mbpd (million barrels per day)–between where we would have been globally at the 2002 to 2005 rate of increase in production versus actual production in 2011.
Annual global (Brent) crude oil prices approximately doubled from 2002 to 2005, rising from $25 in 2002 to $55 in 2005, and then they doubled again, rising from $55 in 2005 to $111 in 2011, with one year over year decline, in 2009.
Note the strong production response to the first price doubling versus the minimal increase in production in response to the second price doubling, although it does appear that annual global crude oil production exceeded 75 mbpd in 2012.
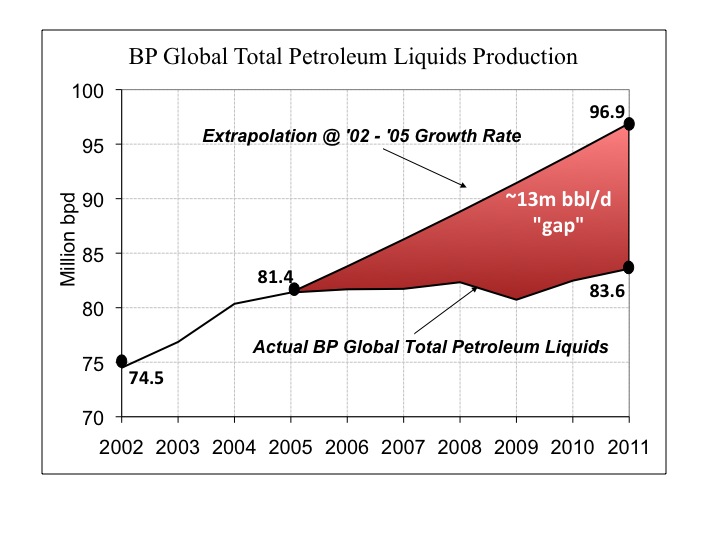
The following chart, Figure Two, shows BP’s numbers for annual global total petroleum liquids production (crude + condensate + natural gas liquids) for 2002 to 2011 inclusive. The area shaded in red is the gap—about 13 mbpd–between where we would have been globally at the 2002 to 2005 rate of increase in production versus actual production in 2011.
The following chart, Figure Three, shows the EIA’s numbers for annual global total oil supply (total petroleum liquids production + refinery gains + biofuels) for 2002 to 2011 inclusive. The area shaded in red is the gap—about 14 mbpd–between where we would have been globally at the 2002 to 2005 rate of increase in production versus actual production in 2011.

Export Land Model (ELM) and the Export Capacity Index (ECI)
In early 2006, I proposed a simple model to help me to understand, and to then explain, what I call “Net Export Math.” I stipulated that a hypothetical country called “Export Land” showed a steady increase in production of 5%/year, with consumption increasing at 2.5%/year, until they hit a production peak of 2.0 mbpd (million barrels per day), with consumption equal to half of production at peak. Production then fell at 5%/year, but consumption continued to increase.
The following chart, Figure Four, shows production (top line), consumption (in red) and net exports (in green) for Export Land from 1990 to 2010, assuming a production peak in 2000. So, to summarize, consumption increased at 2.5%/year from 1990 to 2010. Production increased at 5%/year from 1990 to 2000, and then production declined at 5%/year from 2000 to 2010.
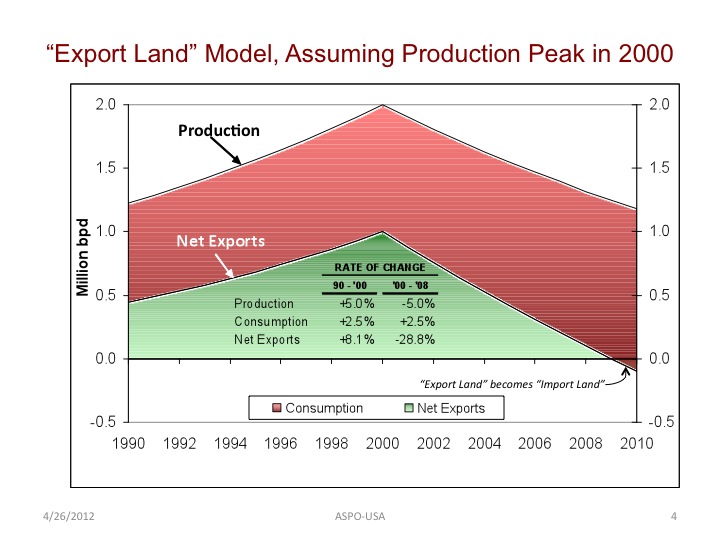
Note that the rate of increase in net exports exceeded the rate of increase in production, on the upslope, from 1990 to 2000, but note that on the downslope even though the production decline rate was only 5%/year from 2000 to 2008, the net export decline rate was almost 30%/year from 2000 to 2008.
Although the “Export Land” region would still be producing close to 1.3 mbpd in 2009, versus 2.0 mbpd in 2000, consumption was equal to production in 2009, resulting in zero net oil exports, and they became a net importer in 2010.
Based on the ELM, given an ongoing production decline in an oil exporting country or basically flat production, we can conclude that unless consumption falls at the same rate as, or at a rate faster than, the production decline rate, the resulting net export decline rate will exceed the production decline rate, and the net export decline rate will accelerate with time.
Furthermore, given an accelerating net export decline rate, the bulk of post-peak Cumulative Net Exports (CNE) are shipped early in the decline phase. In the case of the ELM, one third, or three years, of the way into the net export decline period, 60% of post-2000 CNE had already been consumed. The remaining 40% of post-2000 CNE would be consumed over the next six years.
Note that the initial three year post-2000 CNE depletion rate for the ELM was about 30%/year. After three years, at a post-2000 CNE depletion rate of 30%/year, remaining post-2000 CNE were down to about 40%, with 60% of post-2000 CNE having been consumed in only three years. Post-2000 CNE can be thought of as the “Net Export Fuel Tank,” i.e., the total volume of cumulative net exports, after a given date, and the depletion rate would be the annual rate of consumption of the oil in that “Net Export Fuel Tank.”
The Export Capacity Index (ECI) is simply the ratio of total petroleum liquids production to domestic liquids consumption in a net oil exporting country. In the case of the ELM, the ECI rose from 1.56 in the year 1990 to 2.0 in 2000, declining to 1.0 in 2009 (zero net exports as production = consumption) and then to 0.94 in 2010 (net importer status).
The following chart, Figure Five, shows the ECI ratio for Export Land from 1990 to 2010.
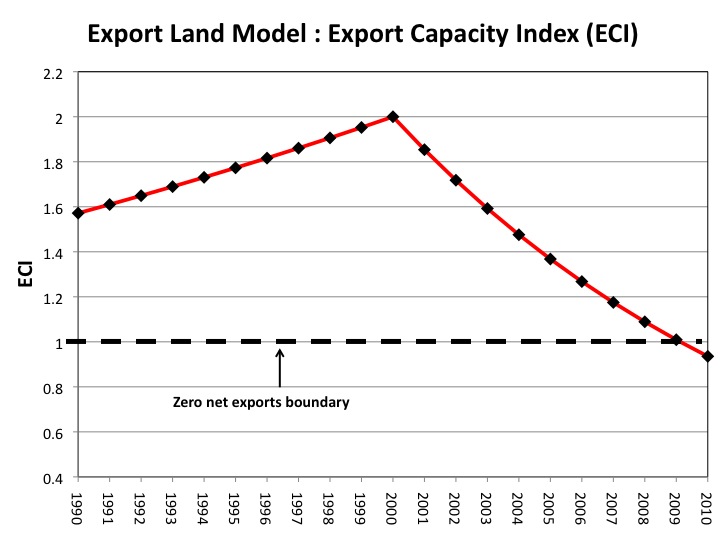
Note that the initial three year (2000 to 2003) rate of change in the ECI ratio (-8.2%/year) suggested that the ELM would hit zero net oil exports in the year 2009, which is what happened.
Also, as previously noted, the bulk of post-peak CNE were consumed early in the decline phase of the ELM.
The following chart, Figure Six, shows remaining post-1990 CNE by year, versus the ECI ratio for the ELM. Note the steady decline in the remaining cumulative supply of net oil exports, even as production and the ECI ratio increased from 1990 to 2000.
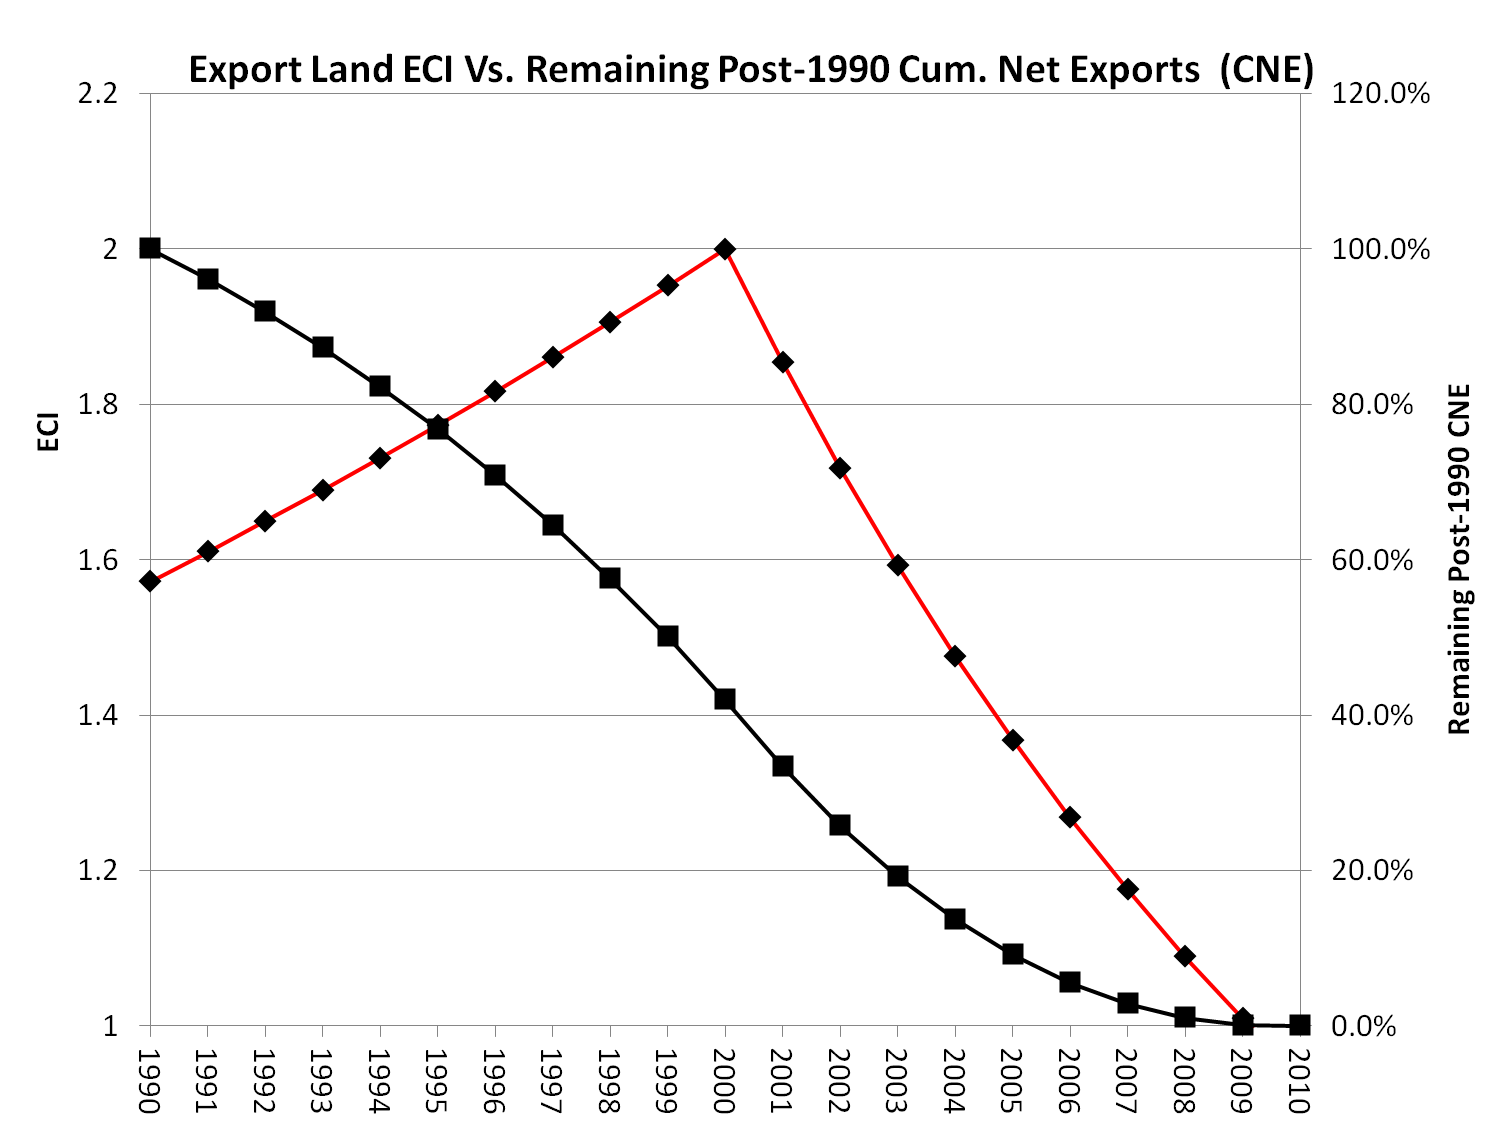
The following chart, Figure Seven, shows annual normalized production, from 1990 to 2010, versus remaining post-1990 CNE.
Again, note the steady decline in the remaining cumulative supply of net oil exports, even as production rose from 1990 to 2000. In other words, rising production and net exports disguised the ongoing rate of depletion in post-1990 CNE.

Six Country Case History
The Six Country Case History consists of the combined production (total petroleum liquids, BP) from Indonesia, UK, Egypt, Vietnam, Argentina and Malaysia. These six countries are the major net exporters, i.e., net exporters with 100,000 bpd or more of net exports, that hit zero net oil exports in the past 20 years, with the exception of China, which like the US in the late Forties, became a net oil importer, even as its production continued to increase.
As of 2011, the BP data base showed all six of these countries to have virtually zero net oil exports, or they were classified as net importers.
I recently had a data base prepared which sums the production, consumption and net exports from these six countries, from 1992 to 2011 (using the BP Statistical Review of World Energy). Net exports are defined as total petroleum liquids production less liquids consumption.
The six countries showed a combined five year production plateau from 1995 to 1999 inclusive, with production ranging between 6.9 and 7.0 mbpd. In 2008, their production was 4.9 mbpd, consumption was 5.0 mbpd, and net imports were 0.1 mbpd, with an ECI of 0.98 (net importer status).
The following chart, Figure Eight, shows combined production (top line), consumption (in red) and net exports (in green) for the Six Countries, from 1992 to 2011.

A 29% decline in production from 1995 to 2008, plus rising consumption, caused the six countries to collectively go from net exports of 2.7 mbpd in 1995, or a billion barrels per year, to net importer status 13 years later, in 2008.
Note that the rate of change in net exports (+10.8%/year) exceeded the rate of change in production (+5.5%/year), on the upslope, from 1992 to 1995, but note that on the downslope even though the rate of change in production was only -2.8%/year from 1995 to 2006, the rate of change in net exports was -34%/year from 1995 to 2006. Note that this is consistent with what the ELM predicted.
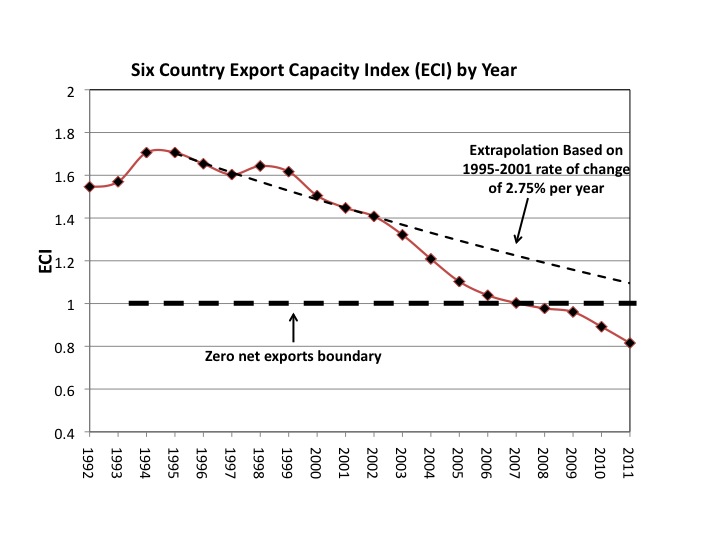
Starting from the beginning of the production plateau in 1995, the combined initial six year rate of change in the ECI ratio was -2.7%/year, declining from 1.71 in 1995 to 1.45 in 2001. At this rate of decline, they would hit an ECI ratio of 1.0 (and thus zero net oil exports) in 2015. They actually hit zero net oil exports in 2007.
Estimated post-1995 Cumulative Net Exports (CNE), using the initial six year rate of decline in the ECI ratio, were 9.0 Gb (billion barrels). Post-1995 CNE were estimated assuming that the net export decline curve would approximate a triangle, and the area under the projected 1995 net export curve was estimated by multiplying 1995 annual net exports (one Gb/year) times the number of years to estimated zero net exports (20 years) times 0.5 (to get the area under a triangle), less annual net exports at peak (one Gb), resulting in estimated post-1995 CNE of 9.0 Gb.
Actual post-1995 CNE were 7.3 Gb.
Estimated remaining post-1995 CNE, at the end of 2001, were 3.5 Gb (9.0 Gb less actual six year CNE of 5.5 Gb). Actual remaining post-1995 CNE were only 1.8 Gb, about half of the estimated value, based on projecting the six year decline in the ECI ratio.
In other words, the actual net export decline was faster than what the initial six year based projection predicted. This is a little more clear on the following chart, Figure Nine, which shows the Six Country Export Capacity Index (ECI), which is the combined ratio of total petroleum liquids production to liquids consumption for the six countries.
Note that the combined production rate in 1999 of 7.0 mbpd was slightly higher than the 1995 combined production rate of 6.9 mbpd; however, by the end of 1999 the six countries had already shipped 3.9 Gb of combined net exports in the four year period from 1996 to 1999 inclusive. Therefore, despite a slight increase in production from 1995 to 1999, combined post-1995 CNE were already 54% depleted, with a 1995 to 1999 post-1995 CNE depletion rate of 19%/year.
It’s also instructive to illustrate how cumulative net export depletion proceeded, even as production and net exports increased, after 1992.
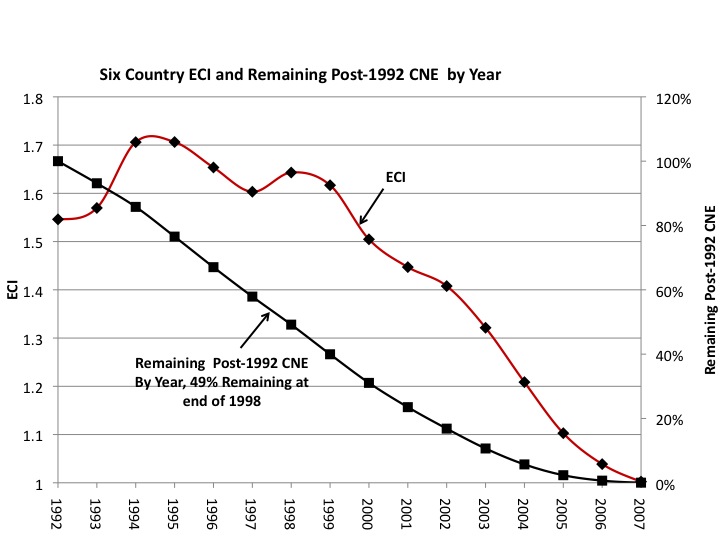
The following chart, Figure 10, shows the remaining post-1992 CNE by year, versus the ECI ratio.
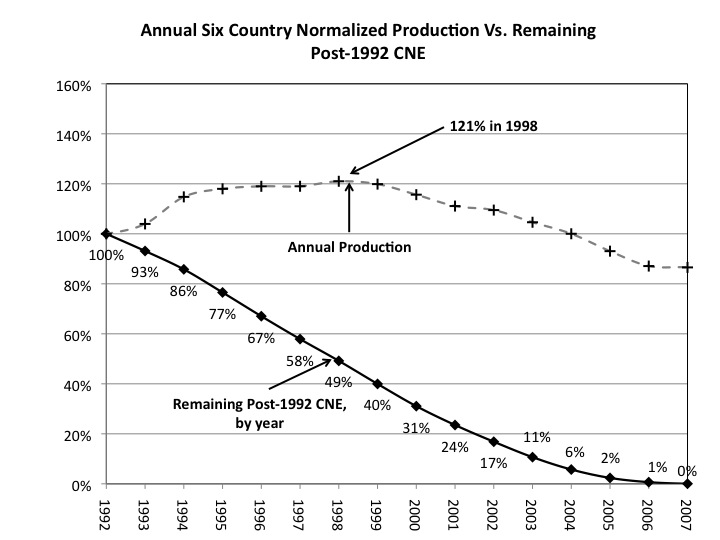
The following chart, Figure 11, shows annual normalized production versus remaining post-1992 CNE by year. Note the steady decline in the remaining cumulative supply of net exports, even as production increased by 21% from 1992 to 1998.
I think that these six diverse and geographically separated former major net oil exporting countries confirm what the Export Land Model suggested we would see and I think that they give us a valid model for Global Net Exports of oil (GNE).
Global Net Exports of Oil (GNE)
Our data base calculates the combined net exports (in terms of total petroleum liquids) from the top 33 net oil exporters in 2005, which we define as Global Net Exports of oil (GNE). These were all of the net exporters in 2005 that had 100,000 bpd or more of net exports, and they comprised 99%+ of total global net exports in 2005. We primarily used the BP data base, plus some input from the EIA for consumption in smaller countries. Net exports are defined as total petroleum liquids production less liquids consumption in oil exporting countries. GNE fell from 46 mbpd in 2005 to 44 mbpd in 2011.
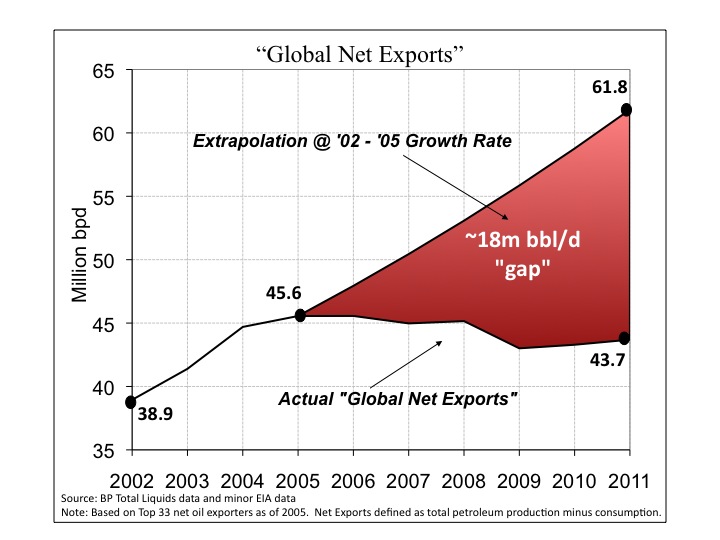
The following chart, Figure 12, shows the gap, about 18 mbpd, between where we would have been at the 2002 to 2005 rate of increase in GNE, versus actual net exports in 2011.
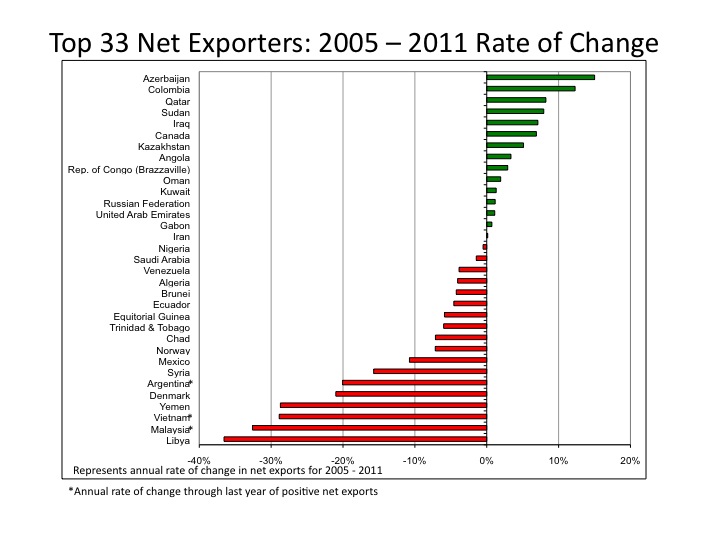
The following chart, Figure 13, shows the 2005 to 2011 rate of change in net exports for each of the (2005) top 33 net oil exporting countries. Of the 33 countries, 14 showed increasing net exports from 2005 to 2011, while the remaining 19 showed flat or declining net exports from 2005 to 2011. Three countries, Vietnam, Argentina and Malaysia, were classified as net importers in 2011. Since 2005, six of the 33 countries have fallen below 100,000 bpd in net exports, an average loss of one major net oil exporter per year.
Saudi Arabia, the world’s largest net oil exporter, is one of the 19 countries showing declining net oil exports from 2005 to 2011, and this case history is very interesting.
The observed 2005 to 2011 rate of change in Saudi Arabia’s net exports was -1.5%/year, as their net exports fell from 9.1 mbpd in 2005 to 8.3 mbpd in 2011 (with lower values in several intervening years).
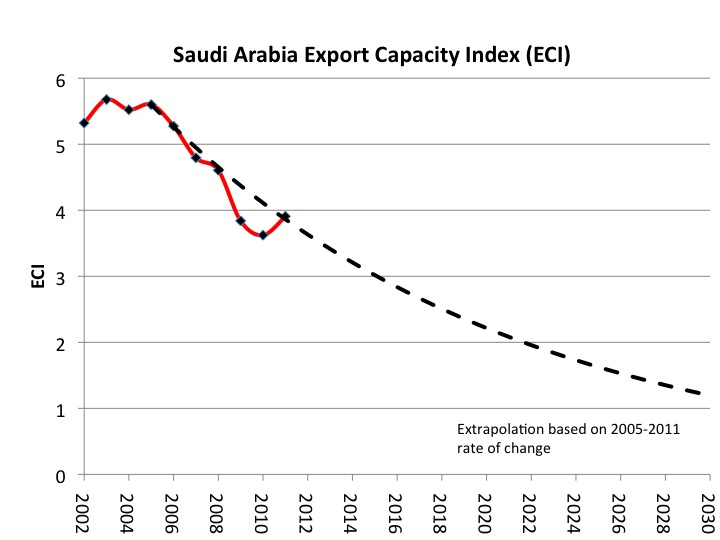
From 2005 to 2011, the Saudi ECI ratio fell from 5.6 to 3.9, a decline of 30%. The extrapolated 2005 to 2011 rate of change in the ECI ratio, -6.0%/year, suggests that Saudi Arabia would approach zero net oil exports around 2034, with estimated post-2005 CNE (Cumulative Net Exports) of about 45 Gb.
I estimate that the 2005 to 2011 post-2005 Saudi CNE depletion rate was about 8.0%/year, with estimated remaining post-2005 CNE of about 28 Gb. These estimates are, needless to say, somewhat at odds with conventional wisdom regarding Saudi reserves and net exports.
The following chart, Figure 14, shows Saudi Arabia’s ECI ratio from 2002 to 2011, extrapolated out to 2030 based on the 2005 to 2011 rate of decline in their ECI ratio.
The following chart, Figure 15, shows the (2005) Top 33 Net Exporters’ ECI ratio, from 2002 to 2011, extrapolated out to 2030, based on the 2005 to 2011 rate of decline in the ECI ratio.
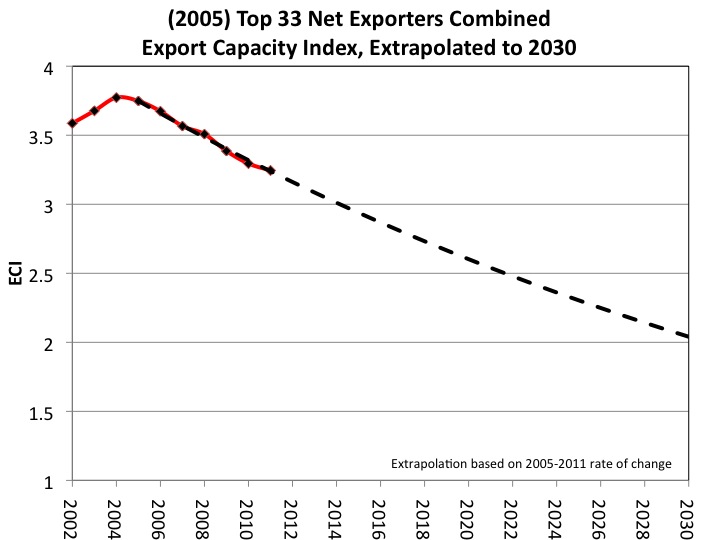
From 2005 to 2011, the GNE (Top 33 Net Exporters) ECI ratio fell from 3.75 in 2005 to 3.24 in 2011, a decline of 14%.
The 2005 to 2011 rate of change in the ECI ratio (-2.4%/year) suggests that GNE would approach zero around 2060, with estimated post-2005 Global CNE (Cumulative Net Exports) of about 445 Gb. Cumulative top 33 net exports from 2006 to 2011 inclusive were about 96 Gb, putting estimated post-2005 Global CNE about 22% depleted.
Note that an extrapolation of the 2005 to 2011 rate of decline in the GNE ECI ratio (2.4%/year) suggests basically a continuation of the 2005 to 2011 rates of change, to-wit, a slight increase in production (0.3%/year) and a 2.7%/year rate of increase in consumption. If we were to extrapolate these rates of change out 10 years to 2021, the ECI ratio would have fallen to 2.55, and GNE would be down to about 40 mbpd, versus 44 mbpd in 2011. If however, production fell at 2%/year and consumption continued to increase at 2.7%/year, the GNE ECI ratio would be down to about 2.0 in 2021, and GNE would be down to about 26 mbpd in 2021, versus 44 mbpd in 2011.
Based on extrapolating the 2005 to 2011 rate of decline in the GNE ECI ratio (2.4%/year), I estimate that the 2005 to 2011 post-2005 Global CNE depletion rate was about 4.1%/year, with estimated remaining post-2005 Global CNE of about 349 Gb, but of course, there has been, and there will no doubt continue to be, intense competition for access to remaining post-2005 CNE.
The following chart, Figure 16, shows “Claims on Production” regarding combined production from the top 33 net exporters in 2005.
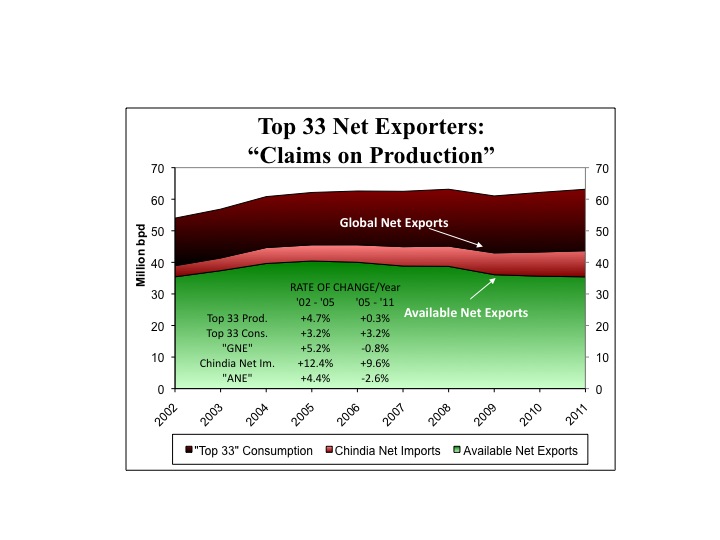
Note that the rate of change in net exports (+5.2%/year) exceeded the rate of change in production (+4.7%/year), on the upslope, from 2002 to 2005, but note that because of virtually flat post-2005 production, combined with rising consumption, the 2005 to 2011 rate of change in net export was -0.8%/year.
Available Net Exports of oil (ANE)
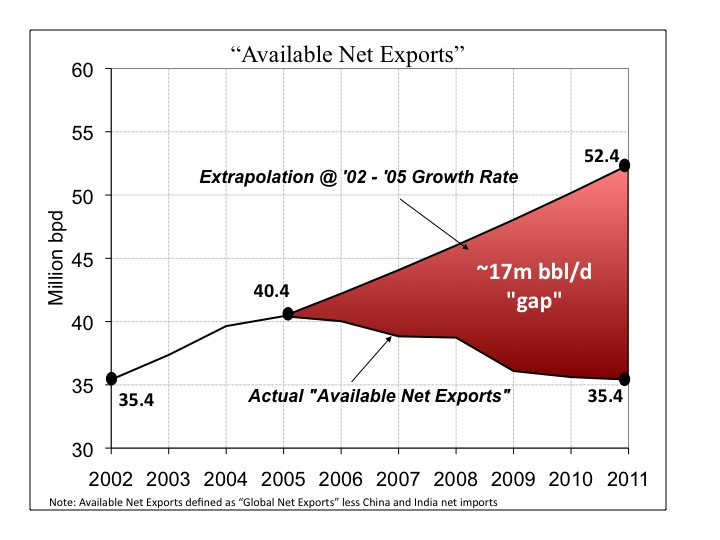
ANE are defined as GNE less Chindia’s (China + India’s) combined net oil imports, and ANE are shown in green on Figure 16. Our data base shows that ANE fell from 40 mbpd in 2005 to 35 mbpd in 2011.
The following chart, Figure 17, shows the gap, about 17 mbpd, between where we would have been at the 2002 to 2005 rate of increase in ANE, versus actual ANE in 2011.
The following chart, Figure 18, shows the normalized liquids consumption for China, India, the (2005) top 33 Net Exporters and the US from 2002 to 2011, with 2002 consumption set equal to 100%. Annual Brent crude oil prices are shown as a bar chart, in red.
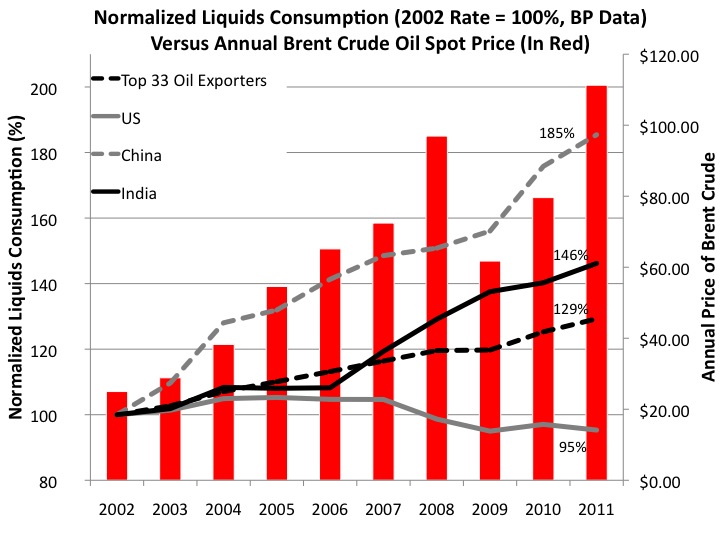
As annual Brent crude oil prices more than quadrupled from 2002 to 2011, Chinese liquids consumption increased by 85%, India’s consumption increased by 46%, the (2005) Top 33 Exporters’ consumption increased by 29%, and US consumption fell by 5% (after hitting a peak in 2005).
What the preceding chart illustrates is that post-2005, the US and most other net oil importing developed countries have been forced to reduce their liquids consumption, as global oil prices have been driven higher, as the developing countries—led by China—have, so far at least, consumed an increasing share of a declining post-2005 volume of Global Net Exports of oil.
The following chart, Figure 19, shows the 2002 to 2011 increase in annual Brent crude oil prices as the ratio of Global Net Exports of oil (GNE) to Chindia’s Net Imports (CNI) fell from 11.0 in 2002 to 5.3 in 2011.
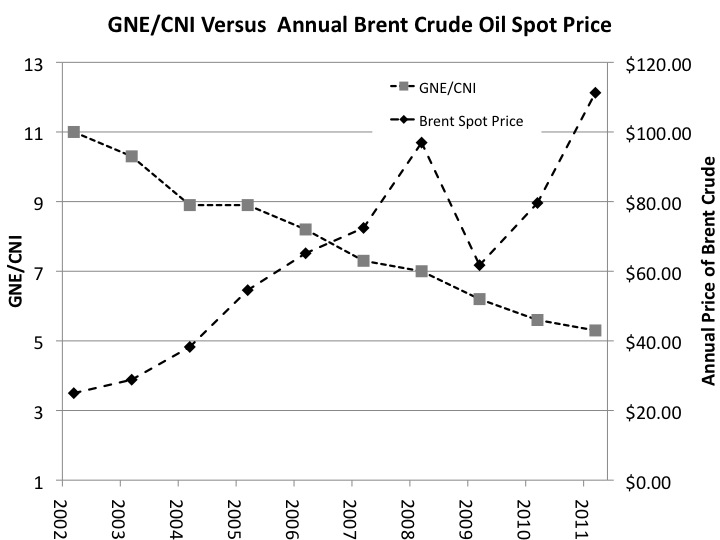
In 2002, there were 11 barrels of GNE for every barrel that Chindia net imported.
In 2005, there were 8.9 barrels of GNE for every barrel that Chindia net imported.
In 2011, there were 5.3 barrels of GNE for every barrel that Chindia net imported, a decline of 40% from the 2005 value.
Note that the GNE/CNI ratio fell from 2002 to 2005, even as Available Net Exports (ANE) increased, because the rate of increase in the Chindia region’s net imports exceeded the rate of increase in GNE from 2002 to 2005. After 2005 of course, we have seen a significant decline in ANE, falling from 40 mbpd in 2005 to 35 mbpd in 2011.
In my opinion, net oil importing OECD countries have gone increasingly into debt, from real creditors and from accommodative central banks, trying to keep their “Wants” based economies functioning, even as the annual Brent crude oil doubled from 2005 to 2011.
The following chart, Figure 20, shows annual global public debt (from the Economist Magazine) versus the decline in the GNE/CNI ratio from 2002 to 2011.

Based on the six year (2005 to 2011) rate of change in the GNE/CNI ratio, estimated post-2005 Available CNE are about 168 Gb. Cumulative ANE for 2006 to 2011 inclusive were about 81 Gb, putting estimated post-2005 Available CNE about 48% depleted. I estimate that the 2005 to 2011 post-2005 Available CNE depletion rate was about 11%/year, with estimated remaining post-2005 Available CNE of about 87 Gb.
The 2005 to 2011 rate of decline in the GNE/CNI ratio, if extrapolated, suggests that China and India would theoretically be consuming 100% of Global Net Exports of oil in the year 2030, which is 18 years from now. Of course, I don’t think that will actually happen, but the trend through 2011 is pretty clear, and the rate of decline in the GNE/CNI ratio accelerated from 2008 to 2011, versus 2005 to 2008.
The following chart, Figure 21, shows the 2002 to 2011 GNE/CNI ratio, extrapolated out to the year 2030, based on the 2005 to 2011 rate of decline in the ratio.

The following chart, Figure 22, shows six years of normalized ECI data for the Six Country Case History, for the (2005) Top 33 Net Exporters (or GNE), for Saudi Arabia and for Available Net Exports (GNE/CNI ratio in this case). The Index Year (Year One on the chart) is defined as the 100% value. 1995 is the Index Year for the Six Countries, and 2005 is the Index Year for the other data sets.
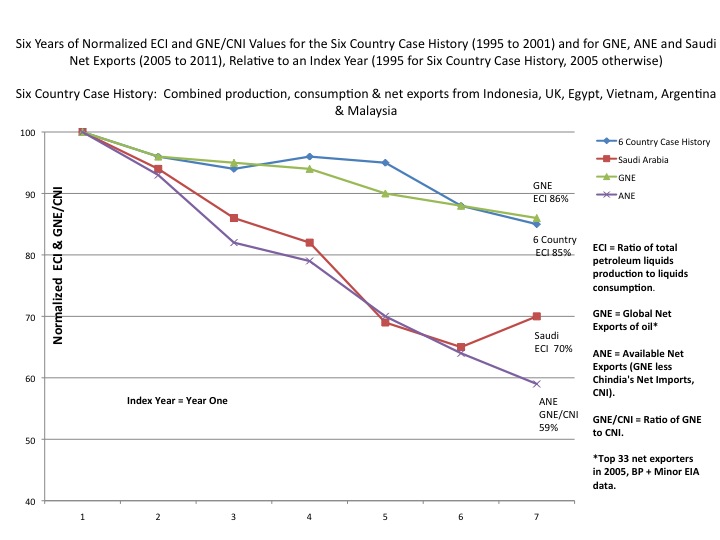
The Six Countries data show a decline in the ECI ratio, from 100% in 1995 to 85% in 2001.
GNE (2005 Top 33 Exporters) data show a decline in the ECI ratio, from 100% in 2005 to 86% in 2011.
Saudi data show a decline in the ECI ratio, from 100% in 2005 to 70% in 2011.
ANE data show a decline in the GNE/CNI ratio from 100% in 2005 to 59% in 2011.
The following chart, Figure 23, shows estimated Post-Index Year CNE depletion, by year, relative to the Index Year. Again, 1995 is the Index Year for the Six Countries, and 2005 is the Index Year for the other data sets. All of the estimates are based on six years of declines in the ECI ratios and the six year decline in the GNE/CNI ratio.
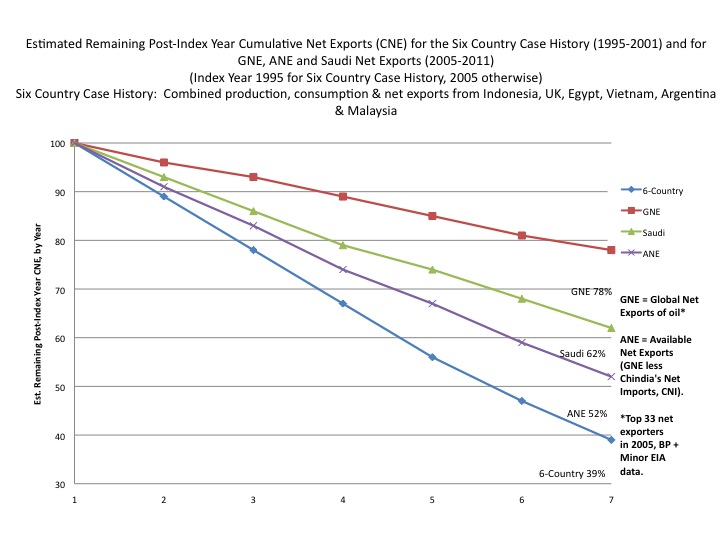
At the end of 2001, estimated remaining post-1995 Six Country CNE were down to 39%. The actual value for remaining post-1995 Six Country CNE at the end of 2001 was 25%.
At the end of 2011, estimated remaining post-2005 Global CNE were down to 78%.
At the end of 2011, estimated remaining post-2005 Saudi CNE were down to 62%.
At the end of 2011, estimated remaining post-2005 Available CNE (estimated cumulative volume of post-2005 net exports available to importers other than China and India) were down to 52%.
Rising Unconventional Production Versus Declining Net Exports
Some major net exporters, e.g., Canada, are showing increasing net exports, primarily as a result of increasing production from unconventional sources.
However, Canadian net oil exports should be put in the context of regional data, and combined net oil exports from the seven major net exporters in the Americas in 2004 (Canada, Mexico, Venezuela, Colombia, Argentina, Ecuador and Trinidad & Tobago) fell from 6.1 mbpd in 2004 to 5.1 mbpd in 2011 (BP, total petroleum liquids). In other words, rising Canadian net oil exports have so far only served to slow the post-2004 regional decline in Western Hemisphere net oil exports.
And of course, many people believe rising production from shale resources around the world will result in an indefinite increase in global crude oil production, which perhaps might offset the ongoing post-2005 decline in Global and Available Net Exports. However, it seems unlikely to me that a production base with a steady increase in underlying decline rates, and with thousands and thousands of shale oil wells quickly headed toward stripper well status (10 bpd or less), will be able make a material long term difference in the global net export situation, especially in the context of rising demand in the developing countries. In addition, operating costs in most other prospective shale plays around the globe are higher, and often much higher, than in the US Lower 48 area.
Furthermore, the increase in US oil production also needs to be put in the context of production declines in other OECD countries. For example, US total petroleum liquids production in 2011 was 7.8 mpbd, only slightly above the US 1999 production rate of 7.7 mbpd, but over the same time period, 1999 to 2011, UK total petroleum liquids production declined by 1.8 mbpd, down from 2.9 mbpd in 1999 to 1.1 mbpd in 2011. From 2006 on, the UK was a net oil importer, showing rising annual net oil imports, through 2011.
In any case, for the average American consumer, unless they directly or indirectly benefit from US oil and gas activity, an increase in US crude oil production, to a level that it still well below the 1970 US crude oil production peak, is largely irrelevant, and the average consumer is far more focused on recent near record high gasoline prices at the pump.
Summary
The ECI ratio, which is simply the ratio of total petroleum liquids production to liquids consumption, gives us a measure of how much net export capacity a given oil exporting country, or a group of net oil exporters, has.
The rate of change in the ECI ratio, given a multiyear decline in the ratio (and absent exogenous effects on production such as political unrest, e.g., Russia in the early 1990’s, and clearly voluntary reductions in production, e.g., Saudi Arabia in the early 1980’s), appears to provide us with a reasonable estimate of when a given oil exporting country might approach zero net exports. Furthermore, some simple math allows us to estimate remaining Cumulative Net Exports (CNE).
The following graph, Figure 24, is a summary table showing production and net export rates of change (shaded green) for three years leading up to key Index Years (representing key inflection points) for the ELM, for the Six Country Case History, for Saudi Arabia, for GNE and for ANE (for ANE, production is defined as GNE). Note that for the ELM, the Six Countries, Saudi Arabia and GNE on the upslope leading up to key Index Years, the rate of increase in net exports exceeded the rate of increase in production. After the key Index Years (or inflection points), the rate of decline in net exports exceeded the rate of change in production for the ELM, the Six Countries, Saudi Arabia and GNE.
For the ELM, the Index Year is defined as the year 2000, for the Six Country Case History, the index year is 1995, and the Index Year for the other data sets is 2005.
In the special case of ANE, or GNE less the Chindia region’s net imports, on the upslope leading to 2005, the key Index Year, the rate of increase in ANE was less than the rate of increase in GNE, because Chindia’s Net Imports (CNI) were growing faster than GNE. After 2005, the rate of decline in ANE exceeded the rate of decline in GNE.
The following graph also shows production and net export rates of change in the six years after key Index Years for the same data sets. In addition, estimated six year post-Index Year CNE depletion rates are shown. All of these post-Index Year values are shaded red.
Note that the estimated Six Country post-1995 CNE depletion rate was 16%/year at the end of 2001, based on the 1995 to 2001 decline in the ECI Ratio. The actual Six Country post-1995 CNE depletion rate was 23%/year, at the end of 2001.
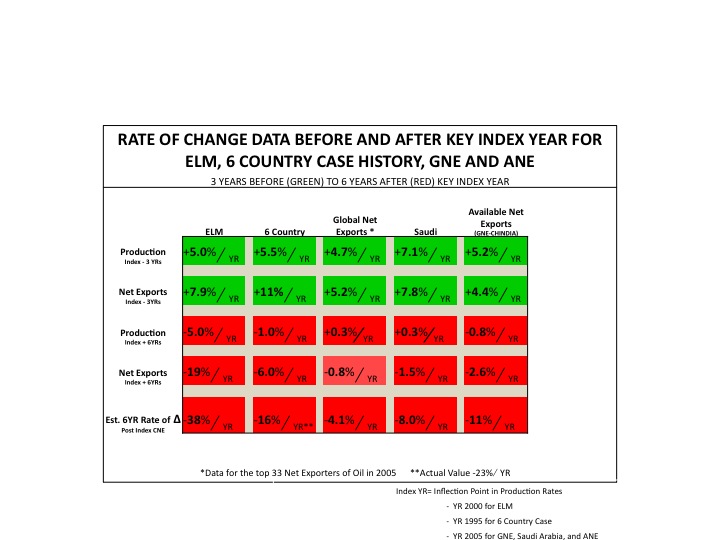
Extrapolating the six year (1995 to 2001) 15% decline in the Six Country Case History ECI ratio provided an estimate, as of 2001, of remaining post-1995 CNE, 39%, that was significantly more optimistic than the actual value for remaining post-1995 Six Country CNE at the end of 2001, which was 25%.
Using the same methodology, and extrapolating the six year (2005 to 2011) 14% decline in the Global ECI ratio, suggests that post-2005 Global CNE have been about 22% depleted in only six years, with estimated remaining post-2005 Global CNE down to 78%.
Again using the same methodology, and extrapolating the six year (2005 to 2011) 41% decline in the ratio of GNE to CNI (Global Net Exports to Chindia’s Net Imports), suggests that post-2005 Available CNE have been about 48% depleted in only six years, with estimated remaining post-2005 Available CNE down to 52%.
In 2005, there were 33 major net exporters (net exports of 100,000 bpd or more), a handful of minor net exporters, and about 155 net oil importing countries. Extrapolating the six year rate of decline in the GNE to CNI ratio suggests that two of these 155 net oil importing countries, China and India, are on track to consume 100% of Global Net Exports of oil in only 18 years–theoretically leaving zero available net exports for about 153 net oil importing countries.
We know what the six year ECI decline meant for the Six Country Case History, and we know that we are seeing similar ECI type declines for Saudi Arabia, Global Net Exports and Available Net Exports.
The key question is why would the outcome for global net exports be materially different from the Six Country outcome?
My basic premise is that the net oil importing OECD countries are maintaining something resembling “Business As Usual” only because of huge and almost totally overlooked rates of depletion in post-2005 Global and Available Cumulative Net Exports of oil.
I have frequently used the Titanic metaphor. The Titanic hit the iceberg at 11:40 P.M. on the evening of April 14, 1912. At midnight, only a handful of people on the ship knew that it would sink, but that did not mean that the ship was not sinking. The Titanic’s pumps helped, but they could not fully offset the flow of seawater into the ship. In my opinion, rising US crude oil production is to the ongoing decline in Global and Available Net Exports as the Titanic’s pumps were to the flood of incoming seawater, i.e., the Titanic’s pumps made an incremental difference, but not a material difference.
Acknowledgements
Special thanks to: Jim Branch, who worked very hard on compiling several data bases, using BP and EIA data, and to Timothy A. Larson, Ph.D, who worked very hard on generating most of the graphics used in this paper.
About the Author
Jeffrey J. Brown is a graduate of Texas A&M University, and he is a licensed Professional Geoscientist in the State of Texas. He is also on the board of directors of ASPO-USA.
He has discovered several oil and gas fields in West Central Texas, and he is currently managing an exploration program searching for commercial oil and gas fields in this mature play.
For several years he has been studying the Peak Oil issue, and he has written and coauthored several articles on Peak Oil related topics, with a special emphasis on world net oil export capacity.
In 2007, 2009, 2010 and 2011, he delivered papers to the Association for the Study of Peak Oil & Gas–USA, presenting the work that he and his frequent co-author, Samuel Foucher, have done on the top five net oil exporting countries, and most recently on Global Net Exports. In addition, he has delivered presentations to a number of colleges and universities, including Texas A&M and and UCSB, at Sandia National Laboratory and to other national laboratories via video link, as well as to several investment groups.


