 Two weeks ago, I described my factor-of-five reduction of natural gas usage at home, mostly stemming from a decision not to heat our San Diego house. We have made similar cuts to our use of utility electricity, using one-tenth the amount that comparable San Diego homes typically consume. In this post, I will reveal how we pulled this off…with plots. Some changes are simple; some require behavioral changes; some might be viewed as outright trickery.
Measurement and Data
My several-year journey started—as it often does for me—with measurement and data. Utility bills are the best starting point, accumulating the number of kilowatt-hours used in a month. This information is certainly useful as a baseline against which to judge future improvement. But how do you know when you’ve got a reasonable footprint?
One answer is that the average American household uses about 30 kWh/day of electricity—implying a constant burn rate of 1200 W. To get a more representative number, some utilities provide an online comparison to similar houses in your area. For instance, I can compare my usage to that of single-family homes built before 1977 accommodating 1–2 people, having no swimming pool, with or without air conditioning, and can enter my house’s square footage (a.k.a. area). In San Diego, these parameters result in a yearly usage of 7458 kWh and 6317 kWh with and without air conditioning, respectively. This translates to 17 and 20 kWh/day—predictably lower than the national average, but not by as much as a factor of two.
When I first took stock of my energy usage in 2007, my wife and I totaled 3466 kWh in a year in a condo without air conditioning. The equivalent apartment/condo total for San Diego is 5312 kWh. Already, we used 35% less electricity than typical area residents. (We were right on the nominal amount of gas usage, at about 300 Therms per year.) Lately, we use something like 750 kWh of utility electricity in a year: almost a factor of five reduction for us, and about a factor of ten less than the equivalent San Diego household (our house does have air conditioning installed).
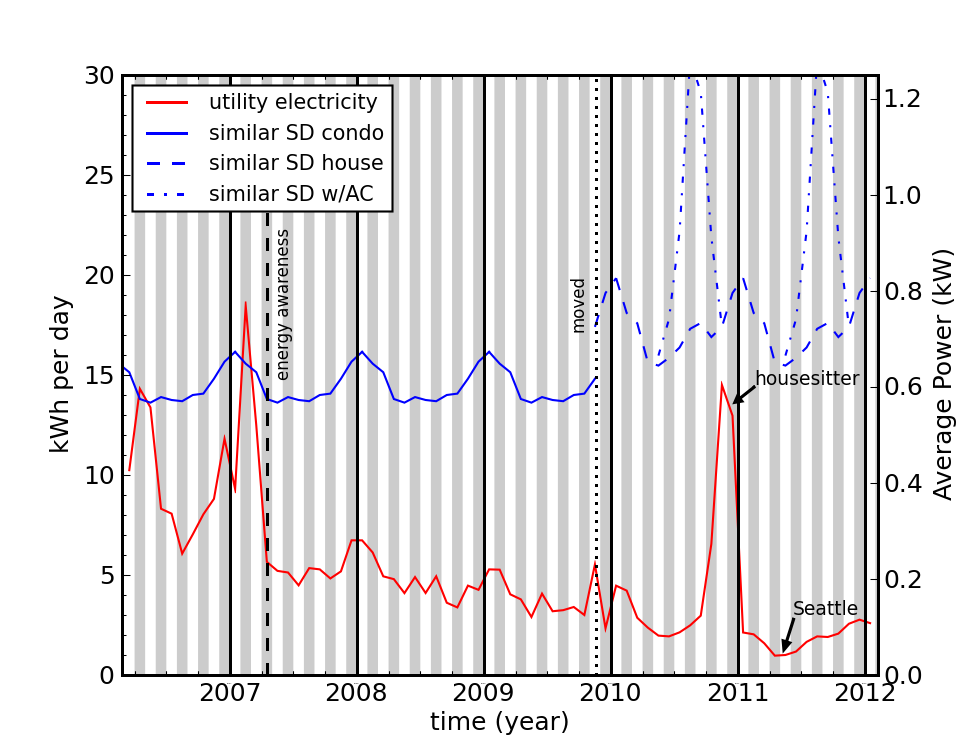
Above is a plot of our electricity use over time as we migrated into energy awareness and also moved from a condominium to a house. Alternating gray and white bars represent months within the year. Electricity use of typical San Diego condos and houses matched to the ones we occupied is shown in blue—including two curves for houses with and without air conditioning. Our (red) curve was once roughly comparable in scale, but has edged downward over time due to a variety of changes. A house-sitter in the latter part of 2011 blew our trend, probably by befriending our space heater. But this deviation serves to illustrate the importance of people and behaviors over the physical house.
Okay Mister; What’s Up Your Sleeve?
You can always tell a physicist from a magician, even if both show tricks/demonstrations in front of an audience. The physicist is eager to explain how and why the “trick” works, perhaps repeating the performance and encouraging onlookers to view from all angles. So I can’t wait to tell you how we pulled off this fantastic reduction.
But first, let me reveal two of the items I do have up my sleeve. The first is the Kill-A-Watt electricity metering device (see note at bottom). Anything that can plug into the wall (and that consumes less than about 1800 W of power) can be measured with the Kill-A-Watt. It displays instantaneous power, in Watts (my favorite unit); accumulated energy, in kWh; and the time over which the measurement is accumulated. Because I have a Kill-A-Watt, I know exactly how much my laptop uses as a function of screen brightness, when charging the battery, when “sleeping,” and the impact of leaving the power supply plugged in without the computer around. I know how much standby power my various appliances use. I know how much my cable modem and wireless router consume 24/7. I know all about my refrigerator, television, lamps, alarm clocks, printers, etc.
The second tool is my friend TED, who I have known since November 2011. I met TED when I was temporarily living in Boston, and took him as an uninvited guest to join friends in upstate New York for Thanksgiving. TED is also known as The Energy Detective, and my grad-school buddy was as eager as I was to rip into the packaging and install the device in his breaker box. Soon enough we had real-time readings of his whole-house energy consumption. It was Thanksgiving evening, and the kitchen was busy with preparations. The “kids”—young and old—delighted in running around turning on and off various lights and appliances to gauge their effect (and the corresponding real-time graph change on the laptop). Our hostess became increasingly irritated by “outages” of light in the kitchen and by our wails when the oven kicked on pumping kilowatts of power into the turkey. Fed up, TED was asked to please leave the premises: back in the box. My wife sympathized with our hostess and I feared that TED may not even find welcome in our house when we got back to San Diego.
Besides the Thanksgiving fiasco, my wife was reluctant to have yet another data-gathering tool in the house. But TED now does live at our house, and has come to be accepted as a member of the family. Indeed, my wife was not a big fan at first, but after a few weeks I found (and kept) a note sitting by the display saying, “Okay, TED’s pretty cool.”
What do these “trick” devices have to do with reduction of power consumption? Knowledge is power. And knowledge of power is spectacularly useful. We got rid of wasteful devices like a stereo that had an inexcusable 12 W standby power drain (9 kWh/month). Knowing the power associated with various lighting choices guides our decisions about what lights we might want to use and when. We have identified various phantom loads (devices that suck “standby” power without providing benefit) and eliminated them by unplugging when not in use. These include a 9 W pull from the printer even when off; 11 W from the central air circulator that we were not even using; 5 W from the sprinkler control that we also were not using; and others as well—you get the idea. Some countries have on/off switches at the wall outlet to make such savings simpler to effect.
Killing Phantoms
One of the most important reductions one can make is reduction of baseload power: devices that consume energy 24/7. Every 1 W eliminated removes 9 kWh from the yearly tally and about $1 of yearly cost at nominal electricity prices. Each constant Watt removed saves as much daily energy as one minute of microwave oven cook time (one Watt times 24 hours is the same as 1440 W times 1/60th of an hour: 24 Wh). Constancy is the killer here. We’ve reduced our utility baseload to about 40 W continuous from an initial 100 W or so. That’s about equivalent to the total utility electricity we use now. It can be a big deal.
Lawrence Berkeley Lab put together a useful table of standby power for a number of appliances/devices. Standby power is estimated to consume about 10% of residential power in the U.S. Since the typical household uses 30 kWh per day, this means phantoms slurp 3 kWh per day per household, amounting to 125 W of continuous drain per household, and 14 GW of power production nationally. A dozen super-sized power plants to do nothing.
Imagine that we assign specific tasks to power plants. We have the power plants assigned to lighting applications. There are a goodly number of power plants assigned to running televisions. We’ve got the hair dryer power plants—fewer now than in the big-hair era of the 1980′s. A worker at any one of these plants may feel proud to provide essential services to fellow citizens. Then you’ve got your dozen standby power plants. Imagine the morale at one of those plants: Wally working hard all day, coming home exhausted. But because of poor Wally, our printer could sit doing absolutely nothing and slurping power all day. He really doesn’t deserve the nickname Wally Wall-Wart (after the name given to plug-in transformers), because it’s our own silly habits and inattention that make Wally go in each day to keep the plant thumping.
Monitoring Baseload
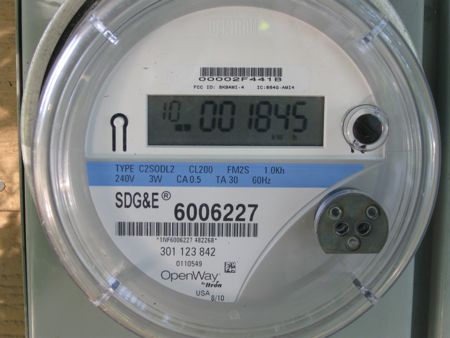
The deluxe way to monitor baseload is with TED (see note at bottom). One productive trick is to turn off one breaker at a time during a quiet period and see which ones host standby power. From there, the specific culprits can be tracked down. A far cheaper solution is the Kill-A-Watt, which can at least tell you about the items that plug in to the wall (almost all phantoms are of this variety). But you can also use the utility meter already attached to the house to measure baseload power.
Analog utility meters have a spinning disk that completes one full turn per unit energy increment. The energy increment is called the Kh value, printed on the meter, and often 7.2 for residential meters, or some multiple thereof. The Kh value corresponds to the number of watt-hours per turn. If your dial takes 360 seconds to complete a full turn when the house is quiescent, 7.2 Wh per 0.1 hours means 72 W. A 90 second turn means 288 W and you’ve got work to do! In general, the power under the meter’s purview is 3600×Kh/T, where T is the dial period in seconds. Surprisingly, the disk rate can vary by a factor of two in a repeatable/cyclic way even when the power is constant. So it is important to measure one complete cycle. If it seems to take ages to go all the way around, good!
Be careful that the refrigerator is off for the measurement. Run out the door right when the fridge shuts off for the best result. If the number does not make sense, try again later: maybe something was stealthily on, like the refrigerator in a quiet defrost cycle.
Digital meters eliminated the disk. It is infuriating to me that the meter internally measures the instantaneous power—it simply accumulates this to arrive at an energy measurement—but this value is not presented to the homeowner. It’s arguably the most useful measurement a power meter can supply, yet it’s just simply absent. I spent hours on the phone with my utility company trying to understand how I might access this information. I ended up spending most of this time patiently explaining that kWh and kW are not the same thing, and a time or two found myself discouraging erroneous use of the unit: kilowatts per hour. In the end, I learned that the digitally simulated disk (little blocks that appear and disappear) carry the meaning that each appearance/disappearance corresponds to the passage of 1 Wh. For me, this means that one complete cycle of the three-block pattern is 6 Wh. For very slow rates, I can measure just one block. For instance, at my house it takes 94 seconds between the appearance of consecutive blocks, computing to 38 W. For 1 Wh blocks, Kh = 1, so standby power is just 3600/T, where T is now the time for one block. I do not know how universal this behavior is, but I suspect it is relatively reliable from place to place. I note that my meter has 1.0Kh printed on it, which I’ll bet means one block equals 1 Wh. So look for something like this on yours as well.
Lighting Replacement
An easy move to reduce electricity consumption is to switch to fluorescent or LED lighting. These typically consume one-quarter of the energy that incandescent lights do for the same level of light output. If a house uses 1000 W of incandescent lighting for six hours of the day (6 kWh), then the same practices using efficient lighting consumes only 1.5 kWh and therefore reduces the typical American house’s electricity usage by 15%. I’ll take it.
Incidentally, You can buy a 100 W incandescent bulb for about $1 that will last 1000 hours. Or you can spend $5 to get a quality compact fluorescent light (CFL) that will last 10,000 hours (don’t spend $3, or your CFL may not last long). Over the same period, you would need to buy 10 incandescent bulbs for a total outlay of $10. But that’s not the worst of it. In that 10,000 hour period, the incandescent bulb racks up 1000 kWh of electricity, costing about $100 at a price of $0.10/kWh. Meanwhile the CFL sips power at 25 W and will cost $25 in its lifetime. In either case, the electricity cost dwarfs the hardware cost. In the end, you can spend $110 for incandescent lighting (and nine bulb changes) or $30 for CFL lighting of the same intensity. Yet many people huff at the $5 CFL cost (and as a result may get cheap versions that don’t last so long and turn them off further).
Behavioral Changes
Killing baseload and changing lights can have a substantial impact on electrical energy used. But behavioral adjustments can be equally important. Behavioral changes stem from changes in attitude or values. Treat electricity as precious, and you’ll find yourself using it more frugally. Here I will describe some of the adaptations we have made to cut our electricity usage.
First, we started line-drying our clothes to avoid using a 5 kW power hog, totaling something like 5 kWh per use. We are sparing launderers anyway, averaging something like a load per week (involves multiple wearings of outer garments between washes). We pay attention to the weather and jump on the sunny days to get the laundry done. I’ll note that in many European countries, people don’t even own clothes dryers. For instance, after drying our hiking clothes outside when visiting a friend in northern Italy (more like Munich than Sicily), I was even more impressed when we went to visit a well-established physicist in a large house who had laundry hanging out in the yard. If they can do it, so can we! When our electric dryer at the condo—which at this point was used for storage—turned out to be incompatible with the new house (rigged for a gas dryer), we simply went without. Just like our friends in Italy, we own no clothes dryer. We’re fine.
We learned that our neighbors were looking for a refrigerator, so we gave them our deluxe side-by-side unit (which we had bought for $50 four years earlier on Craigslist), and swooped up a slightly smaller, used, simpler fridge with freezer-on-top. The old fridge averaged 75 W of power draw (typical of modern large side-by-side), while the new one is half of this. This move saves about 1 kWh per day. Even though our old fridge continued to run somewhere, redistributing used refrigerators does save the substantial embodied energy of new appliances—as long as the old refrigerator is not a total hog by modern standards.
We also became far more vigilant about not leaving lights or devices on when not in use. It’s not unusual for an American house to be “all on” in the evening: daylight throughout the house. But light switches are conveniently placed near the doors of every room, so it’s really not much of a bother to keep lighting where you are, and allow darkness to rule where you aren’t. Part of this training/awareness derived from an experiment to make our living room off-grid using solar panels and batteries. We treated our harvested energy as precious, and did not dare leave the television or living room lights on when we were not using them. Energy became very personal, and this attitude transferred to the house as a whole.
The Big, Sneaky Trick
The plot above of our electricity use over time shows a progressive decline year over year (ignoring the house-sitter contribution). Some of this is indeed due to all the reasons mentioned above. But I left out a key piece. The living room solar experiment started out as a single 130 W panel for the television/DVD/stereo and a 64 W panel for the lights—as described in an article I wrote for Physics Today in 2008. But over time I kept upgrading the system—adding panels and batteries. Before I left the condo, I was up to 6 130 W panels and two golf-cart batteries. After we moved, I bumped up to 8 panels and 4 batteries. The combined effect is shown in the next graph.
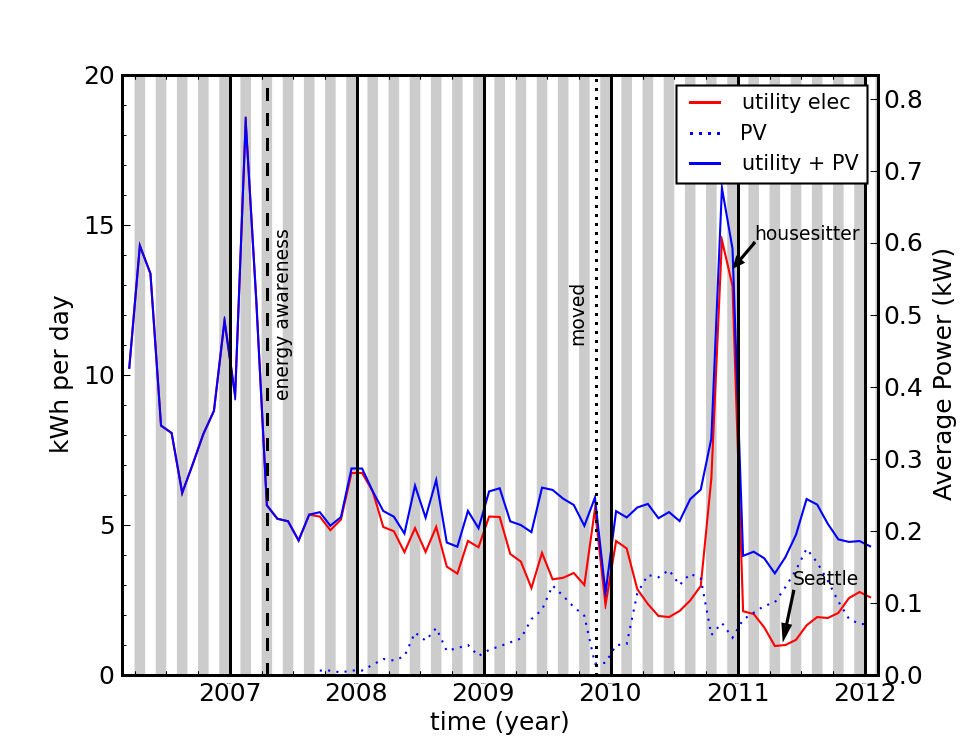
The red curve is the utility electricity shown before, but now the solid blue curve is the combined utility and photovoltaic (PV) energy delivered to appliances within the house. So really we stabilized at about 5 kWh/day. Still, this is about a factor of four lower than the typical San Diego household of similar size and occupancy.
Note the step reduction at the start of 2011. This coincides with the arrival of TED at my house, through which I discovered some extra phantoms and killed them. The summertime tends to draw more electricity to run an attic fan, but the fan is driven by the PV system—a great match, by the way.
Looking back at the period before “energy awareness” arrived, The winter-time electricity usage looks suspiciously like the gas profile from the post two weeks ago. At first I imagined that the electricity used to run the furnace blower may be to blame. But closer inspection suggests that this is not the case. A typical furnace in the U.S. may consume somewhere between 50,000–100,000 Btu/hr of energy, which is 0.5–1.0 Therms of energy per hour. Meanwhile, the blower may operate at something between 500–1000 W. Therefore, each Therm expended in the furnace may be accompanied by anywhere from 0.5–2 kWh of electricity to push the air around. Direct measurements in my current house land right at 1 kWh of blow-energy per Therm burned. Consulting the gas expenditure plot from a few weeks back, we find that the winter peak in gas added no more than about 40 Therms per month of gas use, or 1.3 Therms/day. So I might expect no more than an extra 2.6 kWh of accompanying electricity use per day: nowhere near the extra 12 kWh/day we seemed to use in February of 2007. Other adaptations must take the credit.
Where is the To-Do List?
I have offered examples of the things we have done to shave energy use. But I held back from making a list of things you could/should do on your own. If I have one piece of advice, though, it’s to start measuring your usage. Information is the key. Once you know where you are, and start gauging the effects of various options, you’ll make your own list. Then you’ll own your improvements.
The Combined Effect
We have made substantial (factor-of-five level) reductions in our use of household energy on both the natural gas and utility electricity fronts. For a house matching our size, occupancy, and vintage in our area, we now use one-sixth as much natural gas and one-tenth as much utility electricity as is typical (one-eighth the electricity if compared to houses without air conditioning). The ratio for electricity is closer to one-fourth if including our solar-generated electricity. Even so, it is clear that our behavioral choices have resulted in a dramatic reduction of our energy demands. This is far more powerful than the usual trimmings at the 10% level.
We learned that some new friends, who live a modest lifestyle in a small condominium, somehow got word that my wife and I are efficient livers. But when they found out that we live in a somewhat more expansive house, they suspected the rumor could not be true. This developed into a challenge to compare utility bills. Game on. Their implicit assumption was that a larger place meant greater cost to heat and cool. But if you do neither, the extra space comes with no recurrent energy cost. As long as the activities within the house are not wasteful (via lighting vigilance; phantom-intolerance), there is not much correlation to house size and energy consumption.
Most of our societal energy is consumed outside of the household—it’s true. Therefore, some might argue that even eliminating household energy use would only put a small dent in the overall picture, so why bother? Three answers to this (obviously, I do bother):
- Household energy is under your direct control: exercise what control you have, rather than expecting others to make changes elsewhere.
- The biggest shift is one of attitude toward energy. Adopt a different attitude about the value of energy in your home, and I guarantee this will have ripple effects beyond your household gas and electricity use—it’s just the beginning.
- I have not stopped there. Stay tuned to future Do the Math posts about the many other ways I have been able to shave energy use beyond the home.
The point of all this is that reduction of energy demand is perhaps our most powerful, near-term weapon in facing a world of increased pressure on energy supply. Price signals may ultimately push us into these adaptations, but why not see it coming and be ahead of the curve?: one step ahead of the neighbors. We are a culture adapted to the expectation of growth: more tomorrow than today. This attitude will fail when it comes to energy—starting with liquid fuels. Reduction is a way to beat this physical reality to the punch, and at the same time offer enough relief that maybe we’ll have enough surplus energy (and political will) to build out a modest energy infrastructure less susceptible to the resource limits we face.
There I go again—pretending that we might have a smart, adult response to the problem. But let’s try it, hey. Maybe it’ll catch on. And even if not, our neighbors will look to us for guidance when they can no longer afford their current practices.
Note: I am in no way advocating specific consumer products or brands. I simply report on my limited experience with a few products that have worked for me. I receive no perks from associated companies or vendors.