US natural gas production has been flat for a number of years. We keep hearing that US production is expected to begin declining sometime in the next few years, but it doesn’t seem to happen. While it is not obvious from most published data, the reason production remains level is because unconventional gas production has been rising at the same time that conventional production has been declining. In this post, I will look at unconventional natural gas, since it plays such a pivotal role.

One reason I am writing this post is because only a few days from now (May 20-21), I will be visiting BP’s tight gas facility in Wamsutter, Wyoming on a trip sponsored by the American Petroleum Institute (API). I may have the opportunity to ask some questions. I thought that if I put together a post outlining a little about what we know about unconventional gas, and in particular tight gas, it might put me in a better position to ask reasonable questions, if I get a chance to do so. Also, readers may alert me to some issues I might not otherwise be aware of.
Unconventional Gas and Tight Gas
The major forms of unconventional gas are tight gas, coal bed methane, and shale gas. The production of all three have been rising in recent years. Tight gas is the largest of the three. Production of all three were encouraged under Article 29 of the Internal Revenue Code, Alternative Fuel Production Credit, which became effective in 1980.

One could write volumes on any of the types of unconventional gas. To keep this post from getting too long, I will focus on unconventional gas totals and on tight gas.
Production Forecasts
Figure 3 shows a natural gas production forecast that I found on a BP website. It is not too different from other forecasts that one sees for natural gas: Conventional natural gas production is expected to continue to fall. The various unconventional sources of natural gas will rise to keep production flat for several years. Demand for natural gas is expected to be greater than the amount that can be supplied using conventional and unconventional production. We will try to meet the supply shortfall with imported liquefied natural gas.
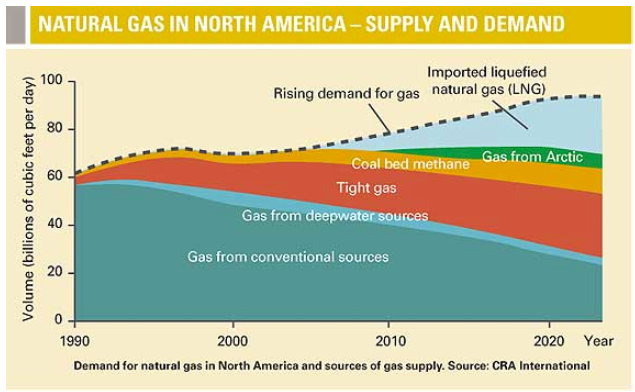
We all wonder, “How reasonable is a forecast of this type?” Can tight gas production be expected to continue to grow for several more years, or will it quickly reach a peak and decline? Should we be concerned in the next few years? Will unconventional gas actually do better than forecast? I am not sure I have an answer to these questions, but I will try to lay out some of the issues involved.
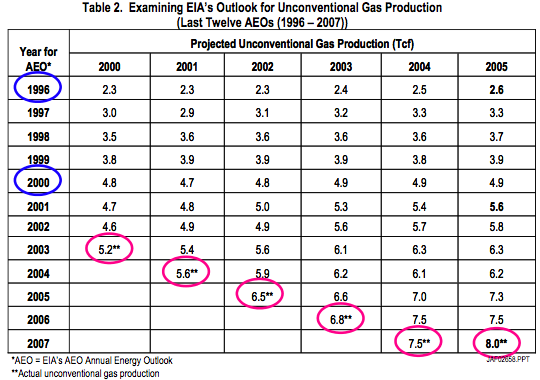
What has the EIA’s track record on forecasting unconventional gas production?
EIA’s track record has been one of consistent under-estimation of the amount that would be produced. This is an exhibit from one of Advance Resources International’s (ARI’s) papers showing EIA’s forecasts and the ultimate amount produced:
EIA’s has also tended to miss the decline in conventional natural gas, so that its track record in total has not been as poor as for the pieces. Going forward, the EIA’s forcast (from the 2007 Annual Energy Outlook) is shown in Figure 5. It forecasts some increase in unconventional, but not as steep a rise as in the past. In Figure 5, NA means not associated with oil production; AD means associated dissolved.

Doesn’t natural gas production tend to peak and decline like oil production?
The United States has different sources of natural gas – conventional gas, both on shore and off shore — and the various unconventional sources. Geological factors do play a role, as with oil, but there are other factors that are important as well. I think of natural gas as more of a “pump what you need each year” endeavor, until the supply runs low, rather than as having the typical peak and decline pattern that we see with oil production. This is part of the reason production has been flat for many years.
One can see the impact of geological factors when one looks at Figure 1, which shows the decline in conventional natural gas (offset by the rise in unconventional). Reserves for conventional natural gas have also been declining, and almost everyone believes that conventional natural gas production will continue to decline in the future.
Price and technology also play major roles in determining the amount of natural gas that is pumped, much more than we think of with oil.
The price of natural gas depends on supply and demand. Natural gas is fairly plentiful around the world. While it is difficult to ship natural gas, there are indirect ways the foreign natural gas can compete with US natural gas. Chemical industries can move to cheaper sources of natural gas. Also, products like fertilizer can be made abroad, and shipped to the United States. In recent years, pipeline imports of natural gas from Canada have helped to hold down US natural gas prices. Price is also affected by availability of pipelines and by competition with coal and with petroleum.
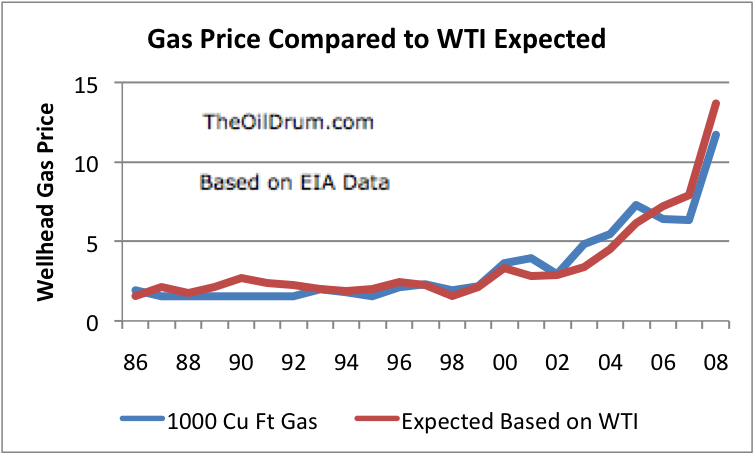
Historically, the price of natural gas has been highly correlated with that of oil (R squared = .82 for 1986 to 2007, comparing the wellhead price of gas with the price of West Texas Intermediate (WTI) oil.) On Figure 6, I show the wellhead price per 1,000 cubic feet of gas and an estimate of the price of gas equal to 10.9% times the WTI oil price per barrel. Figure 6 shows annual averages for he years 1986 thorough 2007. For 2008, the amounts reflect recent May 2008 prices (WTI= 125.83; natural gas = 11.71). Recent natural gas prices seem to be lagging behind their historical relationship with oil, leaving some room for natural gas prices to rise.
What is tight gas?
Tight gas is natural gas found in reservoirs with low porosity and low permeability (generally sandstones with less than 1/10th of a millidarcy permeability). Tight gas requires multiple fracturing to in order for any significant amount of gas to be available. Drilling for tight gas has been compared to drilling a hole into a concrete driveway–the rock layers that hold the gas are very dense, so the gas doesn’t flow easily.
Until recently, tight gas was considered non-economic to produce. Recent technological advances in a number of different directions have made it increasingly possible to extract tight gas. The higher recent prices of natural gas have also tended to support unconventional natural gas production. There is a huge amount of tight gas in place. Even with technological advances, the challenge is finding a way to extract it economically.
Where can tight gas be found?
This is a map from the Advanced Resources International website.
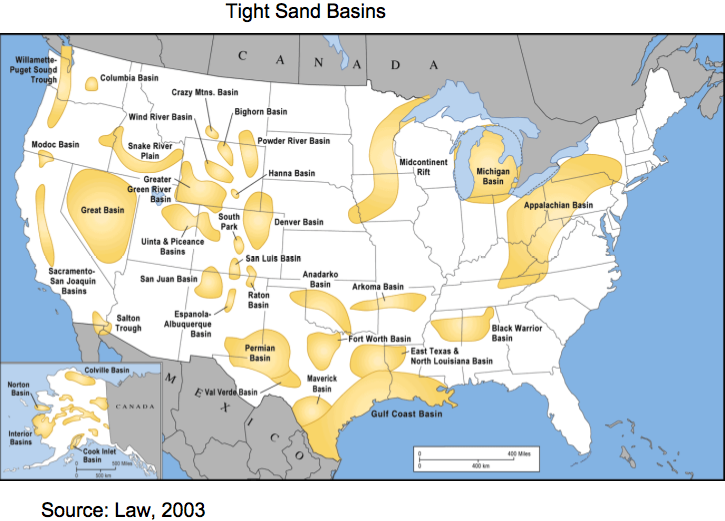
Based on Figure 7, one can see that tight gas resources are very widely distributed. When wells are drilled, there is a very high rate of successful (not necessarily economic, however) wells–approximately 98%. With such widely distributed resources, the challenge is finding “sweet spots” that can be more economically extracted, and developing techniques that will do this in a cost effective manner.
I have not shown maps of coal bed methane and shale gas, but they are also very widely distributed.
How does technology come into play?
Some examples where technology has come into play with tight gas formations include:
• Better technologies to find the “sweet spots” within formations.
• Research on the optimal spacing of horizontal wells.
• Developing fracing fluids and proppants for stimulating the wells, and determining which is right for each well.
• Developing low-energy deliquification methods to separate water from the natural gas.
• Developing ways of reducing the ecological footprint, such as drilling multiple horizontal wells from the same pad.
• Developing methods for drilling wells more quickly and at lower cost.
In presentations, a person sees graphs such as this one, showing efficiency gains. (EUR is estimated ultimate recovery):

The effect of these changes is to improve Energy Return on Energy Invested (EROEI), relative to what it otherwise would have been. With small changes, the economics can be improved enough to make a larger portions of sites economic, increasing the amount that is economically recoverable.
How has the amount of research on unconventional gas production been changing?
The amount spent on research and development has been falling. The amounts in this exhibit represent a summarization by ARI of the expenditures of 29 energy-producing companies.
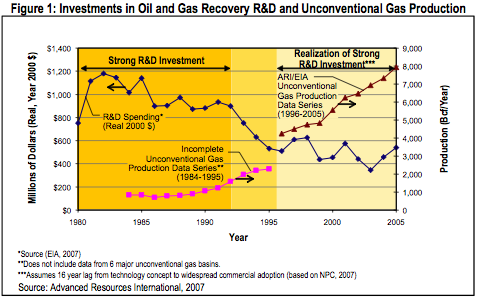
There is a long lag between research and its widespread benefit–estimated to average about 16 years by the National Petroleum Council. During the 1980s and early 1990s, the Gas Research Institute (a federal program) and the Department of Energy sponsored research programs. These programs contributed to the higher level of research spending during these periods. The research programs of the 1980s and early 1990s are now bearing fruit, in the form of increased unconventional gas production.
These research programs have been discontinued. Companies are continuing to do some research on their own, but the amount is lower. There is a very real difference between (1) a government program, with funding by companies and with applications tested at many different sites, and (2) each company doing its own research. If each company does its own research, it can patent the new application, and eventually use it to improve its own results. The present value of the benefit is relatively small, since it benefits only the company itself, and the timing is quite distant. It may eventually be able to sell the benefits to others, but this will take time.
If companies can work together on research through an organization such as the Gas Research Institute, the results can be shared widely, more quickly. These shared results benefit all, not just a single company. Because of this, the benefit to the industry and society as a whole is likely to come much sooner than with many small patents by individual companies. Because of the faster timing, the present value of the benefit of the combined research is likely to be higher than the sum of the present values of the independent research of the individual companies. The cross-fertilization of the combined research programs may also provide benefits. Anti-trust laws do not permit companies to work together in this fashion, without some federal program.
What are trends in well productivity?
One exhibit prepared by ARI shows declining well productivity.

Part of this decline in well productivity will be offset by the recent lower cost of drilling wells, because of efficiency gains. Some of it is expected–companies are now drilling more closely spaced wells, each draining a smaller area. The lower well productivity does makes it more difficult to maintain profitability, however.
How is profitability of the unconventional gas industry viewed?
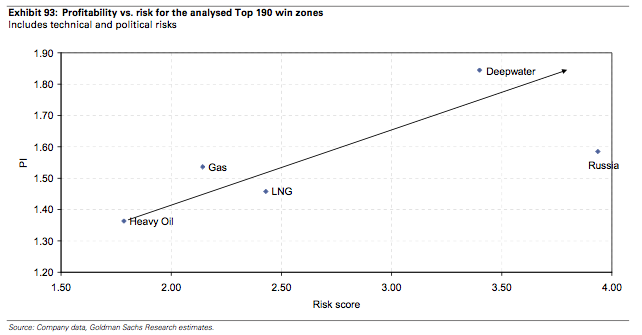
Figure 11 shows a recent profitability analysis by Goldman Sachs. It seems to indicate that the profitability of gas projects (nearly all unconventional) which are now underway is acceptable. Production of unconventional gas is viewed as low risk–the gas is easy to find; the trick is extracting it without losing money. Profitability is not expected to be as high as for some other types of ventures, because of its low-risk nature.
What are the prospects for unconventional gas going forward?
ARI shows this chart of its view of reserves and technically recoverable resources.
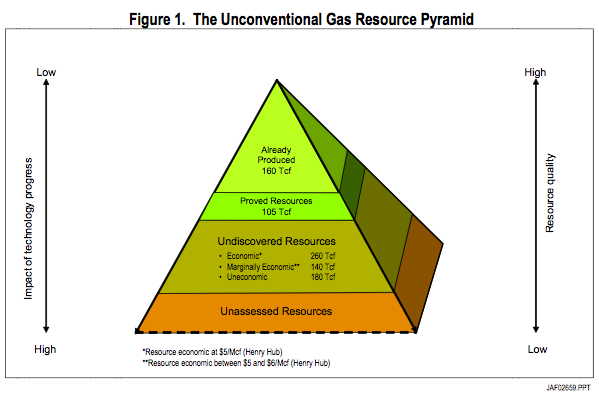
ARI characterizes the amounts it shows as merely a “snapshot in time” of its view of how much can be technically recovered, based on what is known about reservoirs today and current technology. ARI says its estimates are sometimes considered “aggressive”. ARI has been making estimates of this type for several years, and their estimates have been trending upward. It seems to me that there is a reasonable possibility that ARI’s estimates will prove to be accurate, or even low, with improving technology. They seem to have a good understanding of the industry, and the approach they use seems reasonable.
The third layer from the top of the pyramid is the amount ARI estimates to be technically recoverable, but that is not yet included in proven reserves. This layer totals 580 trillion cubic feet. The footnote indicates that 260 trillion cubic feet (of the 580 trillion cubic feet total) is estimated to be economically recoverable at a price less than $5.00 a thousand cubic feet; 140 trillion cubic feet is estimated to be economically recoverable at a price between $5.00 and $6.00 a thousand cubic feet; and 180 trillion cubic feet is estimated to be uneconomic at a price of $6.00 a thousand cubic feet. The current price is over $11.00 a thousand cubic feet, so some of the uneconomic layer may now be economic. Of the 580 trillion cubic feet of technically recoverable resources, ARI indicates 379 trillion cubic feet, or 65% of the total, relates to tight gas.
Other organizations provide estimates of technically recoverable unconventional gas resources using older data. In 2003, the National Petroleum Council put together an estimate using data through 1998. Its estimate, comparable to the 580 trillion cubic feet, was 206 trillion cubic feet. The USGS in 2006 estimated the amount of undeveloped continuous resources to be 306 trillion cubic feet.
How do the reserves and technically recoverable resources for unconventional gas compare to recent US natural gas production?
The pyramid in Figure 12 shows 105 trillion cubic feet of proven reserves for unconventional natural gas as of December 31, 2005, (second layer of pyramid). This level amounted to a little over half of US total proven reserves of 204 trillion cubic feet as of that date.
The latest date for which proven natural gas reserves are available is December 31, 2006. Proven reserves were then 211 trillion cubic feet, based on EIA data. Natural gas production for 2006 was 18.5 trillion cubic feet, so proven reserves amount to about 11.4 years of production. These are the published amounts, without consideration of future “resources”.
In Figure 12, ARI’s estimate of technically recoverable, but not necessarily economically recoverable, unconventional natural gas resources as of December 31, 2006 was 580 trillion cubic feet. If we add this full amount to the proven reserves of 211 trillion cubic feet as of the same date, we get 791 trillion cubic feet of possibly available resources. 791 trillion cubic feet amounts to a little less than 43 years of production at the 2006 level. If we include only the 400 trillion in resources estimated to be recoverable at $6.00 or less per thousand cubic feet, the total is 611 trillion cubic feet, or 33 years at 2006 production levels (for all natural gas, not just unconventional).
Clearly, if these resources are available, it could make a big difference to the amount of natural gas which can be produced going forward.
Where are we headed going forward?
If peak oil is approaching, the price of oil is expected to rise going forward. The price of WTI oil is now over $120 dollars a barrel, and many are talking about oil at $200 a barrel in the next year or two. If natural gas follows its historical pattern, its price will tend to rise as well. One might argue that the price of coal will hold the natural gas price down, but with all of the concern about global warming, and all of the electrical power plants that use natural gas, I think there is a good chance that the price of natural gas will tend to rise with oil, especially in North America. Higher prices will tend to make more of the unconventional natural gas economic.
Improvements in technology have clearly made a big difference in the amount if unconventional gas that can be recovered economically. With the slowdown in spending on research, technology improvements are likely to be smaller, but there will still be some improvements. It is unfortunate that the recent energy bills have not included funding for combined unconventional natural gas research, similar to that done by the Gas Research Institute. Even if 100% of the funding were from the industry, it would be beneficial from the point of enabling research on a combined basis, so that society could get the benefit of the research more quickly.
Discovery is not really an issue with unconventional–we already know pretty well where the resource is, and tools are available (or are being perfected) to find the sweet spots. The industry complains that there are considerable problems in actually trying to develop the resources. According to a presentation by Laramie Energy at an EIA conference, one problem is speculators who lease land with no intention of developing it. Another is the fact that 50% of Western land in owned by federal or local governments, and cannot be developed. Another issue is the numerous permitting requirements which delay production. There are also many restrictions because of endangered species, surface use restrictions, and local ordinances.
We hear the oil industry complaining loudly about access issues. I think they may really have a point; it can be very difficult to get access to the land where tight gas is located and take the necessary steps to produce the gas. If some of these access issues can be resolved, this too will help natural gas production.
Whether on not unconventional natural gas production will grow in the future will depend on price, technology, and access. Liebig’s Law of the Minimum may also play a role. While we often write off US natural gas, it seems like there is at least a possibility that the unconventional natural gas will make up for the decline in conventional natural gas. The rise in unconventional natural gas production may even permit a small increase in total US natural gas production, and reduce the need for imported LNG.
US natural gas production in 2007 was at its highest level in since 2001, and 2008 production is starting off the year higher than 2007. While no breakdown is available into conventional / unconventional, it is pretty clear that it is unconventional production that is giving the production boost. Natural gas proven reserves have been rising for several years. I think that production of unconventional natural gas is something we need to be examining more closely. The EROEI of unconventional natural gas is not very high, but there is a huge amount of it.