This is a guest post by James Hamilton, Professor of Economics at the University of California, well known for work on the relationship between oil prices and economic growth. The article originally appeared on his blog EconBrowser
-TOD editor Rembrandt.
As U.S. retail gasoline prices once again near $4.00 a gallon, does this pose a threat to the economy and President Obama’s prospects for re-election? My answer is no.
The graph below plots average U.S. gasoline prices, adjusted for inflation, over the last decade. This is now the fourth time we’ve been near the $4 threshold. It first happened in June 2008, again in May 2011, and again in April of this year. In fact, on each of those previous 3 occasions the average U.S. retail price of gasoline was higher than it is today.

Figure 1. Monthly real gasoline price, Jan 2002 to Sep 2012. Data source: monthly gasoline price from EIA, with value for September representing the weekly September 17 value. Expressed in units of August 2012 dollars by multiplying by ratio of August CPI (from FRED) to that of the reported month.
The first time something like this happened in 2008, it was quite a jolt to consumers and to the economy. In fact, the U.S. is still in the process of adjusting to that shock 4 years ago. The vehicles that many Americans were driving at the time just don’t make sense if you have to pay $60 or more every time you visit the gasoline station. Even so, you don’t get rid of the old gas-guzzler right away, but make sure you change when you buy a new one. The average fuel economy of new U.S. cars purchased has been steadily increasing since 2008.
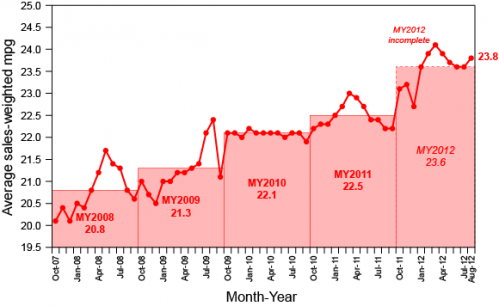
Figure 2. Average sales-weighted fuel economy of purchased new vehicles for October 2007 through August 2012. Source: UMTRI (hat tip: Peak Energy and Early Warning).
Total vehicle miles traveled also takes time to adjust, as people change their home, job locations and other habits.

Figure 3. Moving 12-month total of vehicle miles driven on all U.S. highways through June 2012. Source:
Federal Highway Administration.
The initial adjustments associated with that process were quite disruptive to the economy. For example, sales of light trucks and SUVs manufactured in North America plunged in the first half of 2008, and the hit to the auto sector made an important contribution to the first year of the Great Recession. Sales of this category for August of this year were still 20% below the average August value over 2003-2007.
Figure 4. Data source: Webstract.
By contrast, sales of lighter cars are now back up near their historical average, allowing the auto sector to be able to make a solid contribution to recent U.S. economic growth.
Figure 5. Data source: Webstract.
It’s also interesting to look at how the response of consumer sentiment to gasoline prices has changed over time. The blue line in the graph below shows the same real gasoline price series plotted in Figure 1 above, except now drawn on a negative scale (shown on the right-hand axis); that is, the lower the blue line, the higher the price of gasoline. I plot it this way to highlight its relation to consumer sentiment, shown in black and labeled on the left-hand axis. When real gasoline prices first reached $3.50/gallon in 2005, consumer sentiment plunged sharply. When it happened again in 2006, the response was more modest, and on the third time in 2007, it didn’t seem to faze consumers. It was only when gasoline prices went on from there to make new highs in 2008 that we saw sentiment plunge again.
Figure 6. Consumer sentiment and negative of real gasoline prices, Jan 2002 to Sep 2012. Black line: Reuters/University of Michigan index of consumer sentiment (left scale). Data source: compiled from contemporary news accounts. Blue line: negative of real retail price of gasoline (right scale), from Figure 1.
By the second time gas threatened $4/gallon in the spring of 2011, the memory of 2008 had receded somewhat, and consumer sentiment fell sharply. It was much more muted when the same thing happened again just one year later. And right at the moment? Consumers seem to be shrugging it off. Nobody is surprised this time, having seen the same thing twice before over the last year and a half. Many of the adjustments people are making today were in fact set in motion 4 years ago.
There is quite a bit of empirical support for the claim that the second or third time oil prices move back near a previous high, the economic disruption is significantly less than the first time; see for example the evidence and literature reviewed in my 2003 Journal of Econometrics paper (ungated version here) and two recent surveys [1], [2].
$4/gallon? Been there, done that.