
There has been much speculation on these blog pages about the existence of OPEC spare capacity. The oil rig count for Saudi Arabia, Kuwait, Abu Dhabi and Qatar (SKAQ) provides some clues. The sharp rise in operational oil rigs in February 2011 suggests to us that usable spare capacity does not exist and that new useful capacity (light sweet?) must be built by drilling new wells. This takes time. It also suggests that there is goodwill among these OPEC members to try and boost supply to tame oil prices.
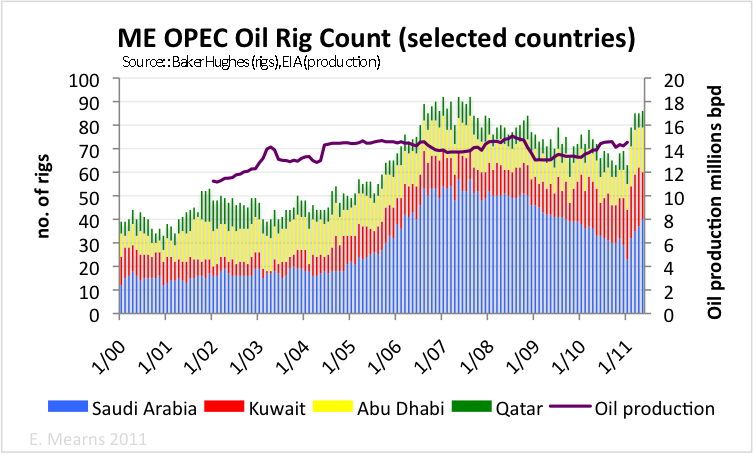
Figure 1 International oil rig count from Baker Hughes. Rig count data for Iraq and Iran are incomplete and not plotted. Production data from the EIA.
This post is joint with long term TOD contributor Rune Likvern.
Disclaimer: neither author holds any energy related investments.
The chart of OPEC spare capacity shows spare capacity running at around 4.5 mmbpd. It seems quite clear that if SKAQ could simply turn on taps to produce more usable oil then they would not be scrambling rigs right now. If the spare capacity does in fact exist, then it must be of sour and heavy grades of crude that cannot substitute for the loss of 1.6 mmbpd light sweet crude from Libya.
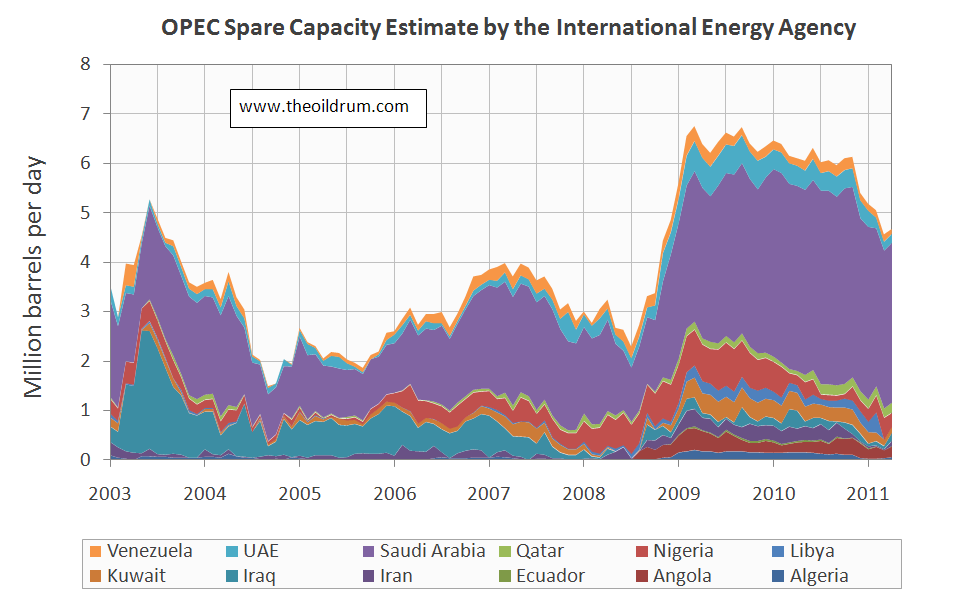
Figure 2 OPEC spare capacity estimates from the International Energy Agency. Chart courtesy of Rembrandt
Different types of wells
Baker Hughes provide three categories of wells: oil, gas and miscellaneous. For SKAQ, plotted in the chart up top, the miscellaneous column is empty, hence we are looking at simple split between oil and gas. Wells can be drilled for 4 main functions:
1) Exploration
2) Production wells
3) Work overs – intervention to improve well performance
4) Water (gas) injection – to maintain reservoir pressure
It has to be assumed that the oil rig count encompasses all of these functions. Exploration wells will not lead to increased production in the short to medium term. But drilling production wells, workovers and injection wells will lead to an increase in production if the combined new production capacity is in excess of declines for a given country.
Understanding the rig count
We quite often find that when we have an idea for a simple post that the data are far more complex than we expected it to be. This is such a case.
Key observations:
1. Oil production from the SKAQ countries has been stable at around 14±1 mmbpd since 2003, this despite rig count varying and rising from 40 to 90 operational oil rigs.
2. Spare capacity shows much wider variance from about 1.5 mmbpd in 2004 to > 6.5 mmbpd in 2009.
It may therefore be deduced that these OPEC member states produce according to their quotas. They drill wells when needed to develop new fields etc, and these are kept in reserve until declines dictate they are brought on stream to maintain production levels. The thing that distinguishes these prolific OPEC producers from the more conventional OECD operators is that they still have an inventory of discovered assets to drill and are therefore able to offset declines in one area with new production and thus maintain stable production profiles. This situation may persist for a fair while yet.
The bigger picture
And so what of the much vaunted failure of Saudi Arabia to meet the shortfall produced by Libya going off line and the recent announcement of the IEA that it was to raid OECD strategic reserves? Understanding exactly what is going on and what is about to happen requires a careful look at data and markets that are increasingly manipulated by government.
The chart below (Figure 3) shows oil price (weekly average Brent) and petroleum products (gasoline, heating oil etc) supplied to the US market. The latter may provide a proxy for economic health. Note the sharp decline in petroleum products accompanying the 2008 crash! Demand for petroleum products in the USA showed weak growth in the period July 2009 to Dec 2010, peaking in that month. Since then, throughout 2011, demand for petroleum products has been in decline with signs of lower highs and lower lows on the chart. The 52 week MA has turned down. Is this a leading indicator of recession? Broadening the outlook to look at OECD petroleum demand shows the 12 month moving average turning down (Figure 4).

Figure 3 Weekly consumption of petroleum products in the USA and weekly average price of Brent. All data from the Energy Information Agency (EIA).
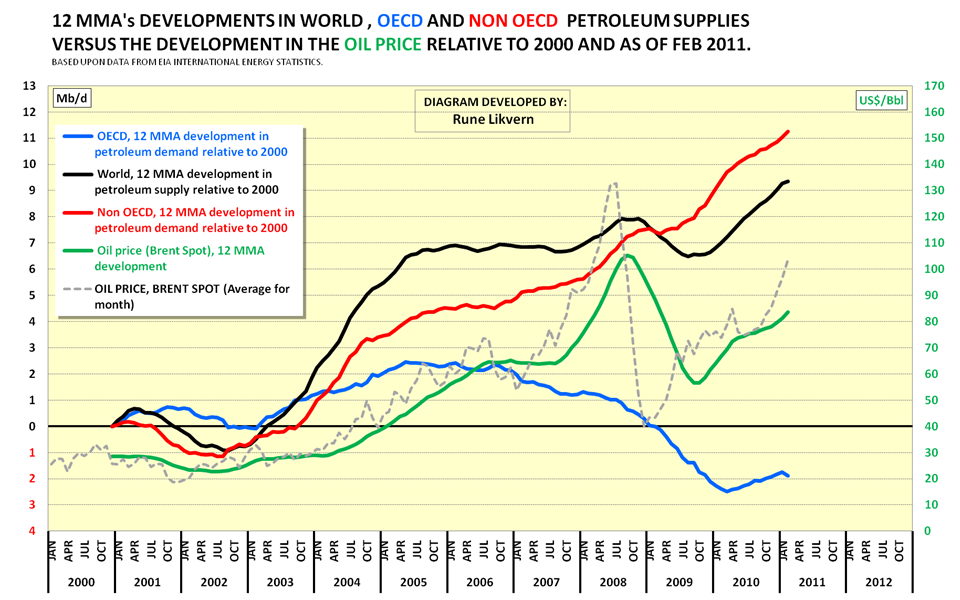
Figure 4 Petroleum consumption in OECD and non-OECD. Note that 12 month moving averages are plotted. Key observations are 1) the divergence of OECD and non-OECD since 2005, the non-OECD going up in the world, the OECD going down and 2) a hint that OECD petroleum consumption is once again turning down. The recent trend in US petroleum products consumption lends strength to the notion of declining demand in important parts of the OECD.
The top of the recent price spike (so far) was $126.59 on April 28th. Prices fell back since then but showed temporary revival mid June following the disorganised break up of the OPEC meeting. The revival was short lived, and on Thursday 23rd June, Brent was clinging to its $110 support when the IEA announced their raid on the OECD SPRs, sending Brent sharply lower.
Where does Libya fit into this picture? In 2010 Libya produced 1.659 mmbpd of mainly light sweet crude and much of that has been lost to the market. The civil conflict got properly underway mid February and at the time added around $10 to already sharply rising oil price. Our speculation is that global demand was already slowing at this time, with certain OECD economies already buckling under rising and high oil prices. Hence the loss of Libyan oil may have coincided with slowing demand, and it has not yet been necessary for OPEC to officially cut supplies to support price since the Libyan conflict has already done this job for them. Note that demand for petroleum products has fallen by >1mmbpd in the US alone so far this year.
Our speculative reading of the current situation therefore is that a second recessionary dip may already be underway in certain oil importing OECD countries, with slowing demand creating over supply and weak price. Meanwhile, the SKAQ countries have responded to OECD appeals and have increased drilling activity to create more spare capacity. And the IEA has signaled their intent to flood this market with oil.