If we look at a graph of historical world oil production, we see a somewhat bumpy production pattern with two major price spikes (in 2009 $)–one peaking in 1981 and one peaking in 2008.
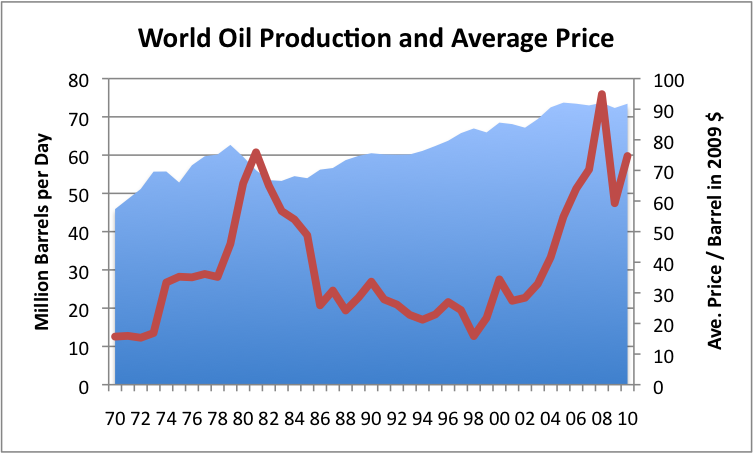
Figure 1. World oil (crude and condensate) average daily production and refiners average acquisition cost in 2009 $, both based on EIA data. 2010 is partial year through September 30.
The first spike in prices occurred when Persian Gulf production dropped starting in 1980, so seems to be oil supply related. The second spike occurred when world oil production would not rise above a bumpy plateau, despite rising demand, in the 2005 to 2008 period.
In this post, I will show some breakdowns that I think give a little insight into our current situation.
All of the graphs that I have made are from EIA’s International Petroleum Monthly. The data I am showing oil production is “crude and condensate”. For price, I show US refiners average acquisition cost, since this is a data series that goes back to 1968. I have adjusted prices to 2009 levels using the US GDP deflator. The amounts shown reflect US prices; the price trend in other parts of the world would be affected by the relative value of the dollar, so would be a little different.
Persian Gulf Issues
One of the breakouts the International Petroleum Monthly shows in its data is called “Persian Gulf”. It consists of the production from Bahrain, Iran, Iraq, Kuwait, Qatar, Saudi Arabia, the United Arab Emirates and the Neutral Zone. In Europe and Arabian counties, this grouping might be called the “Arabian Sea,” but I have used the naming convention of the EIA and US-made maps. If we look at a graph of Persian Gulf oil, we find that it has two big humps to it.
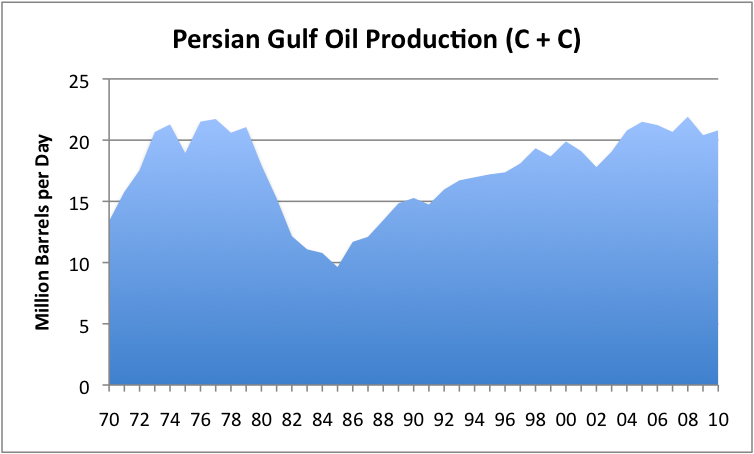
Figure 2. Graph of Persian Gulf oil (crude and condensate) production based on EIA data.
If we overlay the same oil price information as used in Figure 1, we see that a big drop in Persian Gulf oil production immediately preceded the 1981 spike in prices. We also see that there wasn’t much of a Persian Gulf increase in oil production in response to the 2003-2008 rise in prices, which is no doubt a big reason prices increased so much.
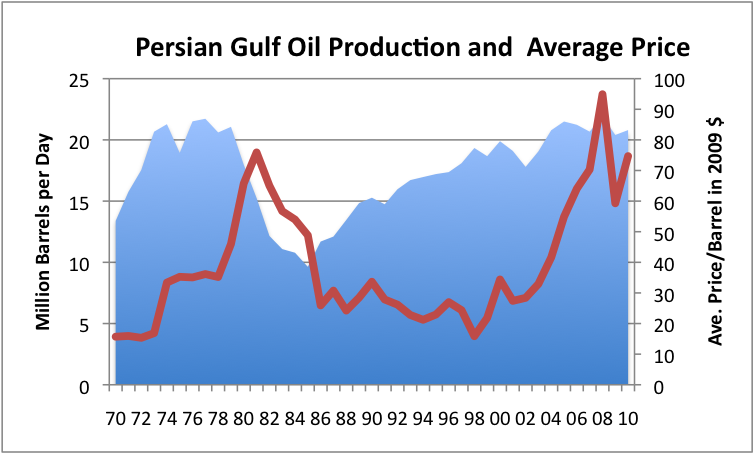
Figure 3. Persian Gulf oil production and average price, based on EIA data.
If we look at the prices in Figure 3, there is a big jump in prices occurring about 1974, (actually starting October 1973), corresponding an oil embargo by Arab members of OPEC. There was not really a major change in production at that time, however. The US was especially affected by the embargo, and the graph shows that US oil prices roughly doubled then.
What can we learn from this graph? For one thing, Persian Gulf oil production is now approximately at the same level it was at in the 1970s. While OPEC talks big, Persian Gulf production doesn’t really follow the upward trend line one might expect if the countries are really able to significantly ramp up production above the level of 35 years ago.
We also see that a drop in oil production from the Persian Gulf nations seems to have played a role in the previous price run-ups. We know OPEC played a role in the 1974 US price run-up. It is pretty clear from the graph that a reduction in oil from the Persian Gulf played a major role in the 1981 oil price spice (through cutbacks in production related to disruptions such as the Iranian revolution and the Iran-Iraq war). Based on these experiences, it seems as though leaders of the US would be worried about stability of oil supply from the Persian Gulf.
Not long after these problems, the Persian Gulf members of OPEC raised their reserves in the 1980s, without actually finding more oil–the increases seemed to be motivated by wanting higher OPEC quotas.
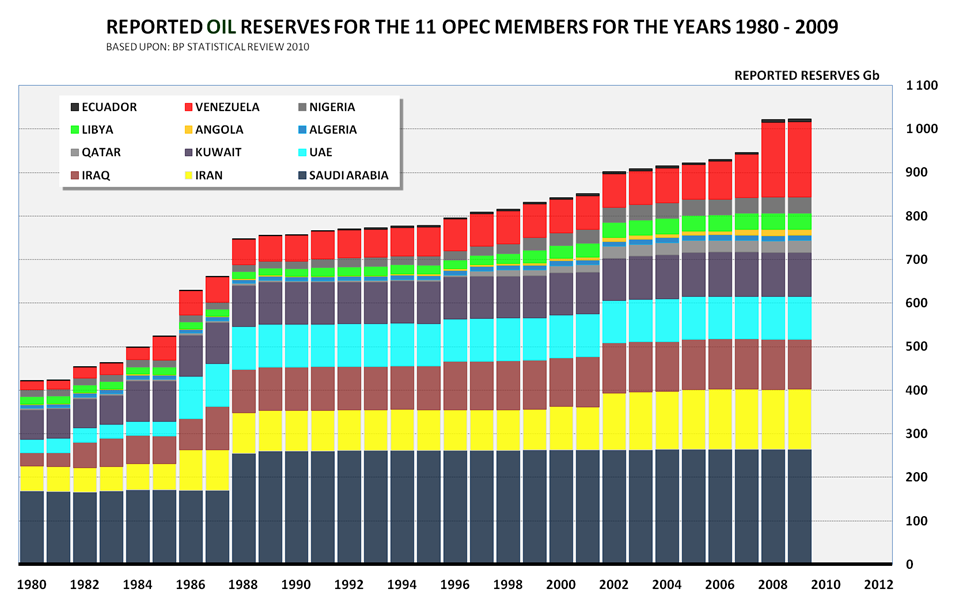
Figure 4. OPEC reserves based on BP Statistical Report data. Graph by Rune Likvern of The Oil Drum.
With the history of instability of supply in the Persian Gulf, and the apparent lack of physical explanation for the increase, it seems as though US leaders could have told the US people:
Don’t really believe the new reserve numbers. They are not audited, and appear to be politically motivated. The folks from the Persian Gulf have caused problems with world oil supply in the past. We need to be cautious in dealing with them.
But instead, we saw increased friendliness with Saudi Arabia, and increased intervention into Persian Gulf affairs. No one mentioned the possibility that reported oil reserves might be overstated. The American people were only told about the general dangers of imported oil, not the specific way that we seemed to be being misled. All of this seems more than a bit odd.
Recently, OPEC has been claiming a huge amount of spare capacity–now 5.6 million barrels a day, according to IEA. But in the 2004 to 2008 price run-up, the Persian Gulf nations didn’t come to the world’s rescue, except to a very limited extent – a bit over 1 million barrels a day. This adds further to the oddness of the situation.
Many people who are concerned about oil supply expect that the Persian Gulf nations will help us out in the future. But looking back, we need to understand that this is historically an unstable area. While there is a possibility of increased supply (especially from Iraq), we haven’t seen much recent evidence of the Persian Gulf’s ability to ramp up production by more than a small amount. If King Abdullah of Saudi Arabia should die and there were to be a problem with succession, or if there should be a Middle Eastern war, we could see a decline in oil production rather than an increase. Persian Gulf leaders talk “big”, but it is not clear that we should believe them.
Other Major Groupings
Apart from the Persian Gulf, some other major oil producing areas are the following:
The former USSR:
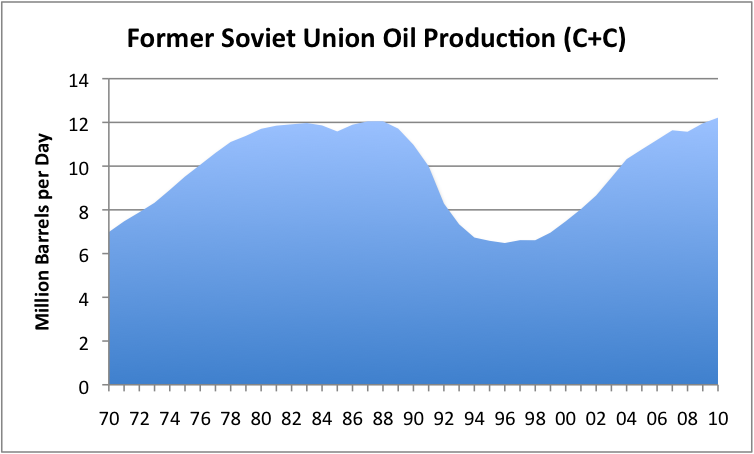
Figure 5. Oil production from the Former Soviet Union, based on EIA data (crude and condensate).
The Former Soviet Union (FSU) saw a big dip in production at the time of its fall. This drop in production was no doubt related to the breakup of the FSU. In fact, it may have been a contributing cause to the breakup. The big drop in oil production occurred when oil prices were low. As oil prices rose, and as newer technology was added, the FSU was able to ramp up production to the same level it was prior to the collapse of the FSU. Production may continue to rise a bit if prices remain high. No one is expecting a huge additional ramp-up, however, because Russia seems to be running out of large new oil fields to put on line.
The USA:
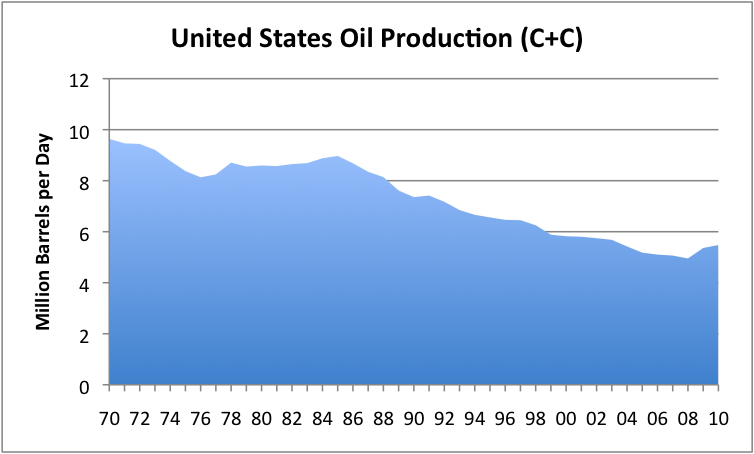
Figure 6. US (crude and condensate) oil production, based on EIA data.
Oil production of the US has been falling since 1970. Addition of oil from Alaska helped produce an upward “bump” in the 1984 -1986 time-period. More recently, increased deepwater oil production and increased production from the Bakken has produced a small upward bump of about a half million barrels a day. Most of this increase relates to deepwater drilling. We will need to maintain our deepwater drilling if this higher level of production is to last for a few more years. Otherwise, we can expect the downward trend in production to continue.
North Sea:
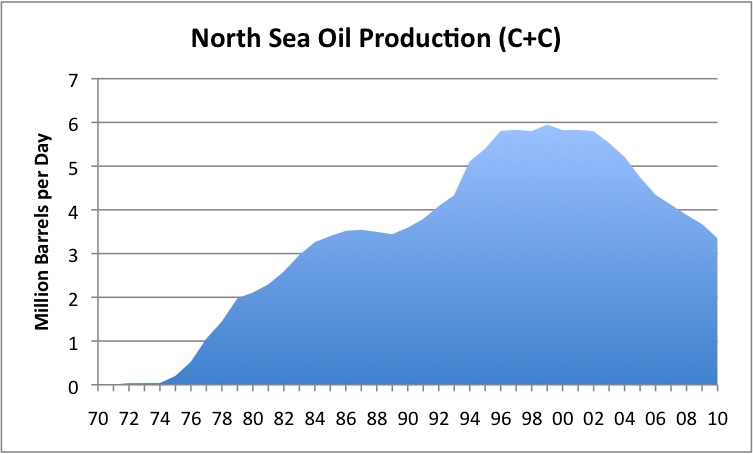
Figure 7. Oil production from the North Sea, based on EIA data.
Oil production from the North Sea is Europe’s story–initially a happy one, but now a sad one. Oil production reached a peak in 1999, and now is declining every year, even with infill drilling. It is hard to see that anything can be done to make the situation better. Some platforms are likely to become unprofitable as production declines, and need to be permanently taken off line. Removal of platforms could result in a steeper drop in production.
All of the rest of the countries in the world, combined:
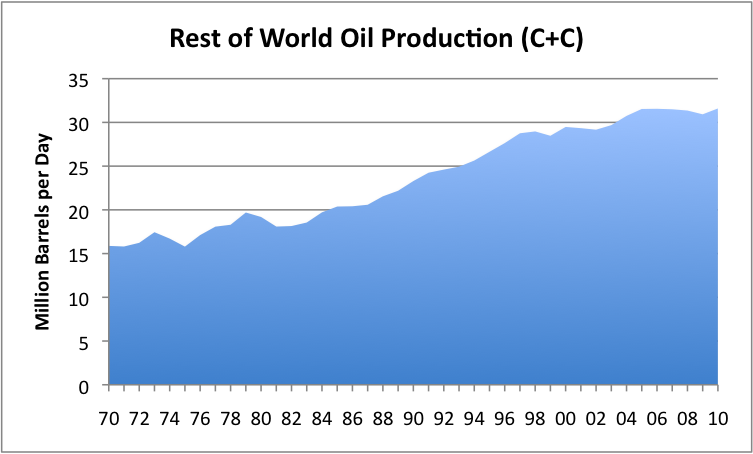
Figure 8. Oil production (crude and condensate) for the rest of the world based on EIA data.
This category includes all of the locations with smaller production amounts around the world. It includes areas such as Angola and Brazil, which have recently been growing their production. It includes Canada and its oil sands. It includes all of the new countries we have been hearing about like Uganda. But it also includes many countries where production has been taking place for many years, and which are now in decline, such as Mexico.
Production from this group of countries was rising until 2005, but has been pretty much flat since. It remains to be seen whether production from this group can rise again. If production does rise from this group, one might expect that it would rise gently, since individual new fields tend to add only a small amount, and since most of the increases that are being added are being offset by declines elsewhere.
If prices stay high, there is a possibility that production for this grouping might slowly rise, adding a few million barrels a day over the next 20 years. But given this grouping seems to already be on a plateau, there is also a possibility that production could start to decline within the next few years.
Summary
Countries in the Persian Gulf would like us to believe that there are great prospects for higher production from the area. Looking back at historical production and past changes in stated reserves, we should be a little cautious about believing what we are told. We should keep in mind that there are possibilities for disruption in oil supplies from that area as well possibilities for increases. The stories we are being told about higher productive capacity may be just that – stories.
The North Sea will no doubt continue to decline in its oil production. The US with its long-term decline also faces challenges. Unless a high level of deepwater production is maintained, it is likely that US oil production will again begin to decline.
The FSU and the Rest of the World have at least the possibility of increased production, but these increases are likely to be relatively small, based on past patterns.
In total, world oil production is unlikely to rise by much, and may fall in ways that are hard to predict in advance.