
My post is mainly an update to OPEC’s Spare Crude Oil Capacity – Will it Disappear by the End of 2011?, based on data which the EIA reported in the past few days. I will also briefly present updates to recent developments in OECD and Non OECD oil supplies/consumption.
The stacked columns shows crude oil and condensates supplies split on OPEC, Russia and ROW (Rest Of World) which also includes OECD, from January 2001 through June 2010. The development in the average monthly oil price is plotted on the left hand y-axis.
Note that world oil production has been on a plateau, from late 2004 to the present, with a small dip when prices dropped in late late 2008 to early 2009. This graph considers crude and condensate only, excluding natural gas liquids and other forms of liquid energy, such as biofuels.
DISCLAIMER: The author holds no positions in the oil/energy market that may be affected by the content of this post.
NOTE: Scaling varies from chart to chart and some charts are not zero scaled. Labels indicate whether graphs are on an “all liquids” or “crude and condensate” basis.
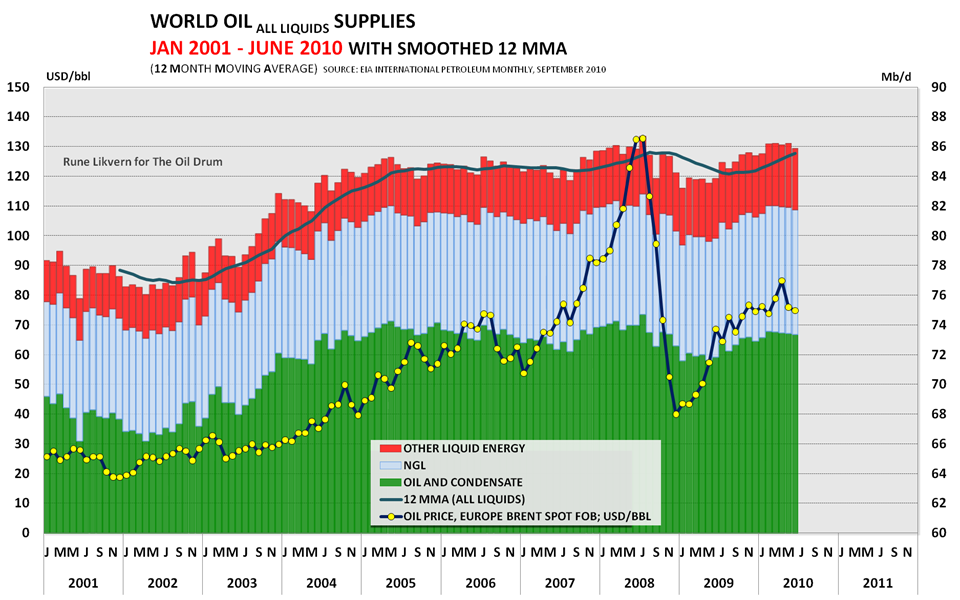
Figure 01: The stacked columns in the diagram above show development in global supplies of crude oil and condensates, NGLs and other liquid energy from January 2001 though June 2010. The development in the average monthly oil price is plotted on the left hand y-axis. NOTE: Diagrams based upon EIA data may be subject to future revisions.
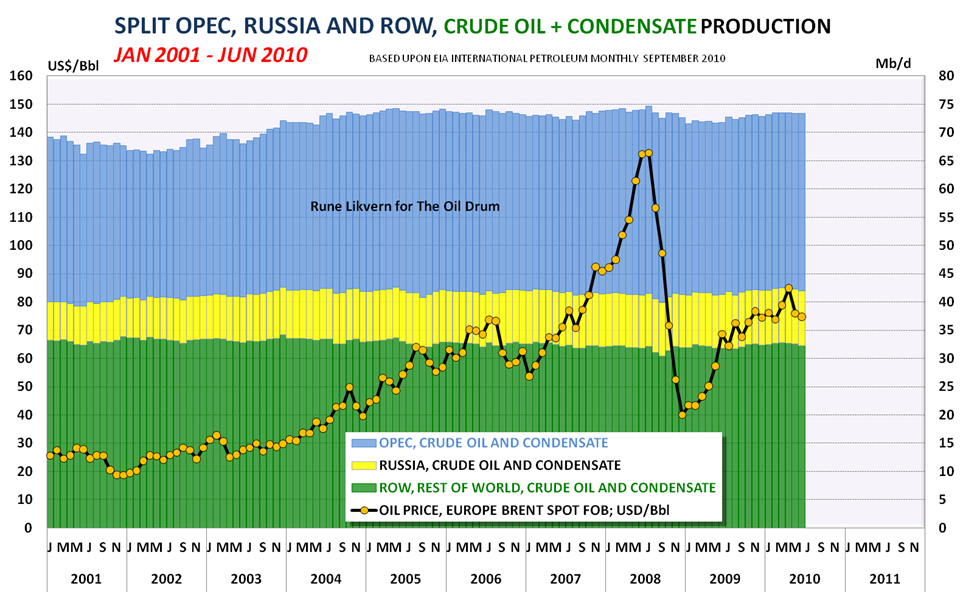
Figure 02: The stacked columns shows crude oil and condensates supplies split between OPEC, Russia and ROW (Rest Of World; which also includes OECD), from January 2001 and as of June 2010. The development in the average monthly oil price is plotted on the left hand y-axis.
Over the period covered by the graph (2001 to present), growth in Non OPEC supplies have primarily come from Russia. Oil supplies from the “Rest of World” (ROW) have not grown.
The long bumpy plateau from 2004 to the present illustrates that huge swings in oil prices in recent years have had only small effects on crude oil and condensate supplies.
EIA in their STEO (Short Term Energy Outlook) for September 2010 projected a slight decline in OECD and Russian petroleum supplies from 2010 to 2011. Under most circumstances, it could be expected that most of these declines would be offset by growth in OPEC supplies.
It is expectations like these that will make 2011 an interesting year to follow developments in global oil supplies. If the wheels on the global economy remain on, global oil supply may be stretched, as I pointed out in my earlier post.
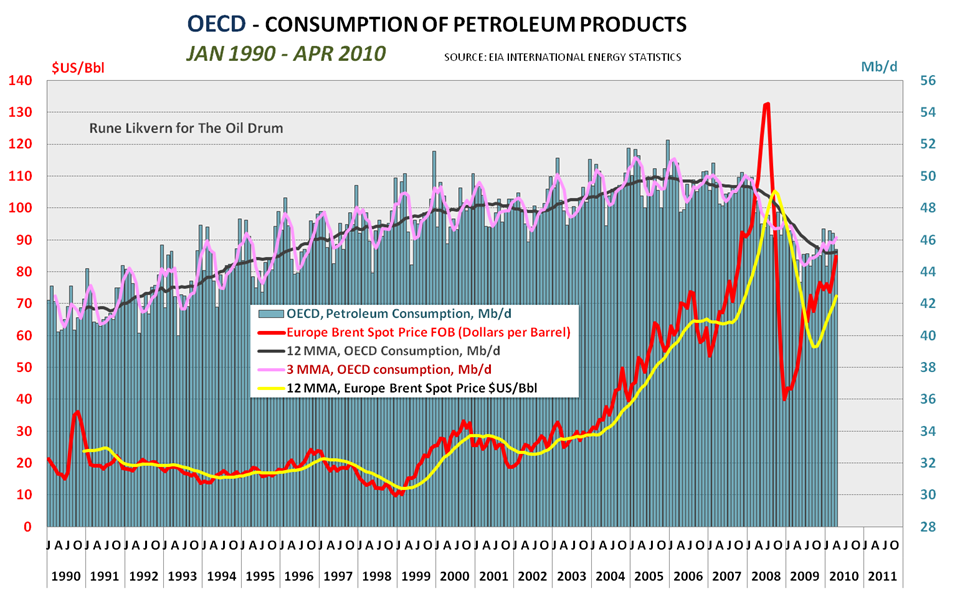
Figure 03: The diagram above shows development in OECD consumption of petroleum products between January 1990 and April 2010 together with the development in the oil price.
In the recent months, petroleum consumption within OECD has seen some growth and this coincides with the recent growth in the oil price.
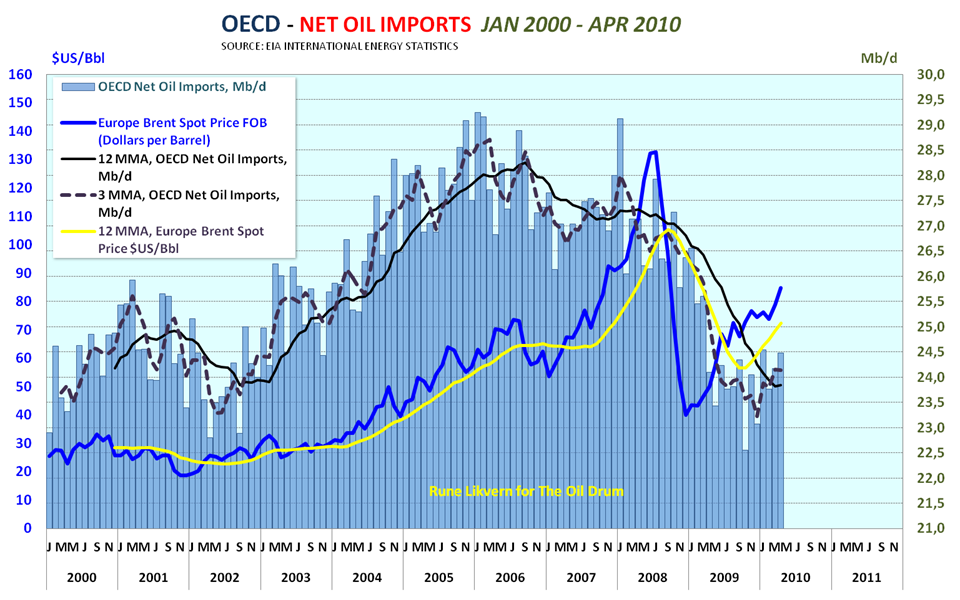
Figure 04: The diagram shows development in net oil imports for OECD from January 2000 through April 2010.
This diagram shows that the recent oil price growth happened as OECD again started increasing oil imports. This is one of the indicators suggesting that the oil price now has strong support based on fundamentals.
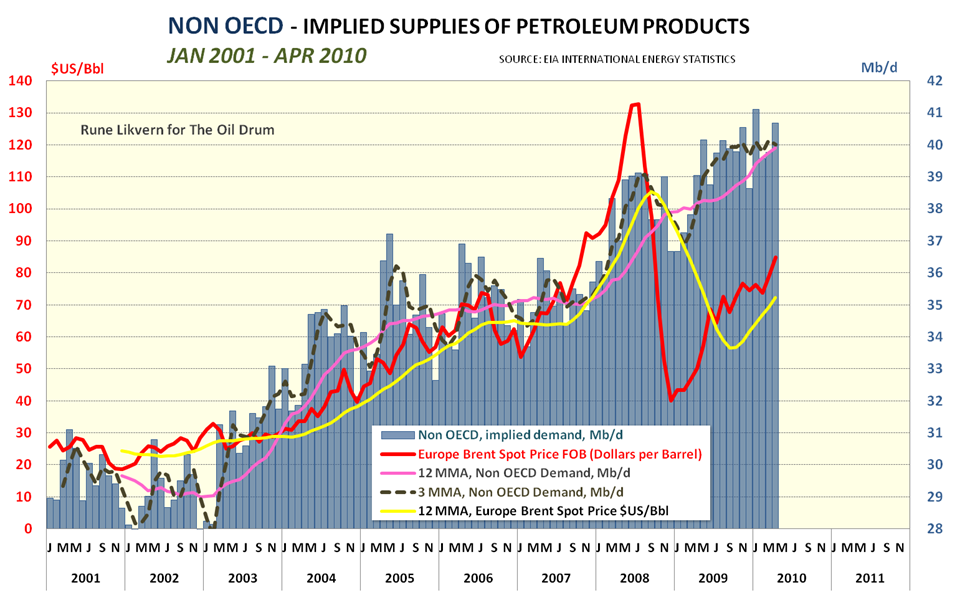
Figure 05: The above diagram shows implied demand for liquid energy from Non OECD countries from January 2001 through April 2010. (I describe it as implied demand as the diagram shows the difference between total global supplies of liquid energy and OECD supplies (production + net imports)).
Recently, demand for petroleum products from Non OECD seems to have leveled out as illustrated by the 3 MMA (3 Month Moving Average). (I use the 3MMA both to more easily identify seasonal variations and also to act as a “pilot” for trends over several months.)
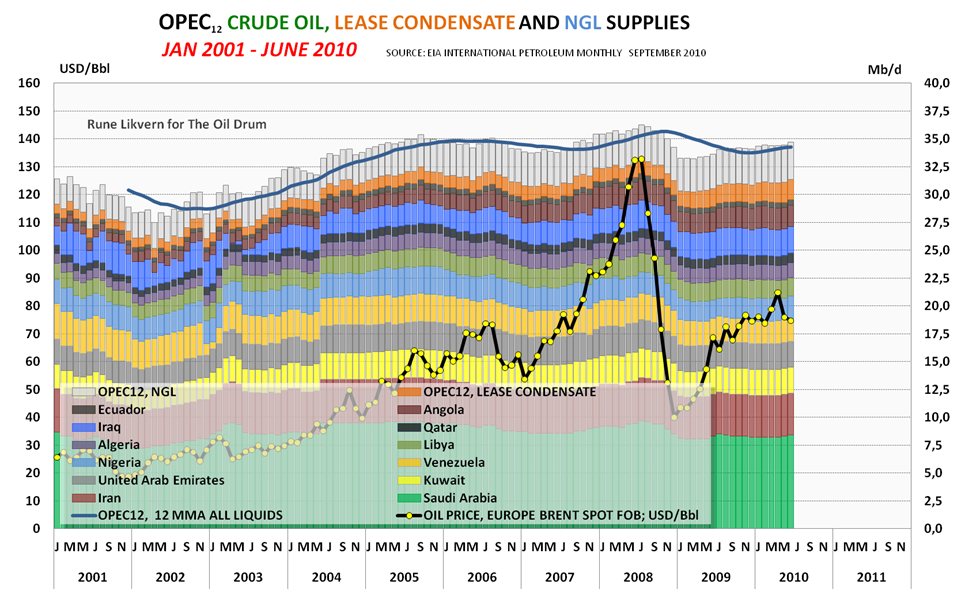
Figure 06: The stacked columns show each OPEC member’s crude oil supplies and OPEC’s supplies of lease condensates and NGLs from January 2001 through June 2010. The average monthly oil price is also plotted on the left hand y-axis.
The recent data from EIA shows a small growth in supplies of crude oil, condensates and NGLs from OPEC. (Lease condensates and NGLs are presently not part of OPEC’s quota arrangements.)
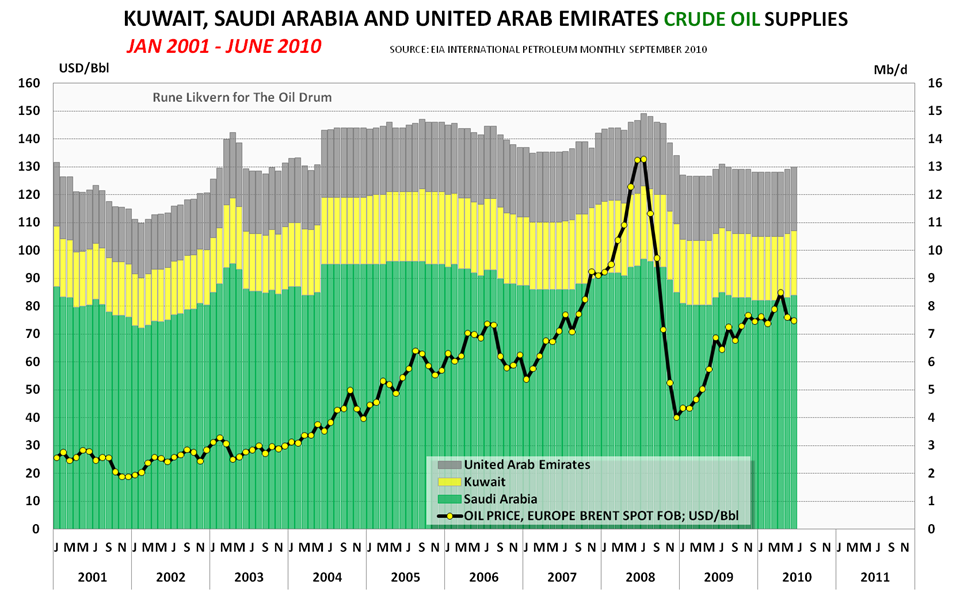
Figure 07: The diagram above shows crude oil supplies from January 2001 through June 2010 (data may be subject to future revisions) for Kuwait, Saudi Arabia and United Arab Emirates.
I believe most of present global spare marketable crude oil capacity is to be found amongst the 3 exporters presented above. Saudi Arabia increased their crude oil supplies by 200 kb/d between April and June of this year. It is not clear whether one can conclude that this caused some retreat in the oil price, but it is an interesting coincidence.
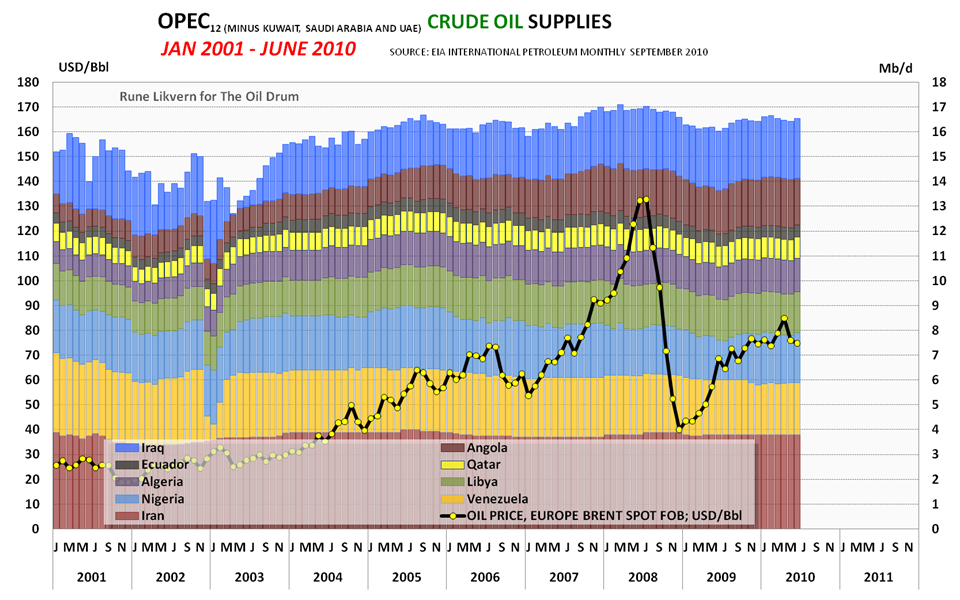
Figure 08: The stacked columns shows developments in crude oil supplies from the 9 other OPEC members. The average monthly oil price is plotted on the left hand y-axis.
Total crude oil supply from the 9 OPEC members above have remained relatively high and flat during the recent months, suggesting that these countries are pumping at maximum levels, regardless of price.
In summary, September’s International Petroleum Monthly confirms a continuation of the trends I had noted in my earlier post. The next 15 months may be interesting ones!
SOURCES:
[1] EIA, INTERNATIONAL PETROLEUM MONTHLY, SEPTEMBER 2010
[2] EIA, INTERNATIONAL ENERGY STATISTICS
[3] EIA, SHORT TERM ENERGY OUTLOOK, SEPTEMBER 2010


