Everyone knows that it takes energy to produce anything. The energy used in mining, transport, processing, manufacturing, delivery, and disposal is “embodied” in every product we consume, from food to diapers to televisions and insurance policies. Our traditional way of looking at energy, however, highlights only current consumption, traditionally disaggregated into agricultural, industrial, transportation, commercial, and residential sectors. As a result, the energy embodied in the food we eat, for example, is reported as energy consumption across all these sectors, making it difficult to assess the full energy impact of our consumption choices. Looking at urban energy consumption from this traditional framework diminishes the role of people in driving urban energy consumption.
Because cities are the source of the majority of energy consumption in many industrial and high population countries, much research is underway to promote development of “Low Carbon Cities,” a concept that to date has primarily focused on ways to reduce the impacts of current energy consumption in transportation and buildings. This is especially true in China, where urbanization has yet to reach 50% and the government is projecting the urbanization of an additional 350 million people—greater than the population of the United States—over the next 15 years. All of these new urban residents will need accommodation, schooling, health care, appliances, energy supply, transportation, food, clothing, water, sewerage, and other services, and the potential energy impact is enormous.
A typical Chinese urban resident consumes 3 times as much commercial energy as a rural resident (in total energy terms, rural residents consume more, but the majority is inefficiently combusted biomass, which is often ignored in energy reporting). Consequently, the Chinese government is looking to require cities to develop low-carbon action plans to respond to growing urban energy needs. For the most part, these low-carbon action plans focus on ways to reduce the growth of current energy consumption and to supplant some portion of it with non-fossil energy sources.
But is a focus on current energy consumption enough? Analyzing the current energy consumption of a city alone can lead to conclusions that urban areas, particularly dense urban areas, are relatively efficient, largely because per-capita current energy consumption is lower than in dispersed urban or suburban arrangements. This is indeed often the case. But what is not measured as part of the energy impact of urban areas is the built space itself—the streets, pavement, buildings, utilities, tunnels, etc.—that are required to maintain such a dense arrangement of humans, nor does it take into account the energy used to manufacture, transport, and sell the array of consumption goods and services that urban residents purchase. Since urban areas exist for people, looking at the urban energy footprint from the point of view of its inhabitants’ impact can provide additional insight into the nature of urban energy use.
The model used to make these calculations was built in support of an ongoing series of training workshops for city officials in China. The goal was to minimize data input requirements in order to make it user-friendly for city planners. Basic data on the city’s location, population and households, income and expenditures, building floorspace and building types, infrastructure (road, rail, subway length), and vehicle fleet are the basic input parameters. Calculations of current energy consumption and embodied energy use were based on intensity data in the China End-Use Energy Model at LBNL for the appropriate climate zone. In order to compare results on an annual basis, embodied energy calculations were (where relevant) divided by lifetime (e.g. 30 years for buildings, China’s current average).
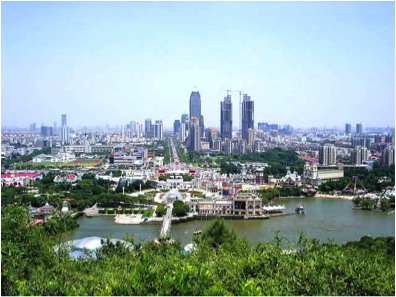
The test city for the model was Suzhou (Figure 1), a large city of 6 million population located west of Shanghai in Jiangsu province. Suzhou is a prosperous city with an economy dominated by heavy industry, which accounts for 80% of the city’s energy consumption. It is home to Shagang, the 7th largest steel producer in the world with an output in 2009 of 26 million tonnes, equivalent to 45% of total US production in that year.
Much of this steel, however, is not consumed by Suzhou residents, and thus this large industrial component falls out of the model; instead Suzhou steel consumption is captured in the infrastructure and building use of steel and in the steel used to make products consumed by the residents, such as automobiles and refrigerators. Similarly, Suzhou residents eat food that is in part not locally grown, but the energy used to produce and transport this food to Suzhou is included in the calculation. In this way, the model creates a picture of Suzhou energy consumption oriented towards the people who are responsible for its consumption, and excludes energy consumption of those goods and services produced in Suzhou and consumed elsewhere.
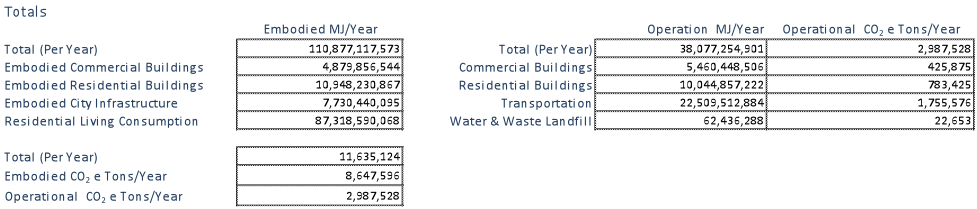
Overall Findings
The results for Suzhou are shown in Table 1, indicating that the city’s energy footprint, in both current and embodied terms, totals about 111 billion MJ per year, equivalent in energy to about 18 million barrels of oil.
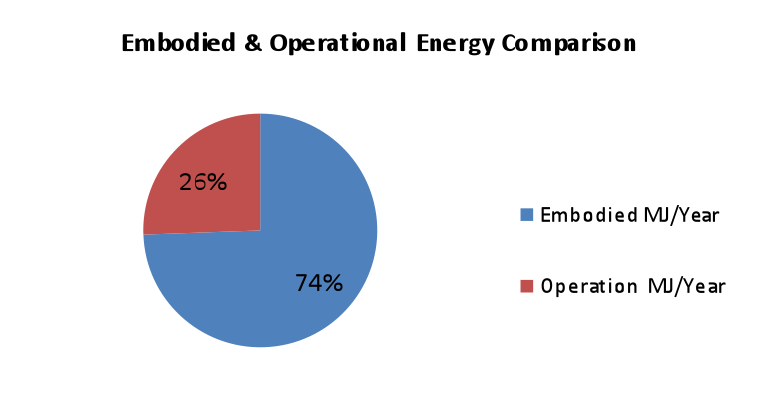
Of that amount, however, nearly three-quarters is energy that is embodied in the infrastructure and in the consumption of goods and services in the city (Figure 2), while only 26% is operational energy (current consumption)—the energy used to light, cool, heat, run equipment such as water pumps and televisions, and to run vehicles.
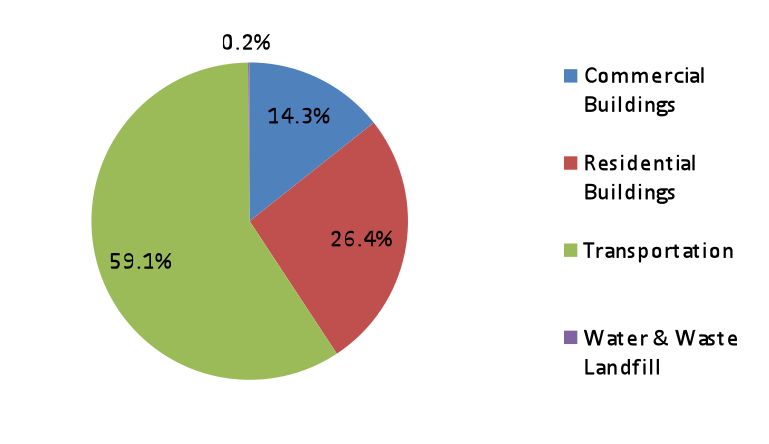
Not unsurprisingly, nearly 60% of the operational energy comes from transportation, with another 26% from the energy used in residential buildings, including heating, cooling, water heating, lighting, appliances, and miscellaneous plug loads (Figure 3). Suzhou is located in an area of China that did not formerly allow heating in buildings in winter, so heating today is supplied largely by mini-split heat pump air conditioners running on electricity. In Suzhou, nearly every household, urban and agricultural, owns a refrigerator, TV, clothes washer, and AC. Commercial building account for a lower share than residential buildings because of China’s overall lower building energy intensity and the higher share of the agricultural and industrial workforce.
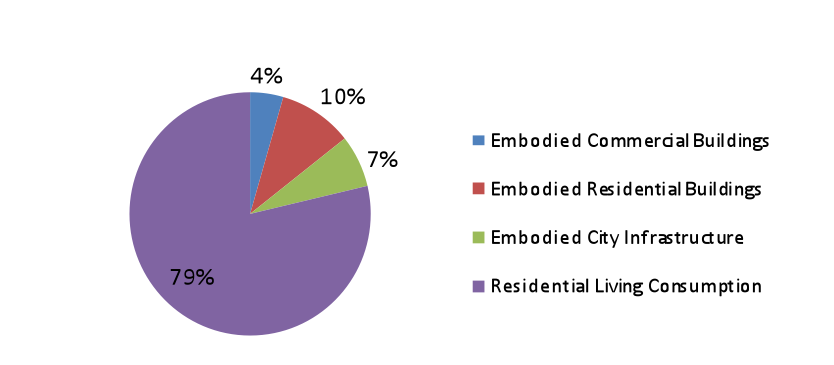
Even though commercial buildings are generally more materially intensive (i.e., use more concrete, steel, aluminum and other building materials per square meter) than residential buildings, the dominance of residential floorspace in the total building stock (54 million square meters vs 23 million square meters for commercial) results in a larger embodied energy footprint for residential buildings (Figure 4). Even then, the embodied energy of all buildings along with the 63 million square meters of pavement in the city accounts for only about 20% of the total annual embodied energy calculation; the rest is contributed from the embodied energy in the products and services that the residents of the city consume each year.
Transporting People
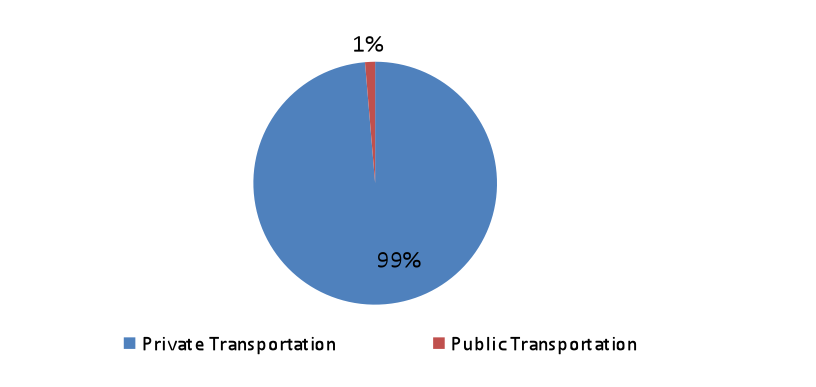
The transportation infrastructure in a city serves to supports the movement of vehicles carrying both passengers and freight (including non-commercial freight such as mail). Owing to a lack of data from which to estimate freight turnover and vehicle use in Suzhou, it has been omitted from this version; the results here focus on the impact of moving people. As shown in Figure 5, transportation energy use is completely dominated by private transportation choices, with the public transportation system contributing only about 1% of the total.
Suzhou has a car ownership rate of 29 per 100 households, so it is not surprising that among private transportation choices, car energy use accounts for over 70% of the total (Figure 6). Suzhou is also known as China’s “E-Bike Heaven” with over 2.5 million e-bikes in use, the highest density in China. Even so, the greater efficiency of this mode of passenger transport results in the entire fleet consuming just 2% of total passenger transport energy consumption.

What People Buy
As shown in Table 1, the energy used to heat, cool, light, and operate appliances in Suzhou households totals about 11 billion MJ, accounting for about a quarter of total operational energy use. Of much greater consequence is the contribution from the embodied energy of the goods and services that these households consume on an annual basis. To determine this, we looked at the distribution of expenditures by income level, and used input-output calculations based on China’s 2005 input-output tables to calculate the energy use for each expenditure category.

Note: ¥6.8 = US$1
What is apparent in Table 2 is that even at the highest income categories, food still accounts for the largest portion of household expenditures, in contrast to the US where food expenditures (as a share of disposable income) has steadily declined since 1947, reaching 9.5% in 2009. Consequently, food dominates the share of embodied energy as well (Figure 7), accounting for nearly half of the energy footprint of household consumption.

Clothing purchases, accounting for about 10% of monetary expenditures, translated into nearly a quarter of total embodied energy consumption, in part owing to the high proportion of coal-based electricity in China’s textile industry fuel mix.
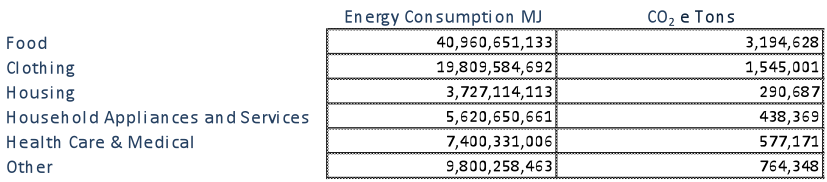
On a per-capita basis, however, the embodied energy of food remains fairly low in comparison to countries with advanced industrial agriculture such as the US or the EU. The embodied energy in the food supply totalled nearly 41 billion MJ, or about 18 MJ/person/day (Table 3). Assuming each person consumes about 9 MJ of food energy per day, this suggests that 2 MJ of energy were required to supply 1 MJ of food energy to each urban resident. In the US, the equivalent figure for input energy would be about 10 MJ.
Buildings for People to Work, Buy, Learn, Reside Temporarily, and Be Sick
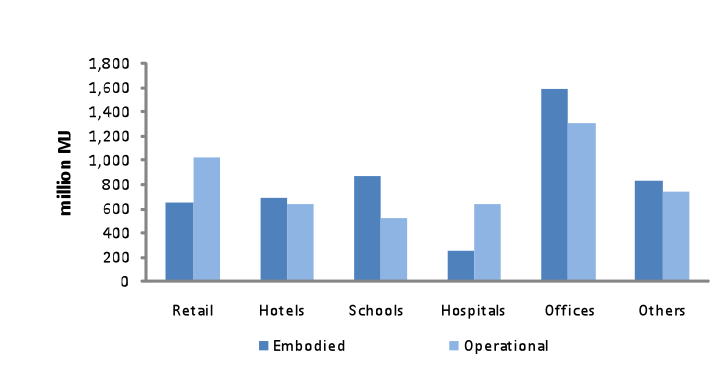
The commercial sector of a city provides accommodation for the variety of activities that its inhabitants do on a daily basis. In this model, the commercial sector is divided into six types of buildings: retail, hotels, schools, hospitals, office buildings, and other. Different building types employ different construction methods and materials, and thus the embodied energy of each type differs. Similarly, the nature of the activity in each building type differs, and thus the operational energy use of each type varies. For example, hospitals tend to be low-rise buildings with high demands for hot water; as seen in Figure 8, the operational energy of hospitals is more than twice that of the embodied component. Similarly, in retail buildings, the extensive use of lighting, air conditioning and heating also keeps operational energy high. Office buildings constitute many of the high-rise structures of the city, with more intensive use of materials and have high embodied energy intensities but have fewer hours of operations each week than other building types.
Implications
This approach to looking at the energy footprint of a city based on the impacts of the city’s inhabitants shows, in the case of Suzhou, that personal consumption of goods and services accounts for the largest (59%) contribution to energy footprint of the city, and this figure would likely remain above 50% even with inclusion of details omitted in this version of the model (mainly freight transport, water treatment, and embodied energy of vehicles). For a policy-maker, this suggests that supply-chain issues need to be considered, and of these supply chains, food appears to be dominant. Developing long-distance or international food supply chains as in the US would dramatically raise the energy demand of each resident and further decrease the food energy return on investment to less than the 0.5 it is today. It also makes apparent the impact of increasing wealth as rising household income is translated into higher consumption. In addition, this approach highlights the impact of building lifetime: design and code requirements that would raise the lifetime of buildings from the current 30 years to a US average of about 75 years (or a UK average of over 100 years) would further decrease the contribution of the embodied energy in buildings to even a lower proportion than found here. Similarly, it suggests that “green buildings” with low or net-zero operational energy may not be “green” at all if the embodied energy of the materials used in the building are considered in the calculation. This exercise also adds a different perspective to the impact of such popular programs such as encouraging CFL use or buying more fuel efficient cars: though important in their own right as a matter of waste reduction, the contribution to changing the overall energy picture is quite small.