
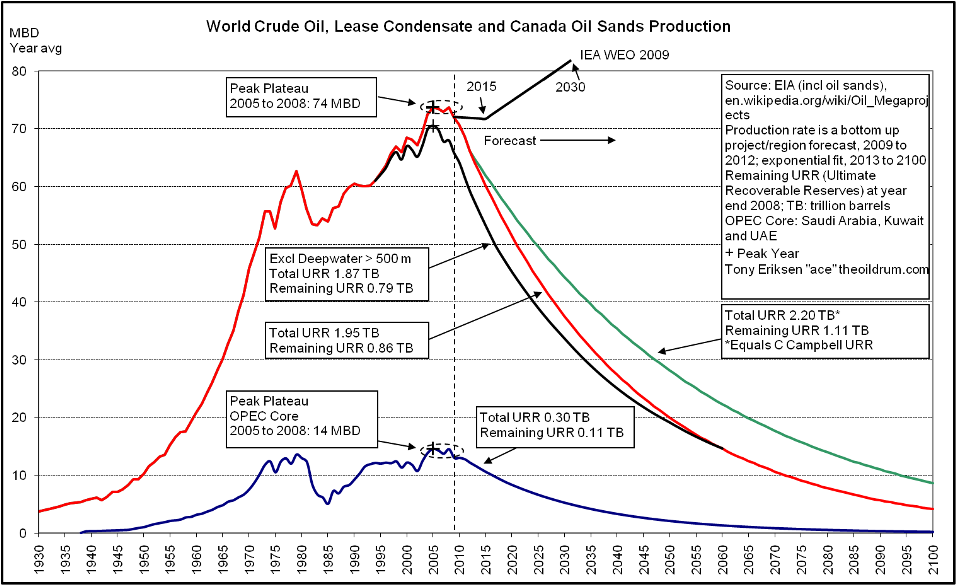
World oil production peaked in July 2008 at 74.74 million barrels/day (mbd) and now has fallen to about 72 mbd. It is expected that oil production will decline at about 2.2 mbd per year as shown below in the chart. The forecasts from the IEA WEO 2008 and 2009 are shown for comparison. The IEA 2009 forecast has dropped significantly lower than the 2008 forecast. The IEA 2009 forecast also shows a slight decline from 2009 to 2012 implying that the IEA possibly agrees that world oil peaked in July 2008.
The US Energy Information Administration (EIA) and the International Energy Agency (IEA) should make official statements about declining world oil production now to urgently increase the focus on oil conservation and alternative renewable energy sources.

World Oil Production
World crude oil, condensate and oil sands production peaked in 2005 at an annual average of 73.72 million barrels per day (mbd) according to recent EIA production data. 2008 production was slightly less than 2005 creating a peak plateau from 2005 to 2008 as shown in the chart below. Production is expected to decline further as non OPEC annual oil production peaked in 2004 and is forecast to decline at a faster rate in 2010 and beyond due mainly to big declines from Russia, Norway, the UK and Mexico. Saudi Arabia’s crude oil production peaked in 2005. By 2011, OPEC will not have the ability to offset cumulative non OPEC declines and world oil production is forecast to stay below its 2005 peak.
My forecast to 2012 is based on an aggregation of individual forecasts from over 80 countries including over 300 major oil projects. My estimate of 1.95 trillion barrels (TB) of total Ultimate Recoverable Reserves (URR) of oil is used to generate the forecast beyond 2012 as shown by the red line below. If Colin Campbell’s estimate of 2.20 TB is used, which is 250 billion barrels (Gb) greater than my estimate due mainly to more optimistic assumptions about OPEC reserves, the peak production date remains at 2005. This shows that an additional 250 Gb of recoverable oil reserves does not change the peak oil date and instead increased production rates occur later as indicated by the green line below. Additional reserves and the related production from prospective areas such as the arctic, Iraq, and Brazil’s Santos basin are highly unlikely to produce another peak but should decrease the production decline rate after 2012.
The IEA WEO 2009 forecast is also shown on the chart below and an abrupt change in production occurs after 2015. The reason for this change is due to the IEA using one forecasting methodology up to 2015 and a different methodology after 2015. The IEA explains their two different methodologies on pages 39 and 40 from the IEA World Energy Model (WEM). The IEA’s forecast to 2015 is based on over 570 sanctioned and planned projects, each with capacity greater than 5 thousand barrels per day. The IEA needs to explain this sudden change in production after 2015.
The IEA’s forecast from 2015 to 2030 is not based on projects but based on the assumption that there are enough remaining oil resources coupled with enough investment to cause oil production to suddenly increase after 2015 to meet the IEA’s oil demand forecast. The IEA projects that much of the sudden production increase after 2015 comes from OPEC countries most of which are referred to as closed countries by the IEA. The IEA WEM page 40 states the following in reference to OPEC closed countries: "Long-term exploration and production investments of closed countries are projected based on expert judgement supported by the analysis of the consistency of official targets with the potential from past discoveries, estimated yet-to-be-discovered reserves and enhanced oil recovery projects." The IEA also continues to accept, without any questions, the oil resource estimates by the US Geological Survey oil assessment in 2000 (USGS 2000) as shown in Fig 10 on page 26 of the IEA WEM.
OPEC is consistent with the IEA in its use of forecasting methodology for long term projection to 2030. OPEC also forecasts oil demand first and also relies on USGS 2000 resource estimates to project an oil supply increase which meets demand. The paragraph below is from page 24 of the OPEC World Oil Outlook 2007 and is OPEC’s attempt to assure the world that there are sufficient resources to meet future demand.
A central tenet of the OPEC long-term supply perspective assessment is that resources are sufficient to meet future demand. The resource base, as defined by estimates from the US Geological Survey (USGS) of ultimately recoverable reserves (URR), does not constitute a constraint to supplying the rising levels of oil demanded in the reference case. Indeed, the methodologies developed and applied to derive the regional crude supply figures revolve around the assessment of remaining resources (resources minus cumulative production), so supply projections are, by definition, plausible from the resource perspective. Moreover, it is worth noting that these URR estimates have practically doubled since the early 1980s, from just 1,700 billion barrels to over 3,300 billion barrels, and it is probable that this upward revision process will continue. It should be noted that cumulative production during this period was less than one-third of this increase. In addition, these figures do not take into account the large resources of nonconventional oil.
Both the IEA and OPEC first forecast long term oil demand to 2030. Next, both agencies assume that there are sufficient oil resources to meet demand as substantiated by the USGS 2000 oil assessment. Oil extraction has become technologically more challenging and more expensive as much of the easy oil has already been produced. There is a strong likelihood that oil resources and investment will both be insufficient to increase production above the 2005 peak. However, both IEA and OPEC will probably say that falling investment caused falling oil production.
Non OPEC Oil Production
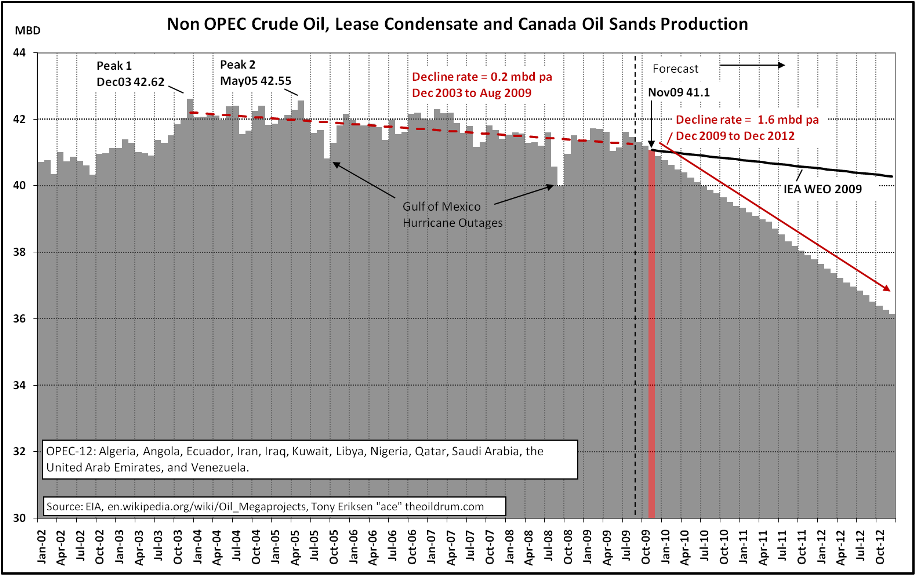
Non OPEC crude oil, condensate and oil sands production peaked in December 2003 at 42.62 mbd according to recent EIA production data. Production is expected to decline further at a rate of 1.6 mbd per year from now to December 2012. This decline is due mainly to big declines from Russia, the North Sea and Mexico.
The IEA WEO 2009 forecast is shown on the chart and projects a decreasing production rate which is roughly equal to an extrapolation of the downward trend from December 2003 to now, as shown by the dashed red line. This implies that the IEA has admitted that non OPEC oil production peaked in December 2003.
World Oil and Natural Gas Liquids Production
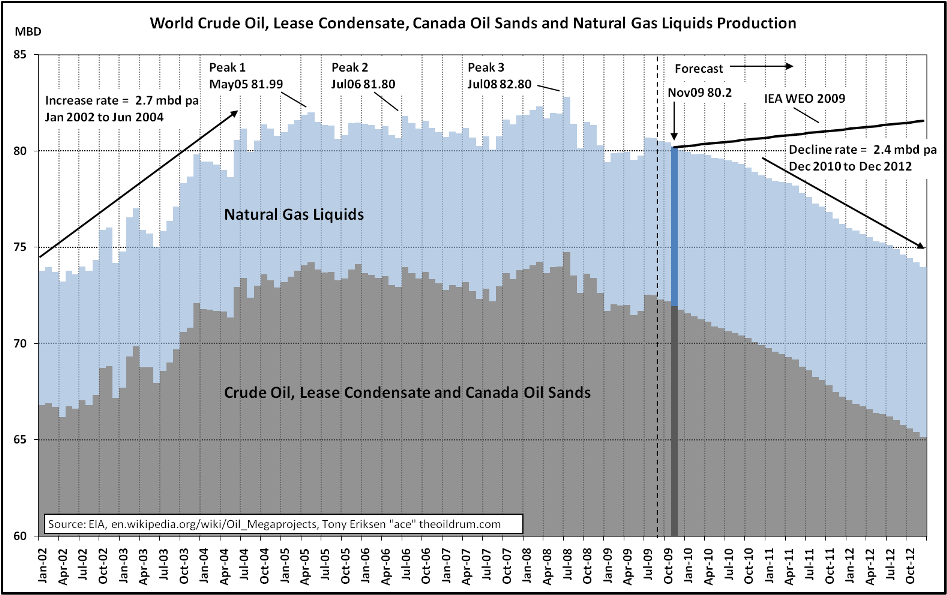
World crude oil, condensate, oil sands and natural gas liquids production peaked in July 2008 at 82.80 mbd according to recent EIA production data. Production is expected to decline further at a rate of 2.4 mbd per year from December 2010 to December 2012.
The IEA WEO 2009 forecast is shown on the chart and projects an increase due mainly to optimistic assumptions about OPEC production rates. The IEA also assumes annual increases of 0.44 mbd from new natural gas liquids capacity additions and 0.13 mbd annual increments from Canada oil sands. In a stark contrast, Colin Campbell assumes only 0.07 mbd annual increases from natural gas liquids.
World Liquids Production, Demand and Price
The definition of oil used by the International Energy Agency (IEA) also includes natural gas liquids (NGL), bio-fuels, processing gains and other liquids derived from natural gas and coal. OPEC NGLs were supposed to cause a significant net increase in world NGLs in 2009 but this has not happened yet as NGL production is struggling to exceed 8 mbd. According to the EIA NGL data, 2007 production was 7.96 mbd, 2008 was 7.91 mbd and 2009 year to date remains just below 8 mbd at 7.99 mbd. Although bio-fuels production has been growing exponentially, world liquids production has probably passed peak in July 2008 at 87.9 mbd as shown below. In 2008, US ethanol production was 0.6 mbd, Brazilian ethanol production was 0.4 mbd, and bio-fuels production outside the US and Brazil was 0.5 mbd.
The IEA WEO 2009 supply projection is approximately equal to the forecast demand in the chart below. The IEA’s forecasting model first calculates the future demand and assumes that oil resources are not a constraint. Second, the capital investment is assumed to be large enough to ensure that these oil resources can be converted into production fast enough to meet demand. Consequently, the IEA supply forecast is roughly equal to the demand forecast.
The average oil price should stay above $US 75/barrel for the remainder of the year as average demand is forecast to be only slightly greater than supply to December 2009. If world demand unexpectedly weakens then prices might fall below $US 75. Furthermore, OPEC is unlikely to cut supply at its December meeting which reduces the upward pressure on oil prices. Some recent evidence of increased demand is shown by US crude oil stocks dropping from a recent peak of 26.2 days at the end of April down to 24.1 days in mid November. However, oil prices could exceed $100 in early 2010 as world liquids production may fall below forecast demand.

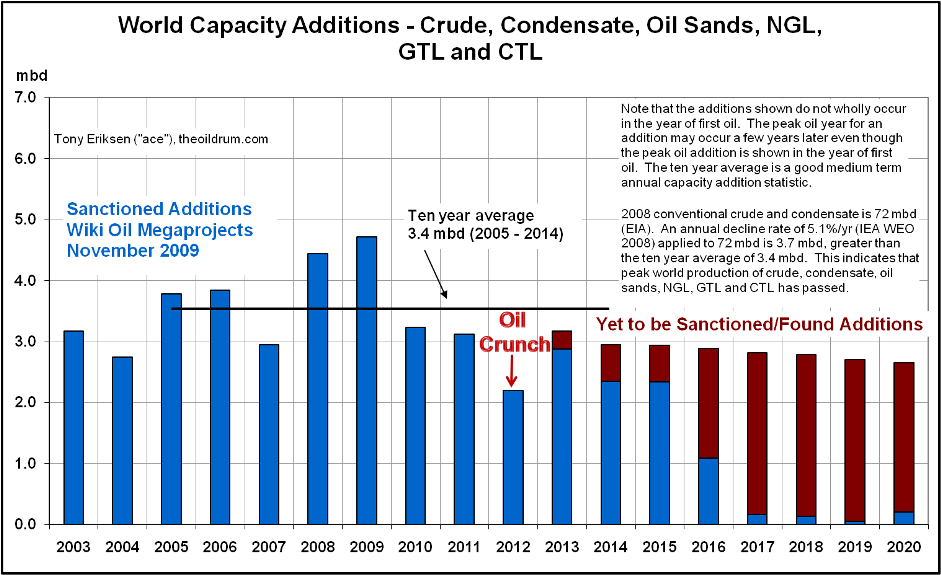
High volatility of future oil prices is also expected due partly to delays in project investment causing future annual oil capacity additions to decline sharply to 2012. This declining trend in capacity additions is shown in the chart below which is derived from this oil megaproject database. About 3.7 mbd of annual capacity additions are needed just to offset declines from existing fields. Annual capacity additions from 2010 are forecast to be less than 3.7 mbd implying that world production of crude, condensate, oil sands, NGL, GTL and CTL will continue declining. The chart below shows capacity additions from new projects and not production additions. Allowing for maintenance, unplanned outages and other incidents, future production additions may be about 15% less than capacity additions. This means that the production additions for 2010 to 2012 could be less than 3 mbd, well short of the required 3.7 mbd to offset declines from existing fields.
Many large capacity additions started in 2009 including over 1 mbd from Saudi Arabia, over 0.4 mbd from Brazil, over 0.5 mbd from Russia and almost 0.3 mbd from USA. Key producer Saudi Arabia has no more capacity additions until Manifa’s 0.9 mbd scheduled to start in 2013, at the earliest. Capacity additions from Brazil, Russia and USA decline from 2009 to 2010. World capacity additions drop further in 2011 and decrease again in 2012. Consequently, an oil supply crunch is likely to occur in 2012 as shown below. The capacity additions do not include bio-fuel additions but these additions are unlikely to ease the 2012 oil crunch.

Additional Information Sources
World Oil Production Forecast – Update May 2009
World Oil Production Peaked in 2008, March 17, 2009
Saudi Arabia’s Crude Oil Production Peaked in 2005, March 3, 2009
Non OPEC-12 Oil Production Peaked in 2004, February 23, 2009
USA Gulf of Mexico Oil Production Forecast Update, February 9, 2009


