Nearly all of the economic analyses we see today have as their basic premise a view that the current financial crisis is a temporary aberration. We will have a V or U shaped recovery, especially if enough stimulus is applied, and the economy will soon be back to Business as Usual.
I believe this assumption is basically incorrect. The current financial crisis is a direct result of peak oil. There may be oscillations in the economic situation, but generally, we can’t expect things to get much better. In fact, there is a very distinct possibility that things may get very much worse in the next few years.
In this post, I will put together some of the pieces I see. This post is based on a presentation, so includes more than the usual amount of graphics. The post repeats many things I have said before, but I wanted to bring more of the pieces together into more of an overview article. This is a link to a PDF version of the presentation. This is a link to the Powerpoint version.
Our One-Way Economy
Our economy is very much a one way economy–because of its heavy reliance on debt, it needs to grow.
It is easy to overlook the importance of debt. Most businesses would not be able to build new factories without debt. Businesses would tend to be much smaller than they are today without debt. International trade would be much more difficult without debt. Even at a personal level, debt is very important. How many citizens would be able to purchase homes without a mortgage, or go to college without a student loan?
In order for our debt-based system to work as planned, the economy needs to grow. Otherwise, there are way too many defaults.
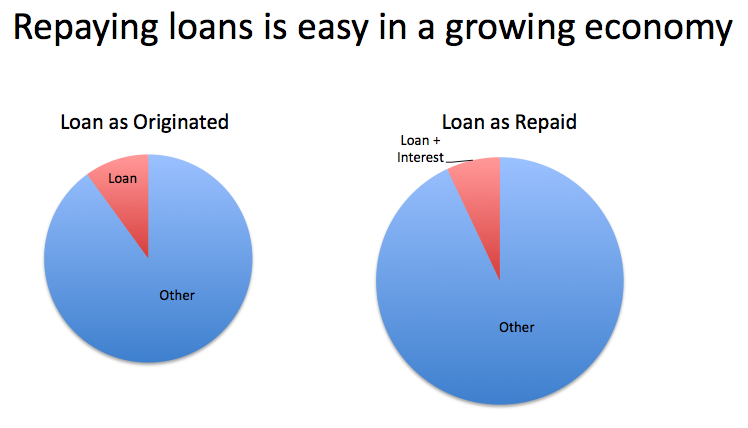
In a growing economy, many debtors find that their financial situation has improved by the time it becomes necessary to pay back the loan. Even though it is necessary to pay back the loan plus interest, the debtor still has plenty of funds left over for other things, because of the growth of the economy, and his or her improved circumstances.

The reverse is true in a shrinking economy. When the time comes to repay the loan, many debtors find that they have been laid off or their incomes have declined. Repaying the debt becomes much more difficult. Default rates rise. Those who do repay debt often find they do not have funds left for all of their other obligations.
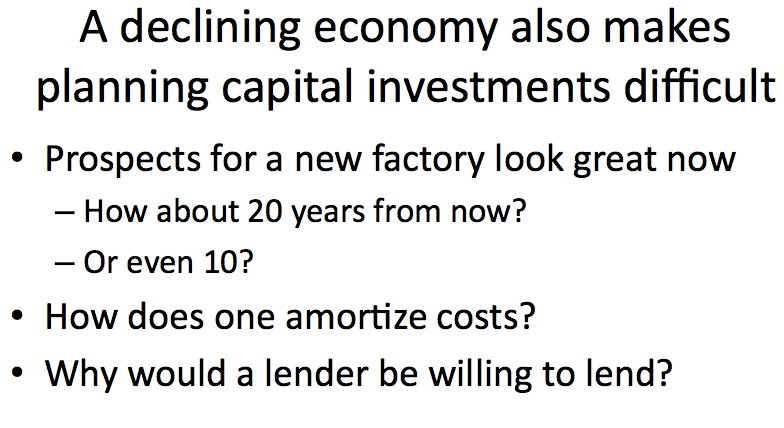
For a business, a declining economy makes capital planning difficult, because one doesn’t know whether there will be sufficient demand for a product, or sufficient raw materials for the product, for the full lifetime of capital equipment that is being purchased. One would like to think that a new factory, or a new machine, will be usable for its planned lifetime, say 40 years. But in a declining economy, it is just as likely that some necessary element will be missing, 10 or 20 years from now.
In this environment, how does one amortize costs? Why would a lender be willing to make a long-term loan?
There is an academic paper called This Time is Different: A Panoramic View of Eight Centuries of Financial Crises. The paper finds that throughout history, government defaults on debt have occurred very frequently. The paper notes (page 15):
It is notable that the non-defaulters, by and large, are all hugely successful growth stories.
This is precisely the effect we would expect. When economies of countries are able to grow rapidy, they can repay their debt with interest. But as growth wanes, it becomes much more difficult to repay debt, and many more defaults occur.

Our debt-based financial system needs growth to continue. It is not a Ponzi scheme, but it has the same problem with not being sustainable without growth. The inability of the financial system to continue without growth becomes a separate risk factor to the economy, greatly magnifying the effect of even a slight long-term slowdown. The need for growth is the reason why Bernanke and Geithner are working so hard to get the economy to grow again.
The Energy Stumbling Block
If all of the raw materials we need continue to grow rapidly, then there is a chance the growth paradigm can continue. But increasingly, this is not the case. A major stumbling block is cheap energy:
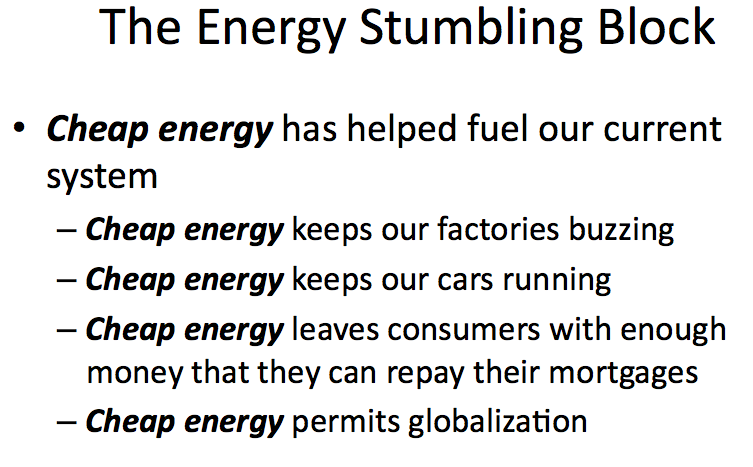
Cheap energy keeps our cars and factories running. It leaves homeowners with money to repay their mortgages, and permits the long-distance transfer of goods needed for globalization.
We live in a finite world. Cheap energy can’t go on forever. Eventually it runs out, and we have to move on to expensive energy. This is precisely what has been happening, for both oil and natural gas.

The OECD can be thought of as the organization of oil consuming nations. It includes the United States, Canada, Europe, Japan, and Australia. On this graph, Rune Likvern has plotted:
• The amount of oil consumed by the OECD
• The price of oil
What we see on this graph is that the oil consumed by OECD reached a peak in 2005, and has started to decline since then. Prices started to rise about the same time the amount of oil OECD was able to purchase began to decline.
What was happening at this time was that world oil production reached a plateau, about 2005. There were more and more bidders for what oil was available, and prices started to rise. OECD wanted more and more oil, but the oil producing nations also wanted more oil, and developing nations like China and India also wanted more oil. In response to all of this demand, the price of oil went up and up, but total world supply barely budged, and the amount of oil that OECD was able to buy started to drop.
The first pains of the higher prices started being felt in 2006, and rose in a crescendo until a major breaking point was hit in July 2008. In that month, the highest world oil production of all time and the highest price of all time both occurred, followed by a major break in the financial markets. Let’s go back first to 2006.
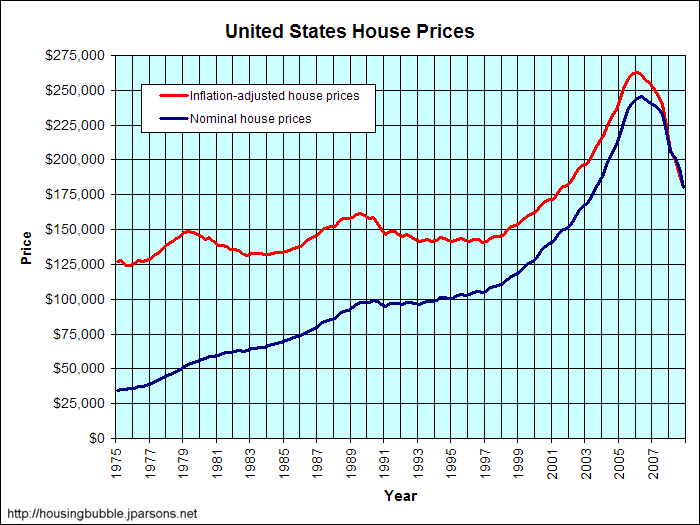
Even prior to 2006, mortgage payments were a very vulnerable portion of the economy. Families had been encouraged to take on large amounts of debt, and the increased demand for homes had sent housing prices upward.
Once prices of oil started to rise, the higher gasoline and diesel prices helped push a system which was inherently unsustainable over. By 2006, families had become less able to maintain high mortgages, and home prices started to decline. This started the decline in home prices that we are seeing today. One can see from the graph that home prices in 2009 are still very high by historical standards, so this process is likely not yet over. If people are out of work and too many houses have been built, the ultimate level of home prices may even drop below historical norms.
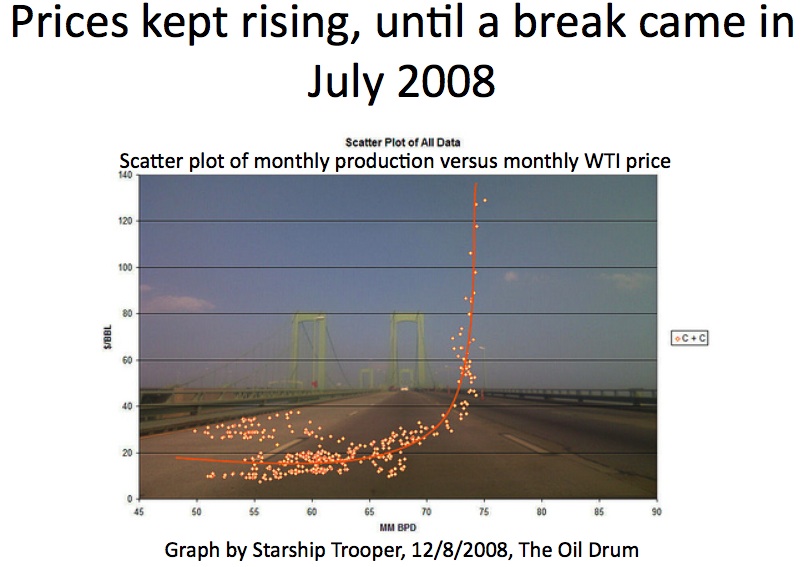
This graph is a scatter diagram which plots the quantity of oil produced in a month and the price of oil in that month over a several year period. As the price of oil went up, the quantity of oil produced went up–but not by very much. The price finally hit the high point on the graph of $147 a barrel in July 2008, in the same month world oil production hit its maximum point.
At this point, a break occurred. Commercial credit started becoming much less available, which reduced demand. With the reduced demand caused by the lack of credit, prices dropped very quickly from $147 barrel to a low of $31 barrel in December 2008. The financial crisis as we know it had started.
This financial crisis is precisely what many of us had forecast would be the outcome of peak oil, because resources need to be level to increasing in order for the economy to keep growing. (One can disguise the lack of growth for a time by expanding credit, and Greenspan used precisely that approach in the early 2000s.) Once available resources start declining, growth begins to decline, debt defaults start rising, and soon after that, credit availability starts to decline. We can summarize what happens in the following chart:
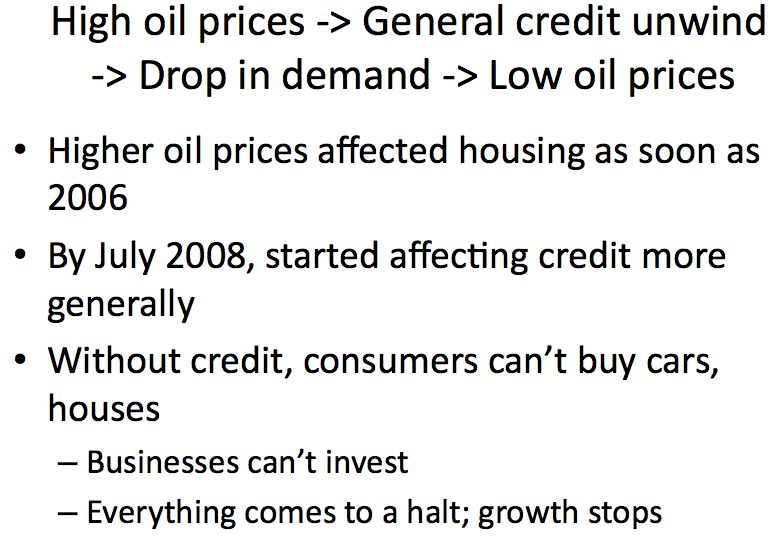
All of these problems lead us to the current financial crisis, caused by trying to continually expand our economy in a finite world. Lack of low-priced oil was a major limiting factor. Even if we had managed to get past the need for low-priced oil, there were other limits as well that we were reaching, like fresh water and cheap natural gas. I won’t be able to talk much about these today, but these limits would also tend to have the same impact on a financial system that requires growth–cause massive debt unwind, and possible collapse of the system.
The Underlying Problem of Peak Oil
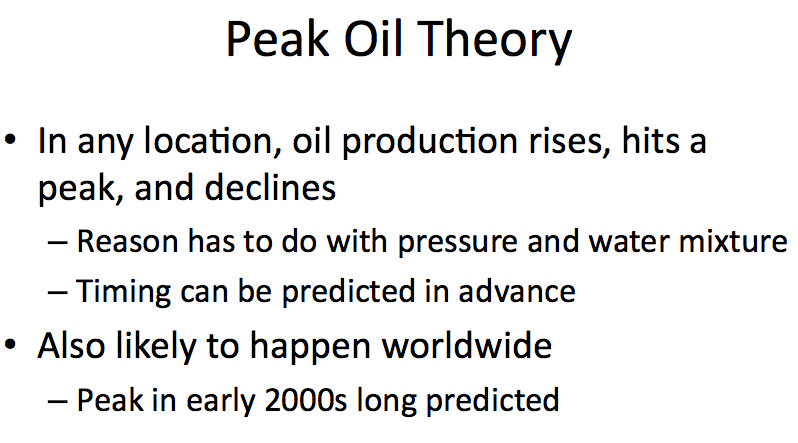
Nearly all readers of this site are familiar with Peak Oil Theory.
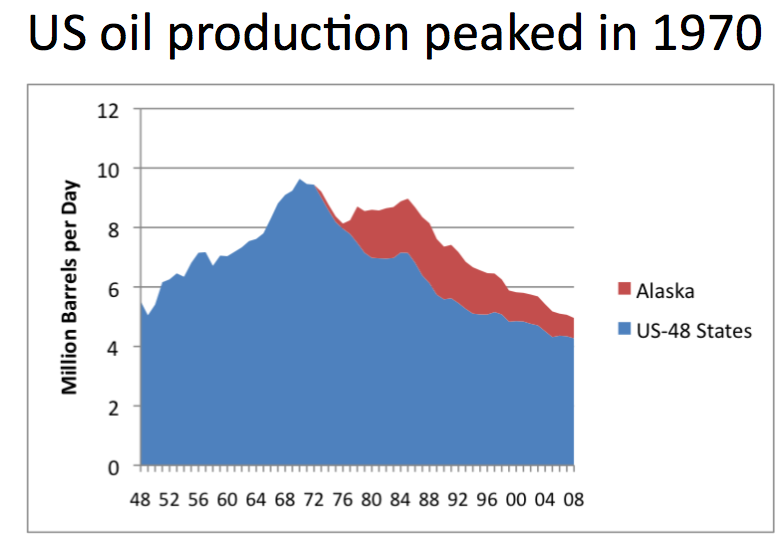
US oil production reached its peak in 1970. M. King Hubbert had long predicted a peak in US oil production about that time, but few believed him. At the time of the peak, the US was producing oil only in the 48 states. When the need for more production became clear, we were able to bring Alaska production on, after building a pipeline.

We were also able to ramp up oil production in the North Sea and in Mexico, soon after US oil production started to decline. These sources are now beginning to decline as well. One can see from these graphs that the shape of production curves varies depending on location. It is not always symmetric.
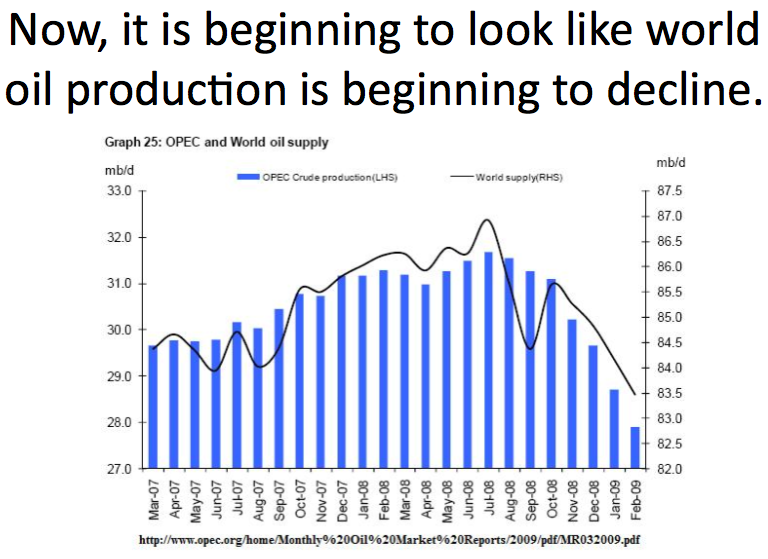
This is a graph from a recent OPEC publication. The graph is a bit confusing, because it shows two things on it–OPEC oil production, using the scale on the left hand side, and world oil production, using the scale on the right hand side.
Once prices dropped from the high levels obtained in July 2008, companies suddenly became a great deal less interested in producing oil. New projects were put off, because the available price of oil dropped below the cost most companies needed to bring on new production. The graph indicates that production fall immediately after the drop in price.
(Note: Companies by and large didn’t “shut in” existing production, because much of the cost for existing production had already been incurred, and the marginal cost for maintaining production was quite low. The continuing production from these older wells is the reason that we are temporarily able to buy oil cheaply now, even though we can’t expect this long term. Production from these older wells declines each year, and must be made up for by new wells, if production is to even remain flat.)
(Note: The drop in world oil production in September 2008 was the result of two hurricanes in the US Gulf of Mexico.)
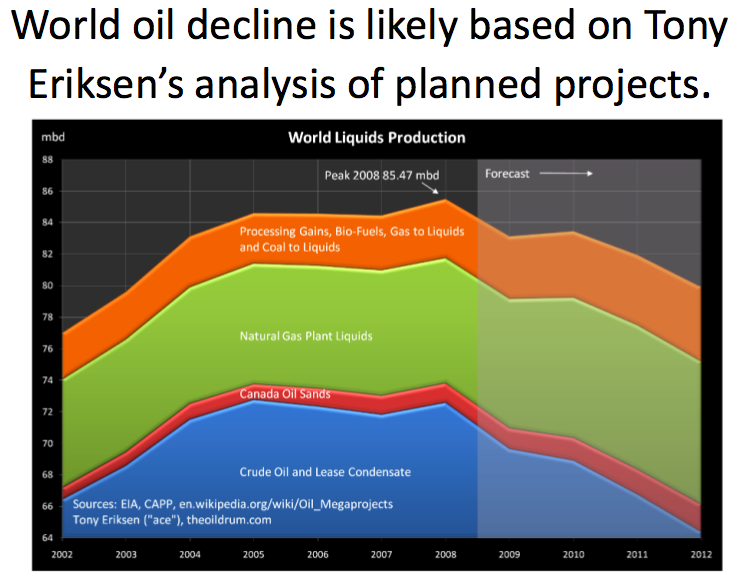
Tony Eriksen (“ace”) made this forecast of oil production based on an analysis of likely future production for individual large fields, from this database. Prior to the drop in price, it looked like world oil production would continue on a plateau for a while longer, or possibly even increase a bit. Once companies understood the drop in price, they started deferring production plans until prices were better. But existing fields continue to decline due to depletion. The result of the cutback in new production, and the decline due to depletion in existing fields, is the expected pattern of decline Tony shows in this graph.
Where is the Energy Sector Headed?
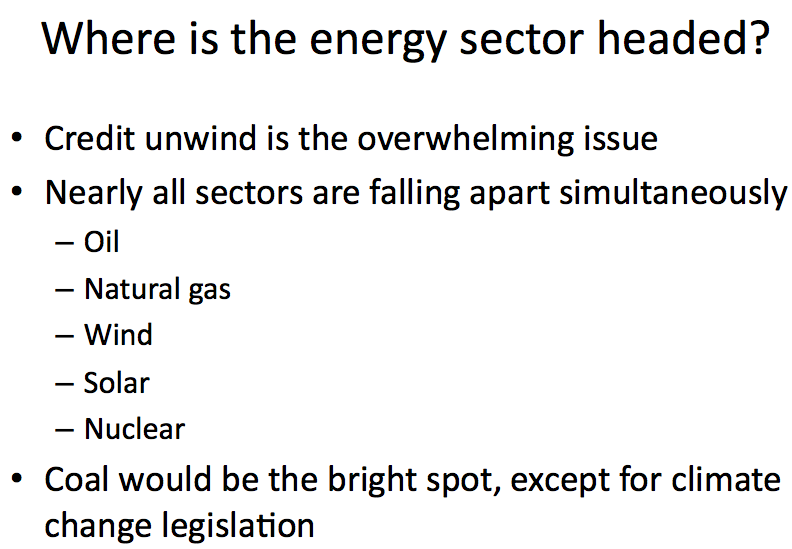
As I indicate on this slide, I see the major factor affecting the energy sector to be the credit unwind. Pretty much all sectors are affected, because the collapse of the credit market affects the entire economy.

The problems of the credit unwind are pervasive. There are both the direct problems of not having credit, and the indirect problems of low prices and low funds available for investment. The result of this is that net investment drops considerably.
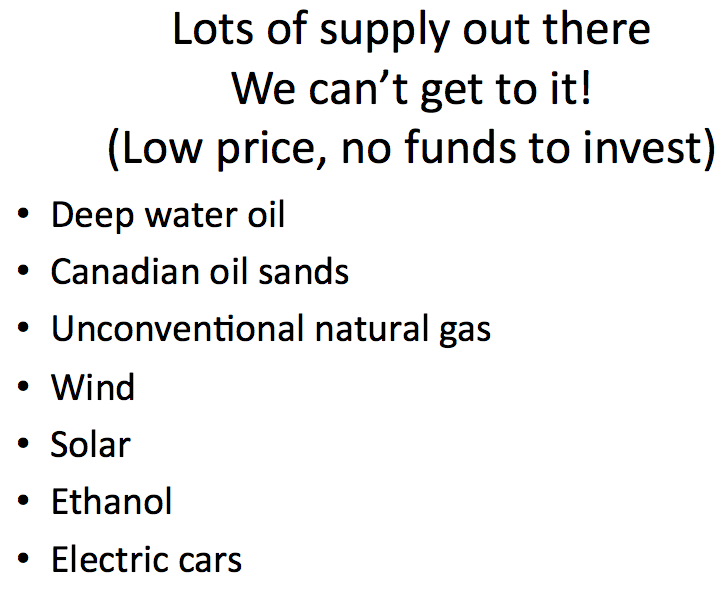
There seems to be lots of supply out there, but there isn’t a good way to get to it.
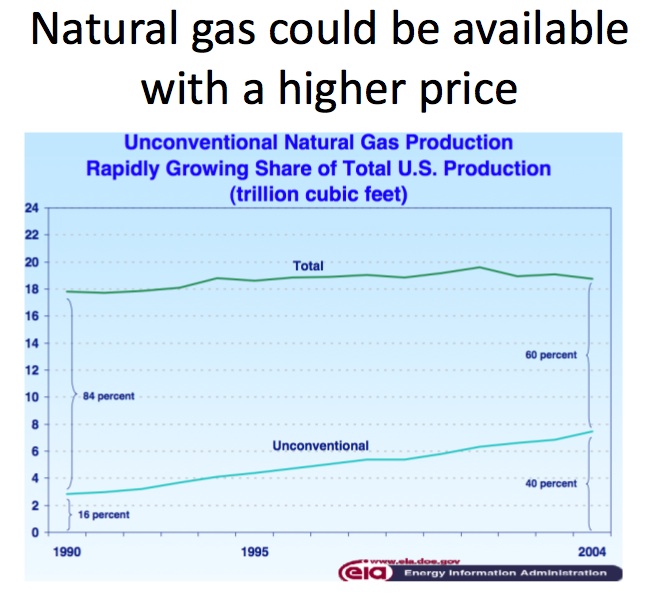
The situation with natural gas isn’t too much different from that with oil. Conventional natural gas is the inexpensive natural gas. It has been declining in supply. Unconventional natural gas is generally quite a bit more expensive. At today’s prices, it doesn’t make much sense to drill new unconventional wells, because the costs exceed the likely price that will be available.
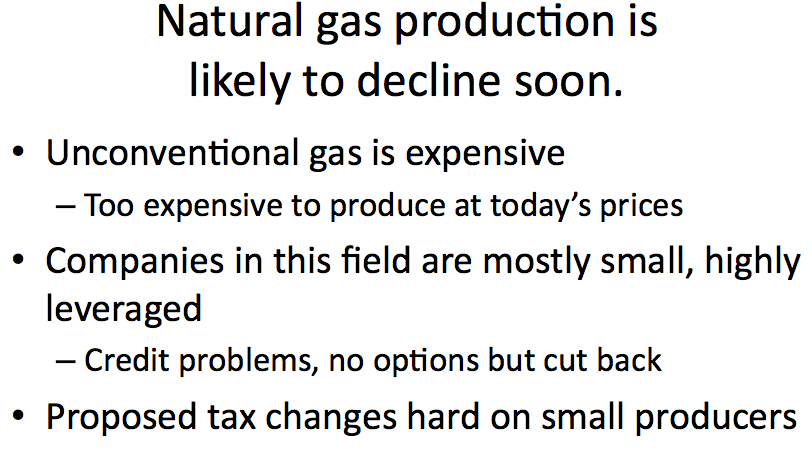
Most unconventional gas is too expensive to produce at today’s prices, so decline is likely in the next few years. Small companies are leaving the business, and not likely to come back, even if the price of gas goes up again.
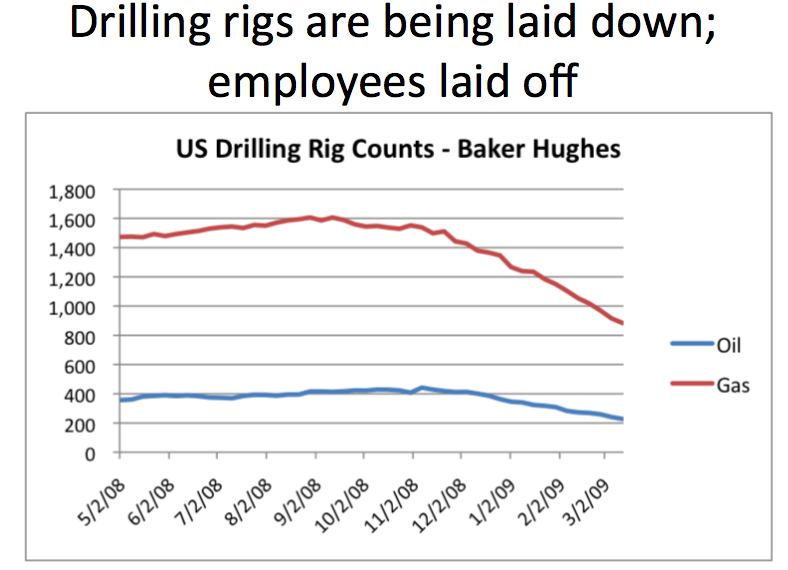
This graph shows the number of drilling rigs in operation in the US, both for oil and for natural gas. These drilling rigs are leased, so a company cannot easily stop drilling until its contract is up for renewal. Even with this limitation, the number of drilling rigs has dropped almost in half from the high point, for both oil and gas. The drop in drilling rigs doesn’t immediately affect production, but one can be certain it will affect production long-term. We are living in the calm before the storm.
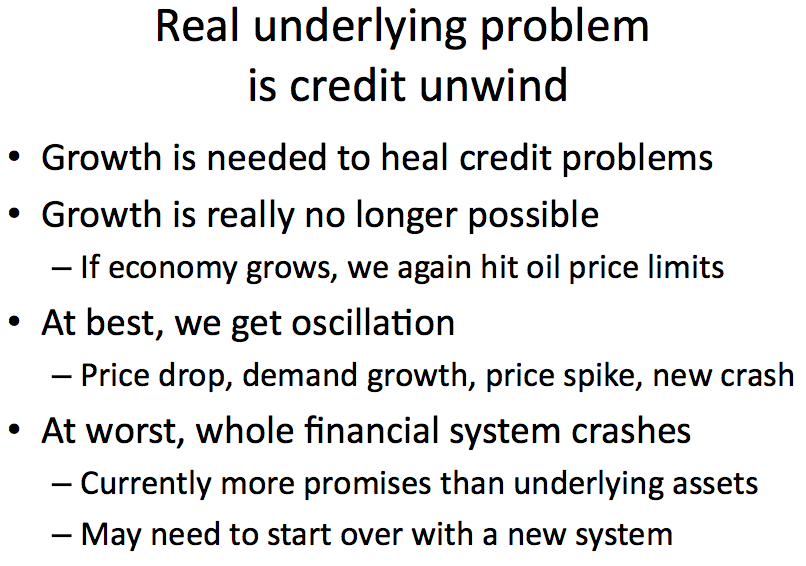
Lack of growth is causing the credit unwind. There is nothing Bernanke or Geithner or the G20 meetings can do to fix the lack of growth–it is closely related to the lack of cheap oil and cheap natural gas, now that these have been depleted.
Growth is not possible any more–at best, we will get oscillation. Prices will drop, as it has recently. Demand will start to pick up again. Prices will rise rapidly, until a new lower production limit is reached, and more defaults on debt will occur, starting the cycle over again.
There is a real possibility that the whole system may crash. The value of the dollar may drop, or countries may become afraid of international trade, for fear that trading partners will not be able to make good on their promises. It may be necessary to start over with a new financial system that does not permit much debt. (This would not be easy. Governments are often overthrown when currencies fail.)
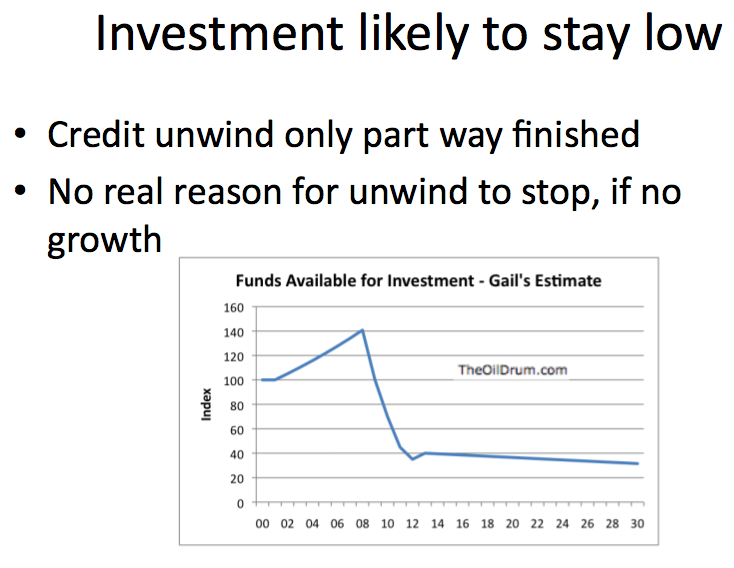
It seems to me that the amount of investment is likely to drop, even below the level it is today. The reason that investment is likely to drop is because the credit unwind is only part way finished. Without growth, the credit unwind can only continue. With low credit availability, prices will stay low. The amount of cash flow oil companies and other energy companies will have will stay low. With little opportunity for borrowing, there will not be very much income available for investment.
With little investment, even forecasts such as the one I showed by Tony Eriksen may prove to be optimistic. Instead of oil production declining slowly, it may decline much more quickly:

Such a drop in production might occur if there is a major financial crash. (See Where Is Oil Production Headed?: An Adverse Scenario.)
Long Term Prospects
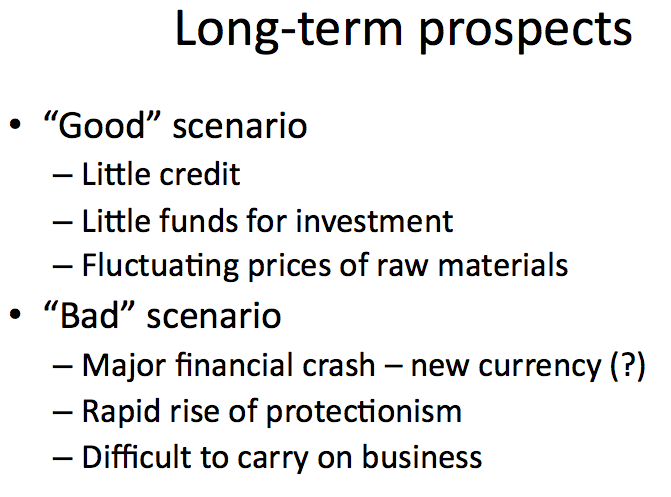
Even the good scenario is not very good. Oil, gas and other commodity prices may fluctuate, but there will be little credit and little funds for investment. The economy will be doing no better than today, and quite probably worse.
In the bad scenario, there will be a major financial crash, and the United States will somehow need to replace our currency (and the currency of other countries around the world) with a currency that is less tied to debt–perhaps a currency tied to natural resources of some kind. Countries may cease to trust each other, and there may be a rise in protectionism. If new currencies are not adopted immediately, it may be difficult to carry on business.
Planning for the future, we need to assume that credit will be much less available than it is today. Cash will be king. In planning, cash flow will be more important than discounted present value. Economic growth will be something remembered fondly from the past. The closest approximation will be a temporary upswing while the world is oscillating between shortages at high prices and low prices with little credit availability.
The world is likely to become more localized in all of this. Successful companies will emphasize long-term relationships with local customers.

For Further Reading
Our World Is Finite: Is This a Problem? April 2007
Peak Oil and the Financial Markets: A Forecast for 2008 January 2008
Where Is Oil Production Headed?: An Adverse Scenario March 2009