Cycling is the most sustainable form of transportation, but the bicycle is becoming increasingly damaging to the environment. The energy and material used for its production go up while its life expectancy decreases.
Cycling is sustainable, but how sustainable is the bicycle?
Cycling is one of the most sustainable modes of transportation. Increased ridership reduces fossil fuel consumption and pollution, saves space, and improves public health and safety. However, the bicycle itself has managed to elude environmental critique. [1] [2] Studies that calculate the environmental impact of cycling almost always compare it to driving, with predictable results: the bicycle is more sustainable than the car. Such research may encourage people to cycle more often but doesn’t encourage manufacturers to make their bicycles as sustainable as possible.
For this article, I have consulted academic studies that compare different types of bicycles against each other or focus on the manufacturing stage of a particular two-wheeler. That kind of research was virtually non-existent until three or four years ago. Using the available material, I compare different generations of bicycles. Set in a historical context, it becomes clear that the resource use of a bike’s production increases while its lifetime is becoming shorter. The result is a growing environmental footprint. That trend has a clear beginning. The bicycle evolved very slowly until the early 1980s and then suddenly underwent a fast succession of changes that continues up to this day.
There are no studies about bicycles built before the 1980s. Life cycle analyses, which investigate the resource use of a product from “cradle” to “grave,” only appeared in the 1990s. However, the benchmark for a sustainable bicycle stands in the room where I write this. It’s my 1980 Gazelle Champion road bike – now 43 years old. I bought it ten years ago in Barcelona from a tall German guy who was leaving the city. He had tears in his eyes when I walked away with it. I have a second road bike, a Mercier from 1978. That is my spare vehicle in case the other one breaks down and I don’t have the time for immediate repairs. I have two more road bikes parked in Belgium, where I grew up and where I still travel a few times a year (by train, not by bike). These are a Plume Vanqueur from the late 1960s and a Ventura from the 1970s.
The main reason why I have opted for old bicycles is that they are much better than new bicycles. Most people don’t realize that, so they are also much cheaper. My four bikes cost me just 500 euros in total. That would buy me only one low-cost new road bike, and such a vehicle surely won’t last 40 to 50 years – as we shall see. Of course, it’s not just old road bikes which are better. The same goes for other types of bicycles built before the 1980s. I ride road bicycles because I cover relatively long distances, usually between 35 and 50 km round trip.
Image: The bicycle I use most often, a Gazelle Champion from 1980. It has covered at least 30,000 km since I bought it in 2013.
What bicycles are made of
The first significant change in the bicycle manufacturing industry was the switch from steel to aluminium bicycles. Before the 1980s, virtually all bikes were made from steel. They had a steel frame, wheels, components and parts. Nowadays, most bicycle frames and wheels are built from aluminium. The same goes for many other bike parts. More recently, an increasing number of cycles have frames and wheels made from carbon fibre composites. Some bike frames are built from titanium or stainless steel. All of these materials are more energy intensive to produce than steel. Furthermore, while steel and aluminium can be recycled and repaired, composite fibres can only be downcycled and have poor repairability. [3]
Several studies have compared the energy and carbon costs of bicycle frames and other components made from these different materials – which all have different strength-to-weight ratios. That research has some limitations. Scientists use crude methods because they lack detailed energy data from bike manufacturing processes, and some studies come from manufacturers who pay researchers to review the sustainability of their products. Nevertheless, all put together, the results are pretty consistent. For the sake of brevity, I focus on emissions (CO2 = CO2-equivalents) and ignore other environmental impacts.
Reynolds, a British manufacturer known for its bicycle tubing, found that making a steel frame costs 17.5 kg CO2, while a titanium or stainless steel frame costs around 55 kg CO2 per frame – three times as much. [4] Starling Cycles, a rare producer of steel mountain bikes, concluded that a typical carbon frame uses 16 times more energy than a steel frame. [5] (That would be 280 kg CO2). An independent 2014 study – the first of its kind – calculated the footprint of an aluminum road bike frame with carbon fork from the “Specialized” brand and found the cost to be 2,380 kilowatt-hours of primary energy and over 250 kg of carbon – roughly 14 times that of a steel frame (without fork) as calculated by Reynolds. [2]
A bicycle is more than a frame alone. Life cycle analyses of entire bikes show that the carbon footprint of all the other components is at least as large as that of a steel frame. [6] Scientists have calculated the lifetime carbon emissions of a steel bike at 35 kg CO2, compared to 212 kg CO2 for an aluminum bicycle. [7] [8] The most detailed life cycle analysis sets the carbon footprint for an 18.4 kg aluminum bicycle at 200 kg CO2, including its spare parts, for a lifetime of 15,000 km. The main impact phase is the preparation of materials (74%; aluminum, stainless steel, rubber), followed by the maintenance phase (15.5% for 3.5 new sets of tires, six brake pads, one chain, and one cassette) and the assembly phase (4.96%). [9]
Where & how bicycles are made
My steel bicycles date from a time when most industrialized countries had long-established domestic bicycle industries serving their national market. [3] These industries collapsed in Europe and North America following neoliberal globalization in the late 1970s. China opened to foreign investment and quickly became the largest bicycle manufacturer in the world. During the last two decades, China has made two-thirds of the world’s bicycles (60-70 million of 110 million annually). Most of the rest come from other Asian countries. Europe is back to producing ten million bikes annually, but the US only manufactures 60,000 bicycles per year. [3]
Throughout the twentieth century, manufacturing bicycles required substantial inputs of human labor. [3] According to the Routledge Companion to Cycling, “wheels were spoked and trued manually; frames were built by hand; saddle making was laborious; headsets, gear clusters (blocks), brake cables and gears were physically bolted on.” Since the 2000s, automation has considerably reduced the need for human labor. The largest Chinese bike manufacturer, which builds one-fifth of the world’s bicycles, has 42 bicycle assembly lines making 55,000 bicycles a day – almost as much as the US in a year. [3]
The globalization and automation of the bicycle industry make bikes less sustainable. First, they introduce extra emissions for transportation (from raw materials, components, and bicycles) and for producing and operating robots and other machinery. Second, producing steel, aluminum, carbon fiber composites, and electricity is more energy and carbon-intensive in China and other bike-producing countries than in Europe and North America. [10] Most importantly, however, is that large-scale automated production represents sunk capital that needs to be working most of the time to spread overhead costs, driving overproduction. [3]
How long bicycles last
How much energy and other resources it takes to build a bicycle and to deliver it to a cyclist is just half the story. At least as importantly is how long the bike lasts. The shorter its lifetime, the more vehicles need to be produced over the lifetime of a cyclist, and the higher the resource use becomes.
For a long life expectancy, some parts of a bicycle need replacement. These are typically smaller parts such as shifters, chains, and brakes. [11] Until a few decades ago, component compatibility was a hallmark of bicycle manufacturing. [12] My bicycles are a perfect example of this. Most components – such as wheels, gear set, and brakes – are interchangeable between the different frames, even though every vehicle is from another brand and year of construction. Component compatibility allows for easy maintenance and repairability, thereby increasing the lifetime of a bicycle. Bike shops in even the smallest villages can repair all types of bicycles using a limited set of tools and spare parts. [12] Cyclists can do minor repairs at home.
Unfortunately, compatibility is hardly a feature of bicycle manufacturing anymore. Manufacturers have introduced an increasing number of proprietary parts and keep changing standards, resulting in compatibility issues even for older bicycles of the same brand. [1] [3] For example, if the shifter of a modern bike breaks after some years of use, a replacement part will probably no longer be available. You need to order a new set from a new generation, which will be incompatible with your front and rear derailleur – which you also need to replace. [12] For road bikes, the change from cassette bodies with ten sprockets (around 2010) to cassette bodies with eleven, twelve, and most recently thirteen sprockets have made many wheelsets obsolete, and the same goes for the rest of the drivetrain including shifters and chains. [12] [1]
Disc brakes, which are now on almost every new bicycle, all have different axle designs, meaning that every vehicle now requires proprietary spare parts. [1] Disc brakes also required new shifters, forks, framesets, cables, and wheels, making such bicycles incompatible with earlier designs. [12] The rise of proprietary parts makes it increasingly hard to keep a bike on the road through maintenance, reuse, and refurbishment. As the number of incompatible components grows, it becomes impossible for bike shops to have a complete stock of spare parts. [12] If a manufacturer goes bankrupt, proprietary spare parts will no longer be available.
Component incompatibility is accompanied by decreasing component quality. An example is the saddle, which hardly ever outlasts a frameset because it cracks at the bottom of the shell. [12] A little extra material would make it last forever – as proven by all saddles of my 40 to 50-year-old road bikes. Low quality affects some parts of expensive bicycles but is especially problematic for cheap bicycles made entirely of low-quality components. Cheap bicycles – bike mechanics refer to them as “built-to-fail bikes” or “bike-shaped objects” – often have plastic parts that break easily and cannot be replaced or upgraded. These vehicles typically last only a few months. [13, 14]
How bicycles are powered
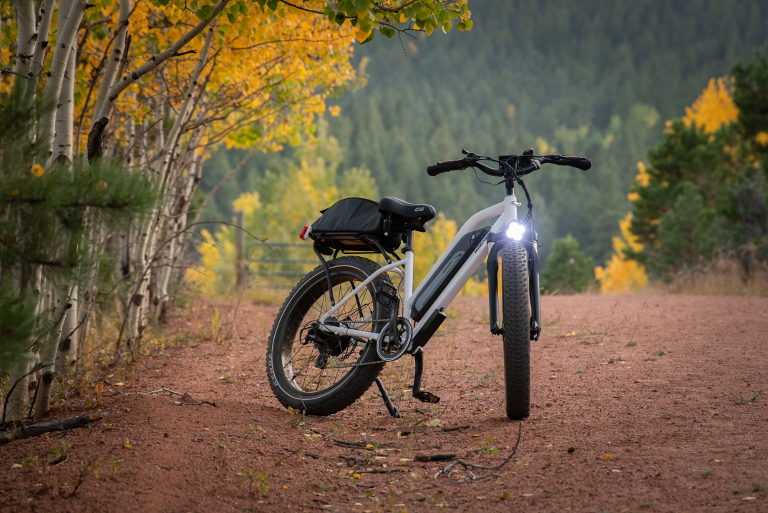
So far, we have only dealt with entirely human-powered bicycles, but bikes with electric motors are becoming increasingly popular. The number of e-bikes sold worldwide grew from 3.7 million in 2019 to 9.7 million in 2021 (10% of total bike sales and up to 40% in some countries like Germany). Electric bikes reinforce both trends that make bicycles less sustainable. On the one hand, electric motors and batteries require additional resources such as lithium, copper, and magnets, increasing the energy use and emissions of bike manufacturing. Researchers have calculated the greenhouse gas emissions caused by manufacturing an aluminum e-bike at 320 kg. [8] This compares to 212 kg for the production of an unassisted aluminum bicycle and 35 kg for an unassisted steel bicycle.
On the other hand, the life expectancy of an electric bicycle is shorter than that of an unassisted two-wheeler because it has more points of failure. The breakdown of the extra components – motor, battery, electronics – leads to a shorter lifecycle due to component incompatibility. An academic study on circularity in the bike manufacturing industry observes a significant increase in defective components compared to unassisted bicycles and concludes that “the great dynamics of the market due to regular innovations, product renewals, and the lack of spare parts for older models make the long-term use by customers much more difficult than for conventional bicycles.” [15]
On top of this, electric bicycles require electricity for their operation, further increasing resource use and emissions. This impact is small when compared to the manufacturing phase. After all, humans provide part of the power, and the electricity use of an electric bike (25 km/h) is only around 1 kilowatt-hour per 100 km. The average greenhouse gas emission intensity of electricity generation in Europe in 2019 was 275 gCO2/kWh. [16] If an e-bike lasts 15,000 km, charging the battery only adds 41 kg of CO2, compared to 320 kg for producing the (aluminum) bicycle. Even in the US and China, where the carbon intensity of the power grid is 50-100% higher than the European value, electric bicycle production dominates total emissions and energy use.
Cargo cycles
Combining energy-intensive materials, short lifetimes, and electric motor assistance can increase lifecycle emissions to surprising levels, especially for cargo cycles. These vehicles are larger and heavier than passenger bicycles and need more powerful motors and batteries. There are very few life cycle analyses of cargo cycles. However, a recent study calculated the lifecycle emissions of a carbon fiber electric cargo cycle to be 80 gCO2 per kilometer – only half those of an electric van (158 gCO2/km). [17] The researchers explain this by the difference in lifetime mileage – 34,000 km compared to 240,000 km for the van – and the carbon fiber composites in many components, including the chassis of the vehicle. The lifecycle emissions of the cargo cycle, including the electricity used to charge its battery, amount to 2,689 kg. That is almost 40 times the lifecycle emissions of two steel bicycles (each with a 15,000 km lifecycle mileage).
Extending the useful life of electric bicycles has less impact on lifecycle emissions when compared to unassisted bikes. That’s because the battery needs to be replaced every 3 to 4 years and the motor every ten years, which adds to the resource use of spare parts. [11] This is demonstrated by a life cycle analysis of an electric steel cargo cycle with an assumed life expectancy of 20 years. [18] During its lifetime, the vehicle uses five batteries (each weighing 8,5 kg), two motors, and 3.5 sets of tires. Most lifecycle emissions are caused by these spare parts, with the batteries alone accounting for 40% of the total emissions. In comparison, the emissions for the steel frame are almost insignificant. [18] This particular cargo cycle was built for African roads and is not entirely representative of the average cargo cycle, mainly because of its heavy tires.
Cargo cycles have another disadvantage. Passenger bicycles and cars usually carry only one person, meaning that one passenger kilometer on a bike roughly equals one passenger kilometer in an automobile. However, for cargo, the comparison of ton-kilometers is more complicated. If the load is relatively light – usually up to 150 kg – the electric cargo cycle will be less carbon-intensive than a van. However, heavier loads require several cargo cycles to replace one van, which multiplies the embodied emissions. [18] Switching to electric cargo cycles without significantly reducing the cargo volume is unlikely to save emissions. Obviously, cargo cycles with steel frames and without electric motors and batteries — for now still the majority — will have much lower carbon emissions over their lifetimes.
How bicycles are used
In recent years, many cities have introduced shared bicycle services. In theory, shared bicycles could lower the number of bikes produced and thus decrease the environmental impact of bicycle production. However, building and operating bike-sharing services adds significant energy use and emissions. Furthermore, shared bicycles don’t last as long as privately owned bicycles. Consequently, shared bike services further reinforce the trends that make bicycles less sustainable.
A 2021 study compares the environmental impact of shared and private bicycles while including the infrastructure that each option requires. It concludes that personal bikes are more sustainable than shared bicycles. [8] The research is based on the Vélib system in Paris, France, which has 19,000 vehicles, roughly half with an electric motor. Vehicle manufacturing and bike-sharing infrastructure cause more than 90% of emissions and energy use. The remaining emissions are due to the construction of cycle lanes (3.5%), the rebalancing of the bicycles to keep all stations optimally supplied (2%), and the electricity used for charging the batteries of the electric bikes (0.3%). Altogether, a shared bicycle from the Vélib system has an emissions rate of 32g CO2/km, which is three to ten times higher than the rate of a personal bike (between 3.5 gCO2/km for a steel bicycle and 10.5 g CO2/km for an aluminum bicycle. [8]
The scintists found that the bike-sharing service led to a 15% drop in bike ownership. However, they also calculated that the average lifespan of a shared bicycle is only 14.7 months, with an average lifetime mileage of 12,250 km. In comparison, the average lifetime of a personal bike in France, based on a 2020 survey, is around 20,000 km – almost 50% higher than for shared bicycles. The Vélib system includes 14,000 bike-sharing stations with a total surface of 92,000 m2 and an estimated lifetime of ten years. Each of the 46,500 docks consists of 23 kg steel and 0.5 kg plastic. The power consumption of each bike-sharing station is around 6,000 kWh per year. Due to the high impact of the infrastructure, the lifecycle emissions of shared electric bikes are only 24% higher than those of shared non-electric vehicles. [8]
The environmental footprint of bike-sharing systems can vary significantly between cities. A life cycle analysis of bike-sharing services in the US found carbon emissions of 65g CO2/km – twice as high as in Paris. [19] This is largely because the US systems rebalance the bicycles using diesel vans, while the French service employs electric tractors. The US study also looks at the newer generation of “dockless” bike-sharing services, which score even worse. Dockless shared bikes can be parked anywhere and located through a smartphone application. Although this removes the need for stations, each bicycle requires energy-intensive electronic components, and the system also generates emissions through communication networks. [19] [10] Furthermore, dockless systems require more bicycles and involve more rebalancing.
A life cycle analysis of Chinese bike-sharing services, many dockless systems, shows high damage rates and low maintenance rates for bicycles. The annual damage rate is 10-20% for reinforced bicycles and 20-40% for lighter vehicles which have become more common. In practice, a shared bicycle becomes scrap when the bike part with the worst durability breaks down. Repair is virtually not happening. [10] Finally, when the companies go bankrupt, bike sharing creates mountains of waste – including bicycles in good condition. [10] [1]
Image: Lifecycle carbon emissions per kilometre of riding a bicycle. Data sources: [8] [17] [19] [26] Graph: Marie Verdeil.
Not every bicycle replaces a car
None of this should discourage cycling. Even the most unsustainable bicycles are significantly less unsustainable than cars. The carbon footprint for manufacturing a gasoline or diesel-powered car is between 6 tonnes (Citroen C1) and 35 tonnes (Land Rover Discovery). [20] Consequently, building one small automobile such as the C1 produces as many emissions as making 171 steel bicycles or 28 aluminum bicycles. Furthermore, cars also have a high carbon footprint for fuel use, while bikes are entirely or partly human-powered. [21] Electric cars have higher emissions for production but lower emissions for operation (although that depends entirely on the carbon intensity of the power grid).
The bicycle even holds its advantage when its much shorter lifetime mileage is taken into account. [22] Gasoline and diesel-powered cars now reach more than 300,000 km, double their lifetime in the 1960s and 1970s. [23] If a bicycle lasts 20,000 km, it would take 15 bikes to cover 300,000 km. If those are steel bicycles without an electric motor, the total carbon footprint for manufacturing is still six times lower than for a small car: 1,050 kg of CO2. If the bikes are made from aluminum and have electric motors, then emissions grow to 4,800 kg CO2, still below the manufacturing carbon footprint of the small car.
However, not every bicycle replaces a car. That is especially relevant for shared and electric bikes: studies show that they mainly substitute for more sustainable transport alternatives such as walking, using an unassisted or private bicycle, or traveling on the subway. [19][24] In Paris, shared bikes have three times higher emissions than electric public transportation. [8] In addition, many carbon-intensive bicycles are bought for recreation and are not meant to replace cars at all – they may even involve more car use as cyclists drive out of town for a trip in nature. In all those cases, emissions go up, not down.
How to make bicycles sustainable again?
In conclusion, there are several reasons why bicycles have become less sustainable: the switch from steel to aluminum and other more energy-intensive materials, the scaling up of the bicycle manufacturing industry, increasing incompatibility and decreasing quality of components, the growing success of electric bicycles, and the use of shared bike services. Most of these are not problematic in themselves. Rather, it’s the combination of trends that leads to significant differences with bicycles from earlier generations.
For example, based on data mentioned earlier, manufacturing an electric bicycle made from steel would have a carbon footprint of 143 kg. Although that is four times the emissions from an unassisted steel bicycle, it is below the carbon footprint of an aluminum bicycle without an electric motor (212 kg). Especially if the battery is charged with renewable energy, riding an electric bike can thus be more sustainable than riding one without a motor. Likewise, an aluminum bicycle with a long life expectancy – for example, through component compatibility – could have a lower carbon footprint than a steel bicycle with a more limited lifespan.
Many researchers advocate switching back to producing bicycles from steel instead of aluminium and other energy-intensive materials. That would bring significant gains in sustainability for a relatively low cost – slightly heavier bicycles. Steel frames would also make electric and shared bikes less carbon intensive. Some researchers promote bamboo bike frames, but the benefit compared to old-fashioned steel or even aluminium frames is unclear. [27] A “bamboo bicycle” still requires wheels and many other parts made out of metal or carbon fibre composites, and the frame tubes are usually held together by carbon fibre or metal parts. [6] Furthermore, the bamboo is chemically treated against decay and becomes non-biodegradable. [1]
Better component compatibility would increase the life expectancy of bicycles – also electric ones – through repair and refurbishment. It would bring no disadvantages for consumers, even on the contrary. However, unlike a switch to steel frames, better component compatibility would hurt the sales of new bicycles. A study concludes that “the abandonment of standardization is a profitable business model because it ensures that bicycles can only be ridden for so long.” [1] The decreasing sustainability of bikes is not a technological problem, and it’s not unique to bicycles. We also see it in manufacturing other products, such as computers. One bike mechanic observes: “The problem here is capitalism; it’s not the bikes.” [14]
Reverting to domestic and less automated bike manufacturing is a requirement for sustainable bicycles. The main reason is not the extra energy use generated by transportation and machinery, which is relatively small. For example, shipping from China adds around 0.7 to 1.2 gCO2/km for shared bicycles. [8] More importantly, domestic and manual bike manufacturing is essential to make repair and refurbishment the more economically attractive option. By definition, repairing is local and manual, so it quickly becomes more expensive than producing a new vehicle in a large-scale, automated factory. [10] Locally made bicycles would increase the purchase price for consumers. However, better repairability would allow for a longer life expectancy and a lower cost in the long term. Addressing bike theft and parking problems is also essential because they are often a reason for buying cheap, short-lasting bicycles. [25]
Finally, shared bicycle services can have their place, and we will probably see further improvements in their resource efficiency – the newest bike-sharing stations in Paris have reduced their power consumption by a factor of six. [8] However, shared bicycles are unlikely to become more sustainable than private bicycles because they always require rebalancing and a high-tech infrastructure to make the service work. Furthermore, getting attached to your bike can be a strong incentive to take care of it well and thus increase its life expectancy, as I can testify.
Kris De Decker
- Read Low-tech Magazine offline.
- Subscribe to Low-tech Magazine’s newsletter.
- Support Low-tech Magazine via Paypal or Patreon.
SOURCES
[1] Szto, Courtney, and Brian Wilson. “Reduce, re-use, re-ride: Bike waste and moving towards a circular economy for sporting goods.” International Review for the Sociology of Sport (2022): 10126902221138033. https://journals.sagepub.com/doi/pdf/10.1177/10126902221138033
[2] Johnson, Rebecca, Alice Kodama, and Regina Willensky. “The complete impact of bicycle use: analyzing the environmental impact and initiative of the bicycle industry.” (2014). https://dukespace.lib.duke.edu/dspace/bitstream/handle/10161/8483/Duke_MP_Published.pdf
[3] Norcliffe, Glen, et al., eds. Routledge Companion to Cycling. Taylor & Francis, 2022. https://www.routledge.com/Routledge-Companion-to-Cycling/Norcliffe-Brogan-Cox-Gao-Hadland-Hanlon-Jones-Oddy-Vivanco/p/book/9781003142041
[4] Cole, Emma. “What’s the environmental impact of a steel bicycle frame?” Cyclist, November 7, 2022. https://www.cyclist.co.uk/in-depth/11003/steel-bike-frame-environmental-impact
[5] Mercer, Liam. “Starling Cycles publishes environmental footprint assessment and policy.” Off-road.cc, July 2022. https://off.road.cc/content/news/starling-cycles-publishes-environmental-footprint-assessment-and-policy-10513
[6] Chang, Ya-Ju, Erwin M. Schau, and Matthias Finkbeiner. “Application of life cycle sustainability assessment to the bamboo and aluminum bicycle in surveying social risks of developing countries.” 2nd World Sustainability Forum, Web Conference. 2012. https://sciforum.net/manuscripts/953/original.pdf
[7] Chen, Jingrui, et al. “Life cycle carbon dioxide emissions of bike sharing in China: Production, operation, and recycling.” Resources, Conservation and Recycling 162 (2020): 105011. https://www.sciencedirect.com/science/article/abs/pii/S0921344920303281
[8] De Bortoli, Anne. “Environmental performance of shared micromobility and personal alternatives using integrated modal LCA.” Transportation Research Part D: Transport and Environment 93 (2021): 102743. https://www.sciencedirect.com/science/article/abs/pii/S136192092100047X
[9] Roy, Papon, Md Danesh Miah, and Md Tasneem Zafar. “Environmental impacts of bicycle production in Bangladesh: a cradle-to-grave life cycle assessment approach.” SN Applied Sciences 1 (2019): 1-16. https://link.springer.com/article/10.1007/s42452-019-0721-z
[10] Mao, Guozhu, et al. “How can bicycle-sharing have a sustainable future? A research based on life cycle assessment.” Journal of Cleaner Production 282 (2021): 125081. https://www.sciencedirect.com/science/article/abs/pii/S0959652620351258
[11] Leuenberger, Marianne, and Rolf Frischknecht. “Life cycle assessment of two wheel vehicles.” ESU-Services Ltd.: Uster, Switzerland (2010). https://treeze.ch/fileadmin/user_upload/downloads/Publications/Case_Studies/Mobility/leuenberger-2010-TwoWheelVehicles.pdf
[12] Erik Bronsvoort & Matthijs Gerrits. “From marginal gains to a circular revolution”. Paperback (full-colour): 160 pages, ISBN: 978-94-92004-93-2, Warden Press, Amsterdam. https://circularcycling.nl/product/from-marginal-gains-to-a-circular-revolution/
[13] US petition that calls for end to built to fail bikes gaining support in BC. https://vancouversun.com/news/local-news/u-s-petition-that-calls-for-end-of-built-to-fail-bikes-gaining-support-in-b-c
[14] Aaron Gordon. “Mechanics Ask Walmart, Major Bike Manufacturers to Stop Making and Selling ‘Built-to-Fail’ Bikes”, Vice, January 13, 2022. https://www.vice.com/en/article/wxdgq9/mechanics-ask-walmart-major-bike-manufacturers-to-stop-making-and-selling-built-to-fail-bikes
[15] Koop, Carina, et al. “Circular business models for remanufacturing in the electric bicycle industry.” Frontiers in Sustainability 2 (2021): 785036. https://www.frontiersin.org/articles/10.3389/frsus.2021.785036/full
[17] Temporelli, Andrea, et al. “Last mile logistics life cycle assessment: a comparative analysis from diesel van to e-cargo bike.” Energies 15.20 (2022): 7817.. https://www.mdpi.com/1996-1073/15/20/7817
[18] Schünemann, Jaron, et al. “Life Cycle Assessment on Electric Cargo Bikes for the Use-Case of Urban Freight Transportation in Ghana.” Procedia CIRP 105 (2022): 721-726. https://www.sciencedirect.com/science/article/pii/S2212827122001214
[19] Luo, Hao, et al. “Comparative life cycle assessment of station-based and dock-less bike sharing systems.” Resources, Conservation and Recycling 146 (2019): 180-189. https://www.sciencedirect.com/science/article/abs/pii/S0921344919301090
[20] https://www.theguardian.com/environment/green-living-blog/2010/sep/23/carbon-footprint-new-car
[21] Bicycles are entirely or partly powered by food calories. Some people argue that the life cycle energy requirements of bicycles are higher than other modes, when one considers the impact of food require to provide additional calories that are burned during the bicycle use. However, the majority of people in car-centered societies take in more calories than their sedentary lifestyle requires. Increased cycling would lead to lower obesity rates, not to higher calorie intakes.
[22] This a purely theoretical calculation, because cars encourage much longer trips than bicycles.
[23] Ford, Dexter. “As Cars Are Kept Longer, 200,000 Is New 100,000.” New York Times, March 16, 2012. https://www.nytimes.com/2012/03/18/automobiles/as-cars-are-kept-longer-200000-is-new-100000.html?_r=2&ref=business&pagewanted=all&
[24] Zheng, Fanying, et al. “Is bicycle sharing an environmental practice? Evidence from a life cycle assessment based on behavioral surveys.” Sustainability 11.6 (2019): 1550. https://www.mdpi.com/2071-1050/11/6/1550
[25] Larsen, Jonas, and Mathilde Dissing Christensen. “The unstable lives of bicycles: the ‘unbecoming’of design objects.” Environment and Planning A: Economy and Space 47.4 (2015): 922-938. https://orca.cardiff.ac.uk/id/eprint/131212/1/M%20Christensen%202015%20the%20unstable%20lives%20of%20bicycles%20ver2%20postprint.pdf
[26] Calão, Júlio, et al. “Life Cycle Thinking Approach Applied to a Novel Micromobility Vehicle.” Transportation Research Record 2676.8 (2022): 514-529. https://journals.sagepub.com/doi/pdf/10.1177/03611981221084692
[27] A comparison of the life cycle emissions of a bamboo versus an aluminium bicycle showed little difference (233 vs. 238 kg CO2). [6]
Photo by Himiway Bikes on Unsplash