The world may never again use as much coal as during a peak in 2014, according to the latest World Energy Outlook from the International Energy Agency (IEA).
The weighty annual outlook is one of the most widely respected and eagerly anticipated publications among energy analysts and policymakers. The 2018 edition runs to 662 pages and contains the IEA’s latest view of how the future of global energy might play out, depending on political and societal choices.
Its prominence means the report is also a frequent target of criticism for having often failed to anticipate the rate or direction of change.
In its main scenario – based on existing national policies, plus pledges and targets not yet codified in law – the 2018 outlook points to a 25% increase in energy demand by 2040. This growth, largely driven by Asia, would be twice as large in the absence of continued improvements in energy efficiency, it says.
Rapidly growing renewables and nuclear are not expected to cover this new demand, the IEA says. This means that oil, gas and CO2 emissions will likely continue to increase. Even with coal use remaining flat, this leaves a “huge” gap to meeting the Paris Agreement’s climate goals, the IEA adds.
No forecasts
In its 2018 edition, the IEA is keen to emphasise what the outlook is, as well as what it is not. The report is based around a series of scenarios designed to “explore possible futures and the actions that could bring them about”. The IEA explains:
“There are no forecasts in the WEO…None of these potential pathways is preordained; all are possible. The actions taken by governments will be decisive in determining which path we follow.”
The outlook has two main pathways – a “new policies scenario” (NPS) and a “sustainable development scenario” (SDS). Each one models the world’s energy system between now and 2040.
Like all efforts to model the world’s economy, society and climate, the IEA’s scenarios rely on a range of assumptions about the evolution of population, economic growth and technologies.
In addition, the NPS “holds up a mirror to the ambitions of policymakers around the world, as they exist today”. It looks at what might happen under existing policies, plus those not yet codified in law. For example, the national climate pledges made under the Paris Agreement.
The SDS works backwards to see what would need to happen in order to meet the Paris goal of limiting warming to “well below 2C”. It is based on a 66% chance of staying below 2C and would not meet the aim of limiting warming to 1.5C. The SDS also meets global sustainable development goals including universal access to “modern energy services”, such as electricity.
The report also includes a “current policies scenario” excluding pledges or targets. This pathway would lead to “increasingly perilous territory for all aspects of energy security”, the IEA warns. This year’s outlook has two extra pathways looking at increasing electrification of energy use (“future is electric scenario”) and ramping up of energy efficiency efforts (“efficient world scenario”).
A look back to earlier IEA outlooks shows how quickly change can arrive and how wrong well-intentioned scenarios can be. The 2002 outlook, for example, said Chinese CO2 emissions would remain below those in the US out to 2030. The 2008 outlook said gas would continue to be the most expensive source of power in the US “by far”.
This is a reminder that no single future is preordained and that politics, technology – and, above all, the people and societies that shape them – have an infinite capacity for surprise.
Straying off course
As in previous years, this year’s outlook devotes much of its time to the NPS, the IEA’s view of the world’s current energy and emissions trajectory to 2040. This would see a 25% increase in global energy demand, the IEA says, driven by population growth, urbanisation and economic growth in India and other developing countries in Asia.
The increase would be twice as large were it not for expected energy efficiency improvements, which would avoid 3,000m tonnes of oil equivalent (Mtoe) of final energy use in 2040. This avoided energy is roughly equivalent to current demand in China and the EU combined.
The report notes: “Energy efficiency is a proven way of meeting multiple energy policy goals, but the flow and stringency of new policies [in this area] appears to be weakening.”
The NPS sees this new energy demand to 2040 being met by increases from gas, wind and solar, bioenergy, oil, nuclear and hydro, in that order (blue bars in the chart, below). Coal would be the only fuel that sees no growth, with demand levelling off and remaining below the 2014 peak.
Change in global energy demand 2017-2040 in the IEA’s main “new policies scenario” (blue), which includes existing policies plus pledges not yet enacted versus its “sustainable development scenario” (red), which is compatible with the “well below 2C” Paris Agreement climate goal as well as goals on energy access, air pollution and others. Other renewables includes wind and solar. Source: IEA World Energy Outlook 2018 and Carbon Brief analysis. Chart by Carbon Brief using Highcharts.
As the chart above shows, however, this trajectory is far from being compatible with the “well below 2C” goal of the Paris Agreement. The red bars show how energy use would need to change between 2017 and 2040 to get onto the IEA’s target-compatible SDS.
The most notable differences are the 2,153Mtoe drop in coal use – a reduction of three-fifths compared to today’s levels – and a 1,279Mtoe fall for oil, a cut of more than a quarter. At the same time, wind and solar energy would grow nearly six-fold from the level in 2017. Less obvious, but equally important, is that the SDS would hold global energy demand at today’s levels.
Apart from the political barriers to changing course, the IEA suggests the incremental increase in investment would be relatively low. Under the NPS, the world would need to invest a cumulative $60tn between 2018 and 2040 in the fossil fuel supply chains, electric grids, power plants and energy efficiency schemes that make up the global energy system. For the SDS it would be $68tn.
Rather than radically increasing energy investment, the SDS would instead require a redirection of funds away from fossil fuels towards energy efficiency and clean energy. The IEA says there would nevertheless be a need to invest in new supplies of fossil fuels – even in the SDS.
Rising emissions
Flat coal demand plus rising oil and gas use in the NPS would mean that energy-related CO2 emissions would continue to rise throughout the outlook period to 2040. The IEA notes:
“The New Policies Scenario puts energy-related CO2 emissions on a slow upward trend to 2040, a trajectory far out of step with what scientific knowledge says will be required to tackle climate change.”
The chart below left breaks down this growth in CO2 by country and region while the chart below right divides emissions by sector. The yellow line shows the trajectory that would be needed for the 2C-compatible SDS, with emissions roughly halving by 2040.
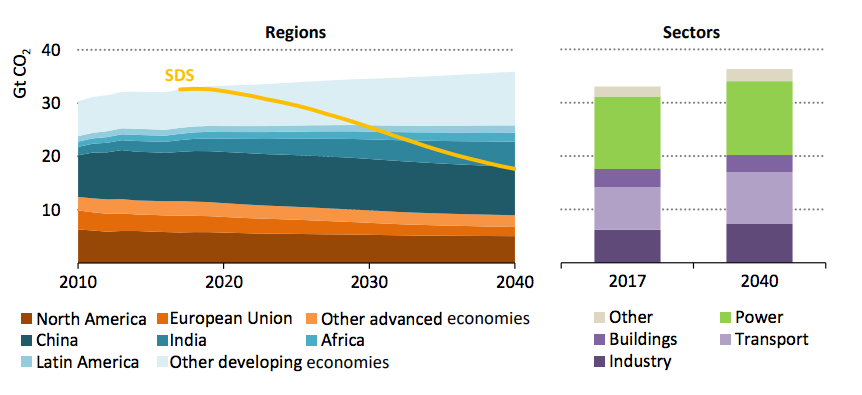
Left panel: Energy-related CO2 emissions by country or region in the “new policies scenario” 2010-2040, billions of tonnes of CO2 (GtCO2). The “sustainable development scenario”, where temperature rise is limited to 2C, is shown with the yellow line. Right panel: Emissions in 2017 and 2040 broken down by sector. Source: IEA World Energy Outlook 2018.
The rising emissions in the NPS would be roughly equivalent to those implied by countries’ collective climate pledges under the Paris Agreement. This would put the world on course to warm by 2.7C above pre-industrial temperatures by 2100, the IEA says, versus 1.7-1.8C in the SDS.
Shifting to the SDS would require a “systematic preference for investment in sustainable energy technologies” because so much high-carbon infrastructure has already been locked in says IEA executive director Dr Fatih Birol, in a press release:
“We have reviewed all current and under-construction energy infrastructure around the world – such as power plants, refineries, cars and trucks, industrial boilers and home heaters – and find they will account for some 95% of all emissions permitted under international climate targets in coming decades.”
If investments are not shifted fast enough, then parts of the existing energy system will have to be retired early or retrofitted for greater efficiency or carbon capture and storage, Birol says.
The IEA adds that energy-related CO2 emissions started to increase again in 2017, after three flat years, and that another increase in 2018 is likely. In a call with journalists, Tim Gould, head of the supply division of the World Energy Outlook said: “Everything we’ve seen for 2018 suggests we are set for a historic high for CO2 emissions this year.”
Coal peak
The IEA’s view on coal is a ray of light amidst these gloomy prospects for climate change. The 2018 outlook’s NPS has global coal use remaining at similar levels during 2017-2040. This would mean coal demand had effectively peaked in 2013/2014.
The IEA says coal use “flattens…and does not regain the peak seen in 2014”. This means it joins oil firm BP in seeing a global coal demand peak.
As the chart below shows, flat coal demand to 2040 (red line) would mark a significant shift compared to the 15% growth anticipated in the IEA’s 2013 World Energy Outlook (lightest blue).
Global coal demand between 1965 and 2040, millions of tonnes of oil equivalent (Mtoe). Historical use is shown in black while NPS pathways to 2040, drawn from successive IEA outlooks are shown in shades of blue and red. Source: IEA World Energy Outlooks 2013-2018; BP Statistical Review of World Energy 2018; and Carbon Brief analysis. Chart by Carbon Brief using Highcharts.
The flat coal demand outlook in this year’s NPS conceals significant differences around the world.
Coal use would fall in the US, EU and other developed countries. China would also see a decline of 13% by 2040, the equivalent of overall demand in the EU today. The IEA saw Chinese coal demand continuing to increase as recently as 2014, later coming round to the idea it had peaked.
[slide-anything id=’3472166′]
The IEA’s NPS suggests these decreases would be balanced by rising demand primarily in India, but also in other Asian countries. Indian coal demand would more than double to 2040, largely due to a doubling in coal-fired power capacity and generation.
This trend comes despite the IEA itself acknowledging that new renewables are – or soon will be – cheaper sources of electricity in India than new coal. Indeed, some analysts argue that this point has already been passed and that much of India’s planned new coal capacity is unlikely to be built.
The prospect of Indian coal demand doubling also comes despite the IEA pointing to 350GW of excess power generating capacity spread between India, China and other countries in the Middle East and Asia. This huge excess – equivalent to a third of the Chinese coal fleet or more than all the plants in India – weighs on coal operator profits as it cuts the running hours at each unit.
[The NPS pathway for coal use in India appears to nearly match a draft national electricity plan. As such, it might reflect a policy intention rather than a least-cost pathway for meeting demand.]
The IEA’s most recent short-term forecast for coal slashed growth in India, suggesting the outlook for the country is highly volatile and liable to fall. Today’s outlook says the situation in India and elsewhere is “highly contingent on how policies evolve”. It adds:
“The demise of coal has been widely predicted and consumption fell for two years straight from 2015, but bounced back in 2017…Recent trends provide a reminder that coal demand could be more resilient than some expect, especially among developing economies in Asia.”
It is worth briefly comparing these coal trends to those that would be required for the IEA’s SDS. Here, “coal moves to the back of the pack”, the IEA says, with demand down to 1975 levels. CO2 emissions from coal-fired power generation would fall by 90% in 2040 and around 60 gigawatts (GW) of coal plants would retire each year, roughly equivalent to the current German fleet.
Electric vehicles
The IEA says it expects 300m electric cars on the road by 2040 in its NPS. This is similar to BP’s outlook, but some 250m lower than that from Bloomberg New Energy Finance (BNEF).
More importantly, like solar power pathways from the IEA and others, history suggests that long-term outlooks for electric vehicles (EVs) will continue to be revised upwards.
The IEA suggests EVs will account for just a fifth of new cars sold in 2040 in its NPS. Some of the world’s largest markets – including China, India and the UK – have announced plans to ban combustion-engine cars, but many of these targets lack a firm date or remain aspirational.
By 2040 in its main scenario, the IEA also expects some 740m electric bikes, scooters and tuk-tuks, along with 30m electric trucks and 4m electric buses to be on the world’s roads. In all, these EVs would use 1,200 terawatt hours (TWh) of electricity each year, 3% of the global total.
Despite these apparently impressive numbers, the IEA expects fuel efficiency to do more to limit oil demand growth than EVs. It says:
“Oil use for cars peaks in the mid-2020s [in the NPS], but petrochemicals, trucks, planes and ships still keep overall oil demand on a rising trend. Improvements in fuel efficiency in the conventional car fleet avoid three-times more in potential demand than the 3 million barrels per day (mb/d) displaced by 300 million electric cars on the road in 2040.”
In the SDS, there are 900m electric cars by 2040, accounting for more than half of a total fleet that nearly doubles in size compared to today.
The scenario also for the first time includes policies to “avoid” and “shift” transport use from private vehicles towards public transport or two and three-wheel options. The net impact of these policies is to take 200m cars off the world’s roads and to cut global transport emissions by 3% in 2040.
Renewables rise
The language used to describe renewables in this year’s outlook is noticeably different compared with earlier editions. This reflects cost reductions and deployment pathways that have been much faster than the IEA expected.
In its 2008 outlook, the IEA had described solar power as “very expensive”. This year, it says: “The increasing competitiveness of solar PV pushes its installed capacity beyond that of wind before 2025, past hydropower around 2030 and past coal before 2040 [in the new policies scenario].”
Along with digitalisation and electrification, renewables are “central” to the prospects for meeting global climate and sustainable development goals, the outlook says.
In the NPS, wind and solar expand nearly six-fold between 2017 and 2040. Along with other non-hydro renewables, this would see them overtake coal as the largest source of electricity in the world. By 2040, low-carbon sources would meet slightly more than half of global demand.
In the SDS, wind and solar would grow even faster, expanding nine-fold to 2040. Low-carbon sources would meet around 85% of electricity demand, with gas meeting most of the remainder.
This year’s report says: “Wind and solar photovoltaics (PV) bring a major source of affordable, low-emissions electricity into the picture, but create additional requirements for the reliable operation of power systems.”
Solar is “cheaper than ever”, it says, adding:
“In many countries, solar PV is becoming among the least expensive options to produce electricity…These developments have undercut the case for new investment in thermal generation in some countries, especially in coal-fired power.”
The IEA says the unsubsidised cost of solar power has fallen steeply – by an average 65% in the past five years – as the chart below shows (yellow lines). Costs have also declined for onshore wind (light green, 15%) and for offshore wind (dark green, 25%).
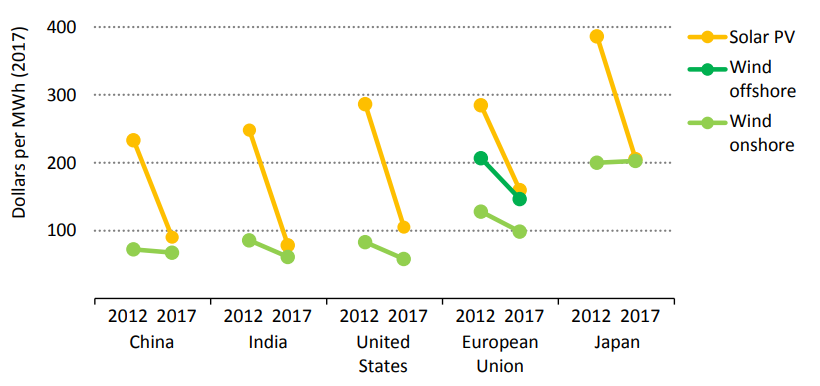
Levelised costs of wind and solar power by region (dollars per megawatt hour, $/MWh). Note that the chart is based on data from the International Renewable Energy Agency (IRENA). It excludes subsidies and assumes a standardised 8% rate of financing costs (7% in developing economies). Source: IEA World Energy Outlook 2018.
The figures in the IEA’s chart, above, reflect standardised assumptions about project and financing costs. Specific projects winning contracts at auction may cost up to 60% less than these averages by leveraging “best-in-class” locations, financing rates and other factors, the IEA says.
The cost-competitiveness of wind and solar means:
“Some arguments often heard in favour of incumbent fuels, focusing on their affordability and their role in providing energy access, no longer hold as much water as they once did.”
The outlook repeats and reinforces analysis it published last year, showing that renewables will provide more people with access to electricity than coal.
Some 650 million additional people would need to be connected to electricity – on top of those newly gaining access in the NPS – in order to achieve universal provision by 2040, the IEA says. This target is met in the SDS and renewables would be “the most cost-effective” option for three-quarters of these people, it adds.
The scenario would also see universal clean-cooking provision based on bottled gas or electricity replacing “traditional” biomass such as firewood or dung. This would have climate benefits, the IEA says, as it would reduce methane emissions and pressures on deforestation.
New electricity cost metric
This year’s WEO introduces a new metric to compare the costs of different electricity generation technologies, called “VALCOE” (value-adjusted levelised cost of electricity, LCOE). This metric extends the standard LCOE, which continues to see wide use despite criticism from some quarters.
The VALCOE amends the LCOE for each technology and region based on three criteria:
- The electricity price that each plant might earn from the market. This tends to be higher for coal and gas plants that can turn down during low demand and ramp up to capture peaks.
- The level of each plant’s flexibility and its ability to provide electricity system services, such as frequency regulation or reserve power in case of unexpected breakdowns.
- The proportion of a plant’s capacity that would be available on demand.
The list of “value” amendments to the standard LCOE calculation does not include factors such as the externalised costs of greenhouse gas and pollutant emissions, which are rarely fully priced by the market. It also leaves out the cost of integrating variable renewables onto the grid.
The VALCOE can generally be expected to put fossil-fired power stations in a relatively more favourable light. Nevertheless, the IEA says wind and solar retain their “advantageous position” in many markets. Based on the new metric, it says that: “New solar PV is well placed to outcompete new coal almost everywhere.”
However, the report adds the following, based on its VALCOE measure:
“One point of consistency over time and across the world is that existing fossil-fuelled power plants will remain very competitive. Existing coal-fired facilities remain competitive in China, India, the US and the EU, while gas CCGTs [combined cycle turbines] also continue to be attractive in the US and EU.”
This conclusion appears at odds with several market indicators: US coal plant retirements are nearing a record in 2018; much of the EU’s existing coal capacity is thought to be “cash-flow negative”; and there is 40GW of “stressed” or “unviable” coal capacity in India.
In contrast to the IEA’s VALCOE analysis, new LCOE estimates just published by investment bank Lazard found new wind and solar to be cheaper than existing coal plants in many parts of the US.
One key difference between these metrics is that the VALCOE attempts to assess the value of different technologies to the whole electricity system. It takes the perspective of a rational system operator optimising decisions across the grid. LCOE comes closer to reflecting the choices for investors, who are only interested in the financial performance of their individual asset.