The yearly Energy Outlook publication by B.P.[1] provides a good “reality check” with the enthusiasm of the green growth crowd, while at the same time providing a highly optimistic view of future liquid fuel supplies and the acceptance of natural gas as a climate friendly fuel.
Green Growth Reality Check
As long as the global economic annual growth rate (increase in Gross Domestic Product – GDP) is higher than the global annual decrease in energy intensity (amount of energy required for each unit of GDP), more energy will be required with the passing of each year. The B.P. Outlook assumes a historically average global GDP growth rate of 3.5% that more than doubles global GDP by 2035, and a historically high 2.1% annual reduction in energy intensity (versus 1.5% in the past two decades). The former overwhelms the latter, and overall energy consumption increases by approximately a third. If the difference is not made up by a reduction in the carbon intensity of energy usage (the amount of carbon emissions per unit of energy), mostly by increases in non-fossil fuel energy usage, then carbon emissions continue to increase. It isn’t and therefore carbon emissions continue to go up, only at a slower rate than previously (0.9% per year, versus 2.1% per year in the previous decade).
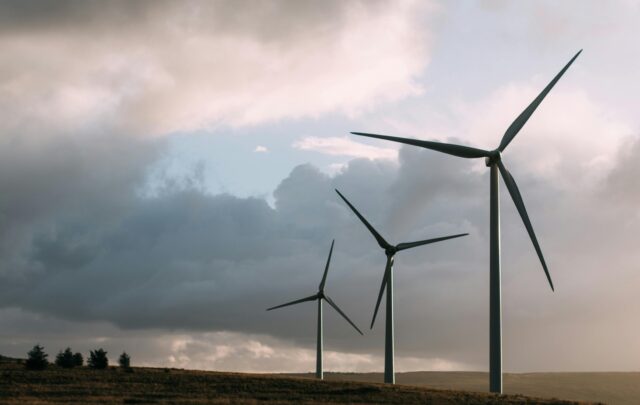
There are very significant financial, infrastructural, resource, social, political etc. limits on the ability of the renewable energy sector to grow its output, and therefore reduce the carbon intensity of energy usage. In addition, the renewable sector produces electricity, which accounts for less than half of energy consumption (B.P. assumes an increase from the current 42% to 48% by 2035). During the forecast period renewables are the fastest growing energy source, growing at 6.6% annually to increase their share of energy production from 3% to 9% by 2035. Even with increases in hydro of 0.9% per year, and nuclear of 1.8% per year (mostly due to a 9-fold increase in China and Japan restarting its reactors), increased energy consumption still requires greater fossil fuel usage. Coal increases by 0.5% per year (mainly due to Indian industrialization based on coal), oil by 0.9% per year, and natural gas by 1.8% per year. The end result is the 0.9% annual increase in carbon emissions, an improvement but not good when actual reductions are required.
One of the more startling forecasts is for the growth in the number of cars and commercial vehicles from 1.2 billion to 2.4 billion, with non-OECD (none rich country) numbers trebling from 0.5 billion to 1.5 billion. B.P. assumes that the average car will be able to travel 50 miles on a gallon of gasoline, versus 30 miles today, but again increased efficiency is more than offset by growth in numbers. The overall impression from the report is that between now and 2035 Europe and North America may be a relative sideshow in the dynamics of global energy consumption. No matter how many coal plants shut down in these regions, or how many of their inhabitants drive electric cars, what happens in China, India and other developing countries will decide the global energy mix. Another interesting observation is that by the end of the forecast period, many of the European countries may have reached a level of intermittent renewable capacity where the challenge of electric grid integration becomes an increasing constraint. This supports a view that as society cuts deeper into carbon emissions, the scale and difficulty of the required changes becomes greater.
To summarize – a trebling in the contribution of renewables, together with a historical high reduction rate in energy intensity cannot offset the growth in GDP. The result is a continued increase in carbon emissions to 2035.
Optimism On Liquid Fuel Supply Projections
The document assumes that global liquid fuel supplies will increase by 19 million barrels per day (mbpd), driven by U.S. shale and other tight oil, Brazilian deep water, and Canadian tar sands and biofuels. As a whole, these will increase by 16 mbpd, with OPEC increasing output by 7mbpd, offsetting decreases in European and Asia-Pacific output. Nowhere in the document is there a discussion of decreasing net energy, i.e. the increasing energy cost of getting the energy out of the ground (or growing it as crops) and the decreasing gross energy per unit of production.
Outside of Brazilian ethanol production, biofuels tend to be a process of energy conversion rather than energy production, providing little or no net energy after taking into account energy inputs. Natural Gas Liquids (NGLs) are not crude oil, and contain only about 60% of the energy by volume as well as requiring differing refining processes. With NGL’s, biofuels and ‘other liquids’ accounting for 9 mbpd of the assumed 19 mbpd increase in liquids supply, this produces a significant over-estimate of the energy provided. Adding to this issue is the relatively high-energy cost of shale oil, deep water and tar sands supplies, as well as the depletion of lower energy cost conventional crude oil wells. It is an open question of how much net new energy will be supplied to society, and therefore be available to drive economic growth outside the energy sector.
A further assumption is the ability to invest the huge amounts of money required to develop these liquid fuel sources, many of which require large up-front investments combined with a significant time period of negative cash-flows. Such investments are highly dependent upon the assumptions of future liquid fuel prices. The extreme price volatility of the past two decades may make such price forecasts much more conservative, reducing the number of projects that can be successfully financed. The financial problems currently being experienced by the liquid fuels industry (and their investors and bankers), after a period of large investments, may also create a much more conservative investment atmosphere. This may greatly constrain, or delay, any future responses to increasing liquid fuel prices.
The net result may be a lower level of increase in gross liquid fuels production, with an even lower level of increase in the net energy provided. This will constrain GDP growth, and also possibly produce higher prices that drive greater energy and carbon efficiency gains. The result may be a small reduction in carbon emissions over the period produced by lower economic growth and higher liquid fuel prices.
Natural Gas As A Bridge Fuel
Given the continuing ability of the North American energy industry to externalize the environmental and social costs of shale gas production[2], assumptions for future production may be reasonable. Especially if natural gas exports move North American prices closer to the much higher prices in other regions. Assumptions of significant increases in China may also be reasonable, given the ability of its state to override local objections to shale gas developments and the urgency to reduce the air pollution from coal-fired electricity-generating plants[3]. B.P. assumes a significant increase in shale gas production, at 5.6% per annum, with its’ share of global natural gas production increasing from 11% to 24% by 2035. The vast majority of this increase is assumed to come from North America and China. As with liquid fuels, there is no assessment of net energy. Given the energy intensive nature of shale gas production, especially in the arid and remote regions where much of the Chinese reserves reside, the incremental net energy provided may be much less than the increases in gross output. This can only be exacerbated by the depletion of lower energy cost conventional supplies.
An increasing amount of academic research is identifying natural gas as being at least as bad, if not worse, for climate change than coal, taking into account the methane emissions at the production sites and throughout the distribution network[4] [5]. Any reduction in atmospheric sulfates and other sun-blocking particles produced by coal incineration may also intensify regional climate change by allowing more of the sun’s radiation to be retained by the Earth’s atmosphere[6] [7]. If this reality takes hold with climate activists, and the general public, the construction of natural gas fired electricity generating plants may run up against the same opposition as the construction of coal fired plants. Given that a significant increase in natural gas consumption is assumed for Europe and North America, where civil society and climate activism may have a greater impact, this may reduce growth in natural gas consumption. In China and the Middle East, such pressures from civil society may be greatly muted.
Alternatives
The B.P. outlook considers some different alternatives. When looking at a slower rate of GDP growth (not created by fossil fuel supply constraints), it assumes that the resulting lower fossil fuel prices will tend to crowd out renewables, hydro, and nuclear energy with the result that the reduction in carbon emissions will be less than the gross reduction in energy usage. A reduction from 3.5% to 3% annual growth is assumed to reduce carbon emissions by only 7% over the 20-year forecast period relative to the base case (i.e. they still go up by 13%). Simplistically extrapolating, to keep emissions flat during the period a growth rate of 2% would be required. Given assumed higher growth rates in the developing countries, such a scenario may amount to ongoing stagnation in Europe and North America.
In a scenario where the carbon price was set at US$100/tonne in the OECD and US$50/tonne outside the OECD (in 2015 dollars), together with other climate-friendly regulatory and policy initiatives, B.P. forecasts that the renewable energy sector will grow at a rate of 9% per annum (doubling in size every 8 years!). Its share of the world energy supply increases from 3% to 15% by 2035. Carbon emissions are estimated to be 8% below 2014 levels in 2035. This would still be well short of the reductions required to forestall dangerous climate change, and does not take into account the offsetting effects of a greater usage of natural gas (i.e. increased methane emissions). Nowhere in the analysis is any assessment of the impacts on energy intensive industries, such as steel and cement production, of a differing carbon price between countries. Not good news for Europe and North America.
Renewables tend to have a lower net energy than fossil fuels, especially when the costs of balancing of intermittent output (variance in the wind and sun) are taken into account[8]. With such a large increase in the usage of low net energy renewables (3% to 15%), and lower net energy fossil fuel sources, the actual increase in the energy available to society may be significantly smaller than the increase in gross energy production. This will tend to constrain the growth in GDP. In addition, such large changes in the sources of energy supplies will have major financial and economic impacts that will serve as a drag upon economic growth. Current energy providing organizations, in place energy infrastructure, and business models may be greatly devalued or even rendered completely obsolete. As greater and greater levels of transition are envisaged, the scale of these impacts will increase exponentially and the resulting economic and social dislocations will become increasingly problematic.
Conclusions (mine, not B.P.’s)
The global economy currently emits about 10 billion tonnes of carbon into the atmosphere each year. It has been estimated that as of 2011 an additional 269 billion tonnes would cause atmospheric concentrations of carbon dioxide to exceed 450 parts per million (ppm), the level set by the United Nations International Panel on Climate Change (UN IPCC) as creating a unacceptable probability of damaging climate change impacts[9]. Simple math provides 2038 as the year that human society runs out of its “carbon budget” at current emission rates. Given probable feedbacks increasing the natural emissions of carbon dioxide and methane, together with the probable impact of an summer time ice-free Arctic Ocean absorbing the energy of the sun rather than reflecting it back out to space, and increased methane emissions from natural gas usage, that critical date may be much earlier in that decade.
The B.P. report shows that assuming historical levels of economic growth, even a very rapid ramp-up of the renewable energy sector will not significantly reduce carbon emissions. Significant reductions in carbon emissions would require both a large increase in the renewable energy sector and a constraint on economic growth. This is assuming that the 450 ppm target is correct. That target has come under increasing attack as being too high, with levels as low as 350 ppm being put forward[10]. The latter target would require the kind of rapid economic transitions only seen in the state-controlled economies of the two world wars, with extensive financial and economic losses together with major social disruptions. The 400 ppm level has already been crossed. This is the elephant in the room that few want to discuss, and most probably why the UN IPCC reports now increasingly accept the reality of an overshoot of the 450 ppm target, with future unproven technologies capturing carbon dioxide at source, and sucking carbon dioxide directly out of the atmosphere, and safely storing it.
Another elephant in the room is that a rapid increase in the use of relatively low net energy renewable sources, together with declining net energy in fossil fuel sources, may significantly curtail increases in available energy and therefore curtail increases in GDP growth[11]. For a human society that will already be struggling with a massive transition of its energy infrastructure, together with the increasing effects of climate change, this will be an additional factor that will produce economic and social stress.
Given the current inertial tendencies within our societies, the deeply uncomfortable reality may be that the B.P. base case may in fact be pretty close to how things continue for a while. Only a major shock to the system, or a series of shocks, that fundamentally invalidates business as usual would seem to be able to move society from its current path.
References
[1] British Petroleum (2016), BP Energy Outlook 2016 Edition: Outlook to 2035, British Petroleum. Accessible at https://www.bp.com/content/dam/bp/pdf/energy-economics/energy-outlook-2016/bp-energy-outlook-2016.pdf
[2] Josh Fox (2013), Gas Land Part 2, Docurama
[3] Jaeah Lee & James West (2014), America’s Fracking Boom Comes To China, The Atlantic. Accessible at http://www.theatlantic.com/international/archive/2014/09/china-fracking-natural-gas-report/380450/
[4] Robert W. Howarth (2015), Methane emissions and climatic warming risk from hydraulic fracturing and shale gas development: implications for policy, Energy and Emission Control Technologies. Accessible at http://www.eeb.cornell.edu/howarth/publications/f_EECT-61539-perspectives-on-air-emissions-of-methane-and-climatic-warmin_100815_27470.pdf
[5] Daniel Zavala-Araiza (2015), Reconciling divergent estimates of oil and gas methane emissions, Proceedings of the National Academy of Sciences. Accessible at http://www.pnas.org/content/112/51/15597.full.pdf
[6] Tom Wigley (2011), SWITCHING FROM COAL TO NATURAL GAS WOULD DO LITTLE FOR GLOBAL CLIMATE, STUDY INDICATES, AtmosNews. Accessible at https://www2.ucar.edu/atmosnews/news/5292/switching-coal-natural-gas-would-do-little-global-climate-study-indicates
[7] Associated Press (2011), China’s pollution temporarily slowed climate change, CBC News. Accessible at http://www.cbc.ca/news/technology/china-s-pollution-temporarily-slowed-climate-change-1.1010478
[8] Weißbach et al.. (2013), Energy intensities, EROIs (energy returned on invested), and energy payback times of electricity generating power plants, Energy Vol. 52 April 2013. Accessible at http://festkoerper-kernphysik.de/Weissbach_EROI_preprint.pdf
[9] Roz Pidcock (2013), Carbon briefing: Making sense of the IPCCs new carbon budget, Carbon Brief. Accessible at http://www.carbonbrief.org/carbon-briefing-making-sense-of-the-ipccs-new-carbon-budget
[10] James Hansen et. al. (2008), Target Atmospheric CO2: Where Should Humanity Aim?, The Open Atmospheric Science Journal. Accessible at http://pubs.giss.nasa.gov/docs/2008/2008_Hansen_etal_1.pdf
[11] Charles Hall et. al. (2014), EROI of different fuels and the implications for society, Energy Vol. 64. Accessible at http://www.sciencedirect.com/science/article/pii/S0301421513003856