
West Texas Intermediate sold for $105 a barrel at the start of July, but ended last week at $58. The most important factor has been surging U.S. production. But another reason oil prices have slid so much is weakness in demand for the product, which may be related to a slowdown of overall world economic growth. Here I comment on the importance of that second factor.
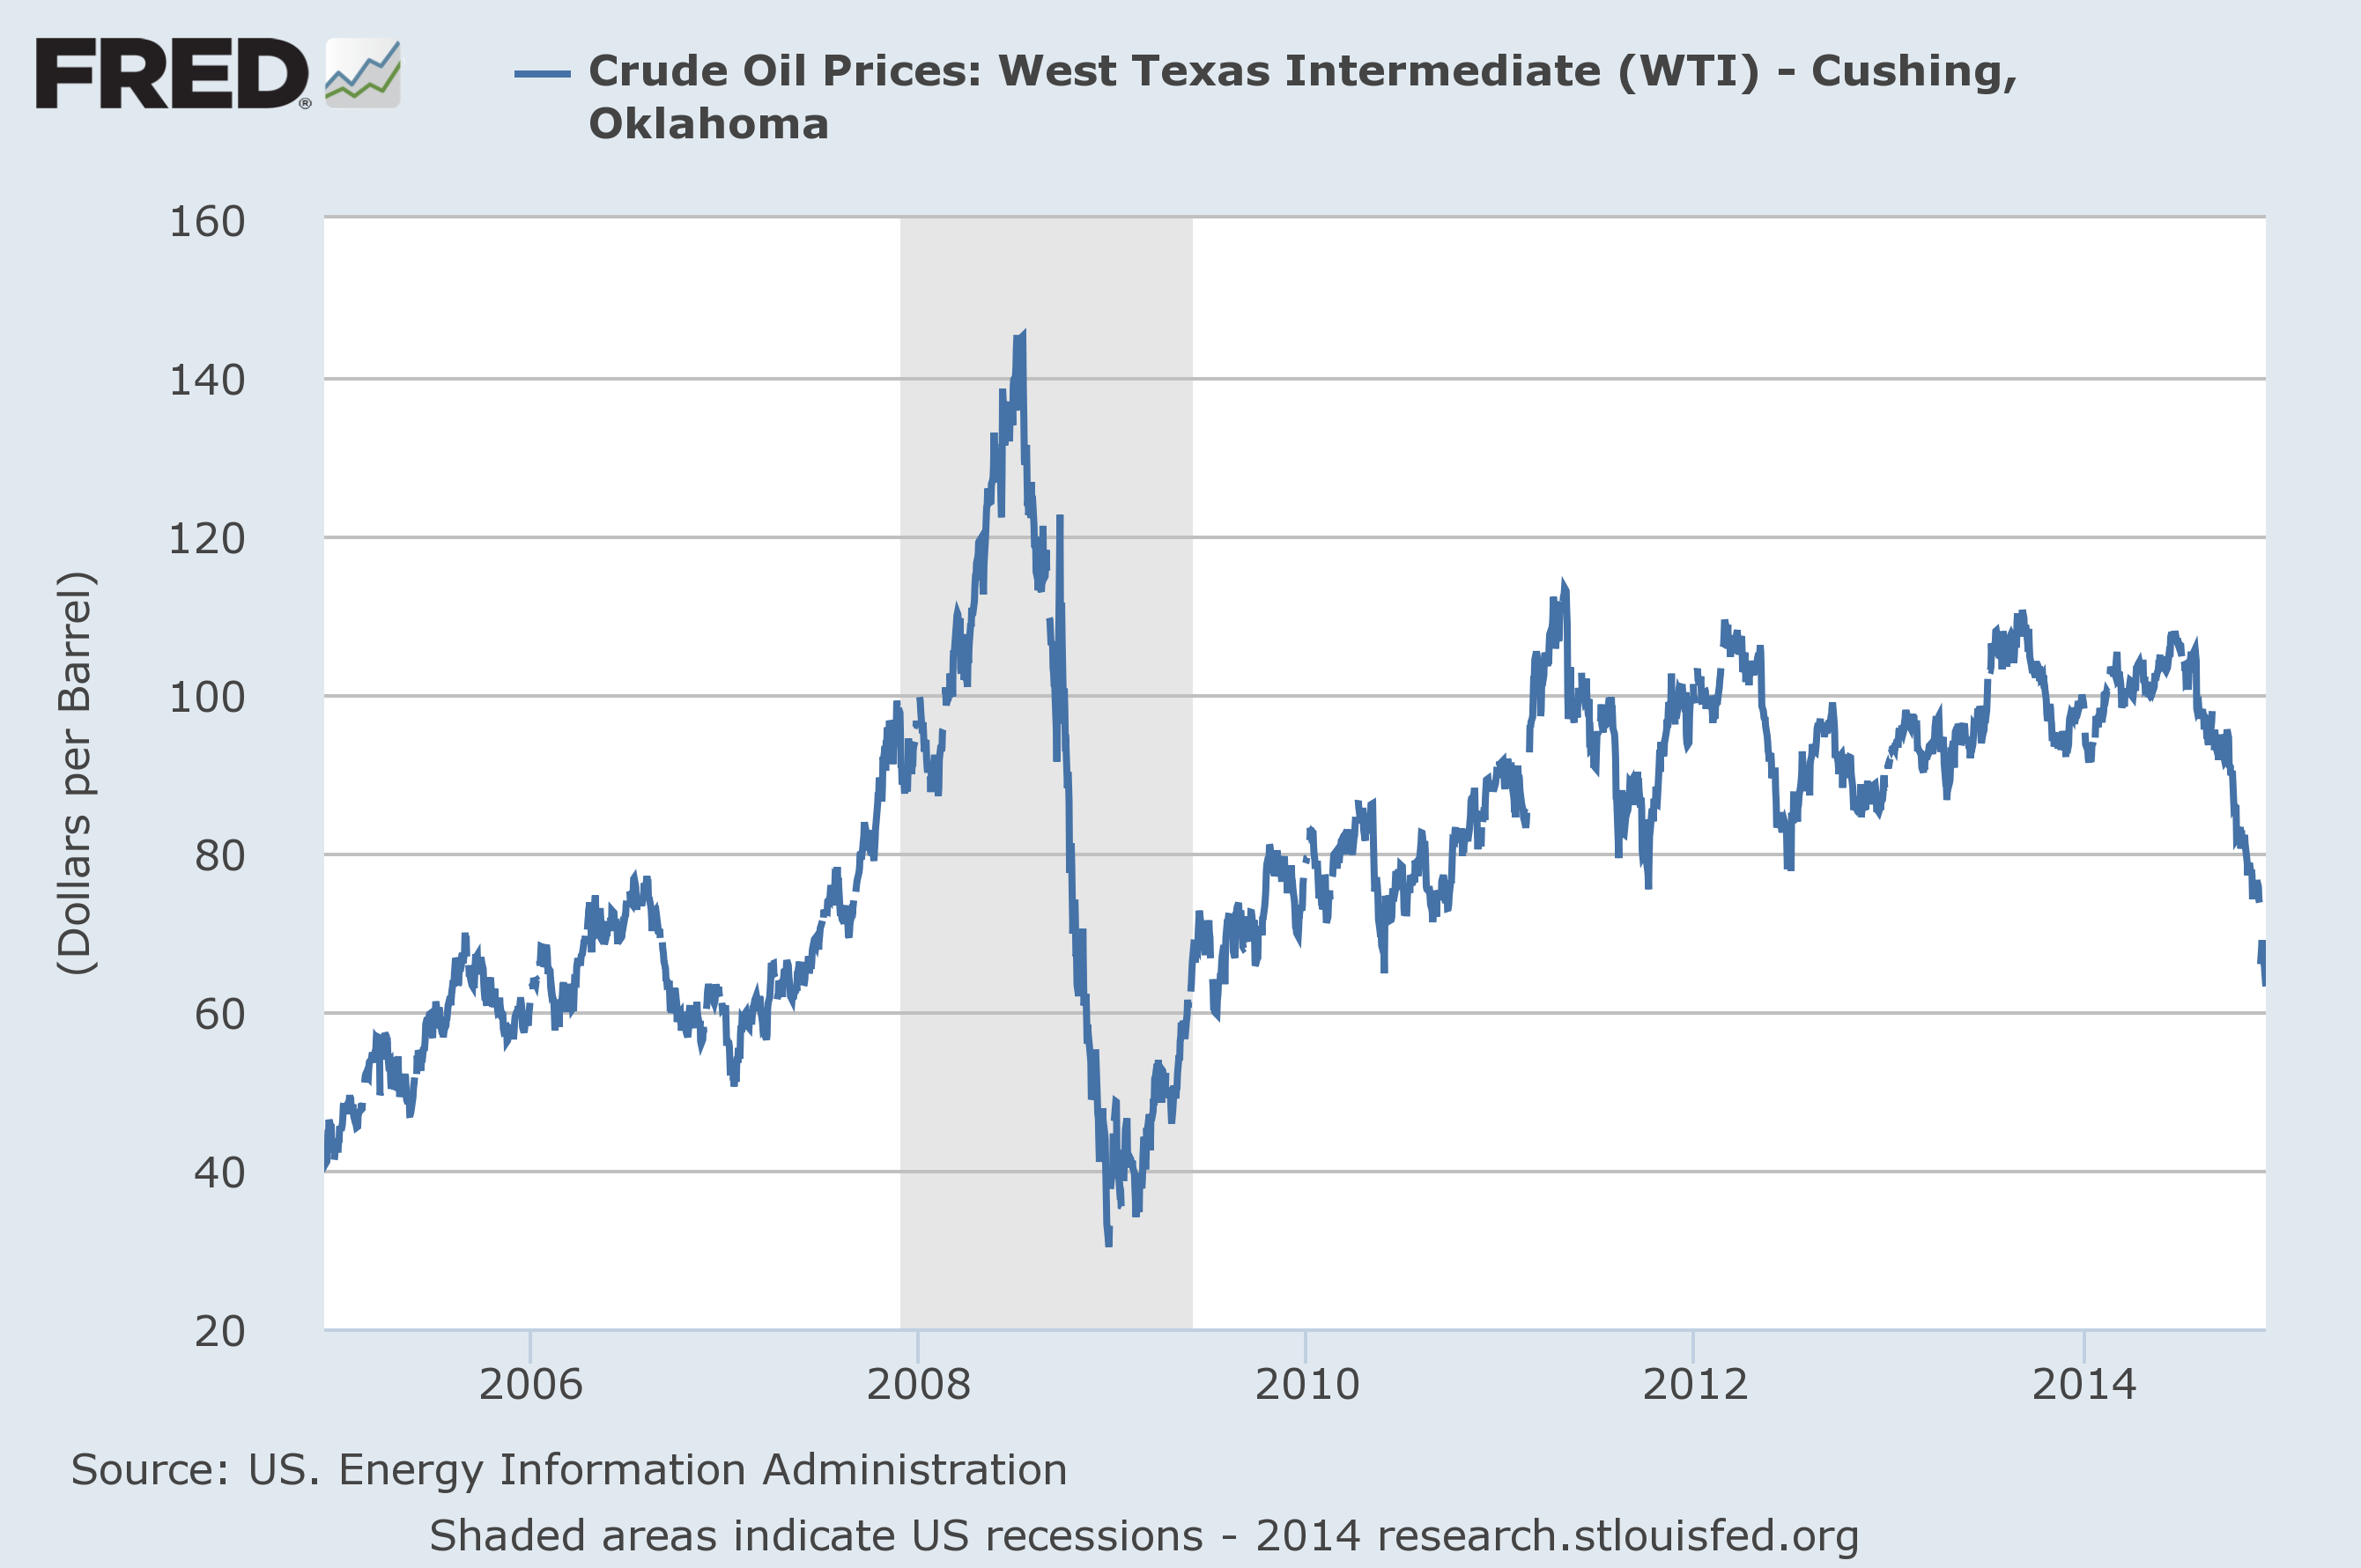
Price of crude oil (West Texas Intermediate, dollars per barrel). Source: FRED.
For example, the price of copper fell from $3.27/pound to $2.93, a 10% drop over those same six months. This of course has nothing to do with the success of people in getting more oil out of rocks in Texas. Softness in demand for commodities like copper and oil may be one indicator of new weakness in the world economy.
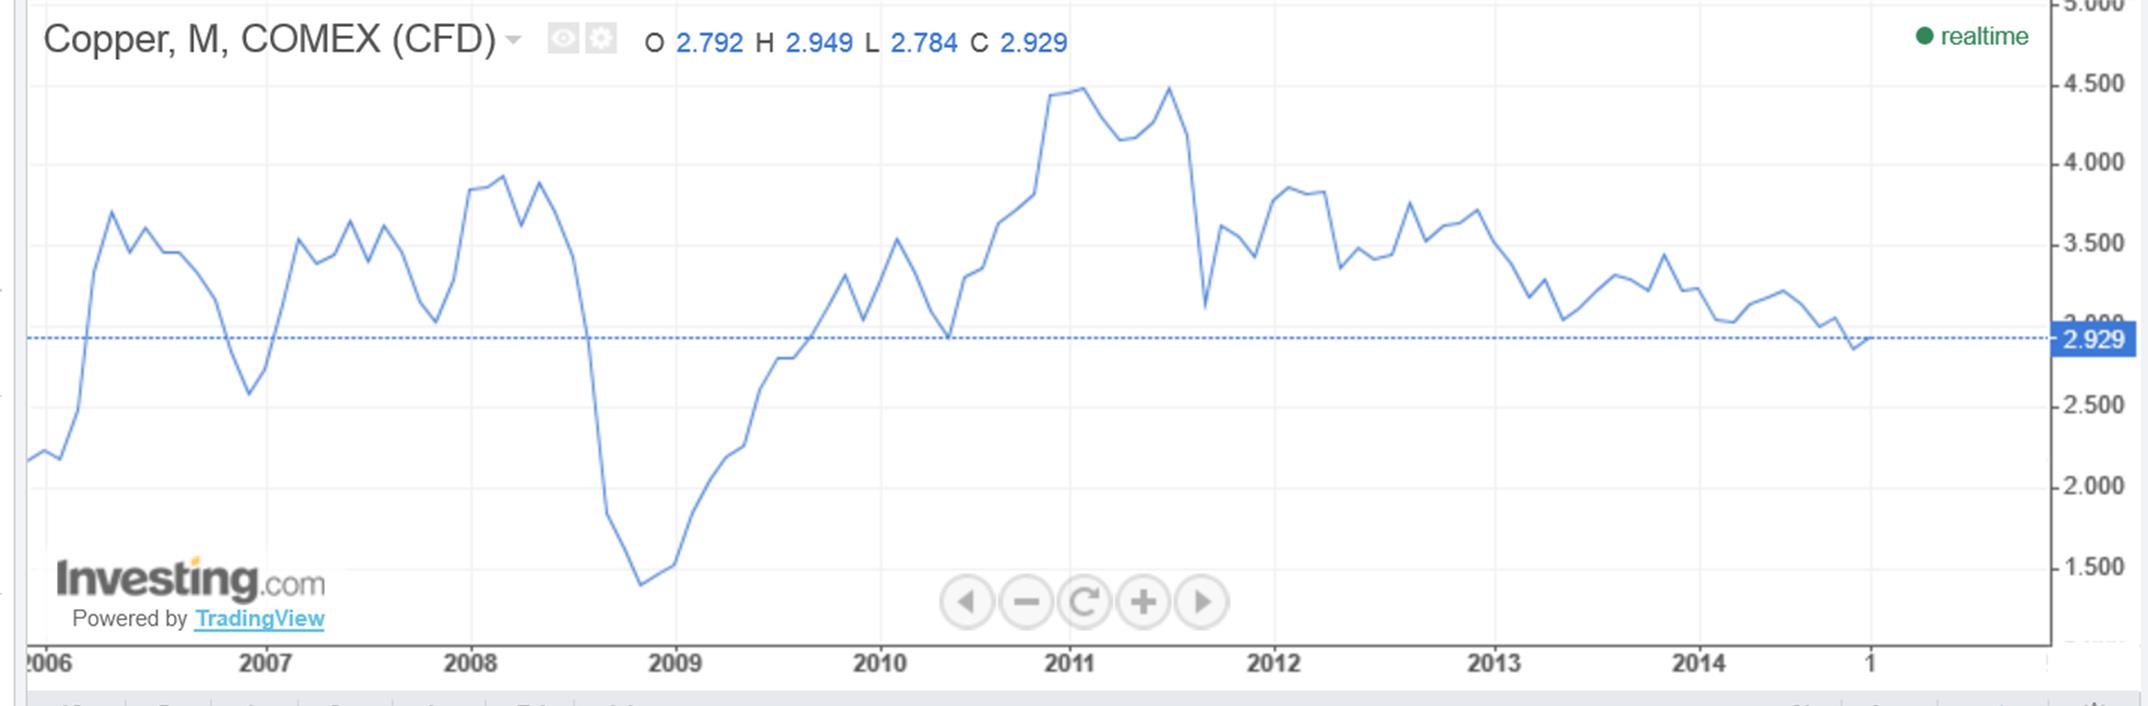
Price of copper (NYMEX, dollars per pound). Source: Investing.com.
The yield on 10-year U.S. Treasury bonds is also down almost 50 basis points over the period, for which I believe the most plausible interpretation is again weakness in the world economy.

Nominal interest rate on 10-year Treasury bonds. Source: FRED.
And the dollar is up 11%, which I attribute to the same cause.
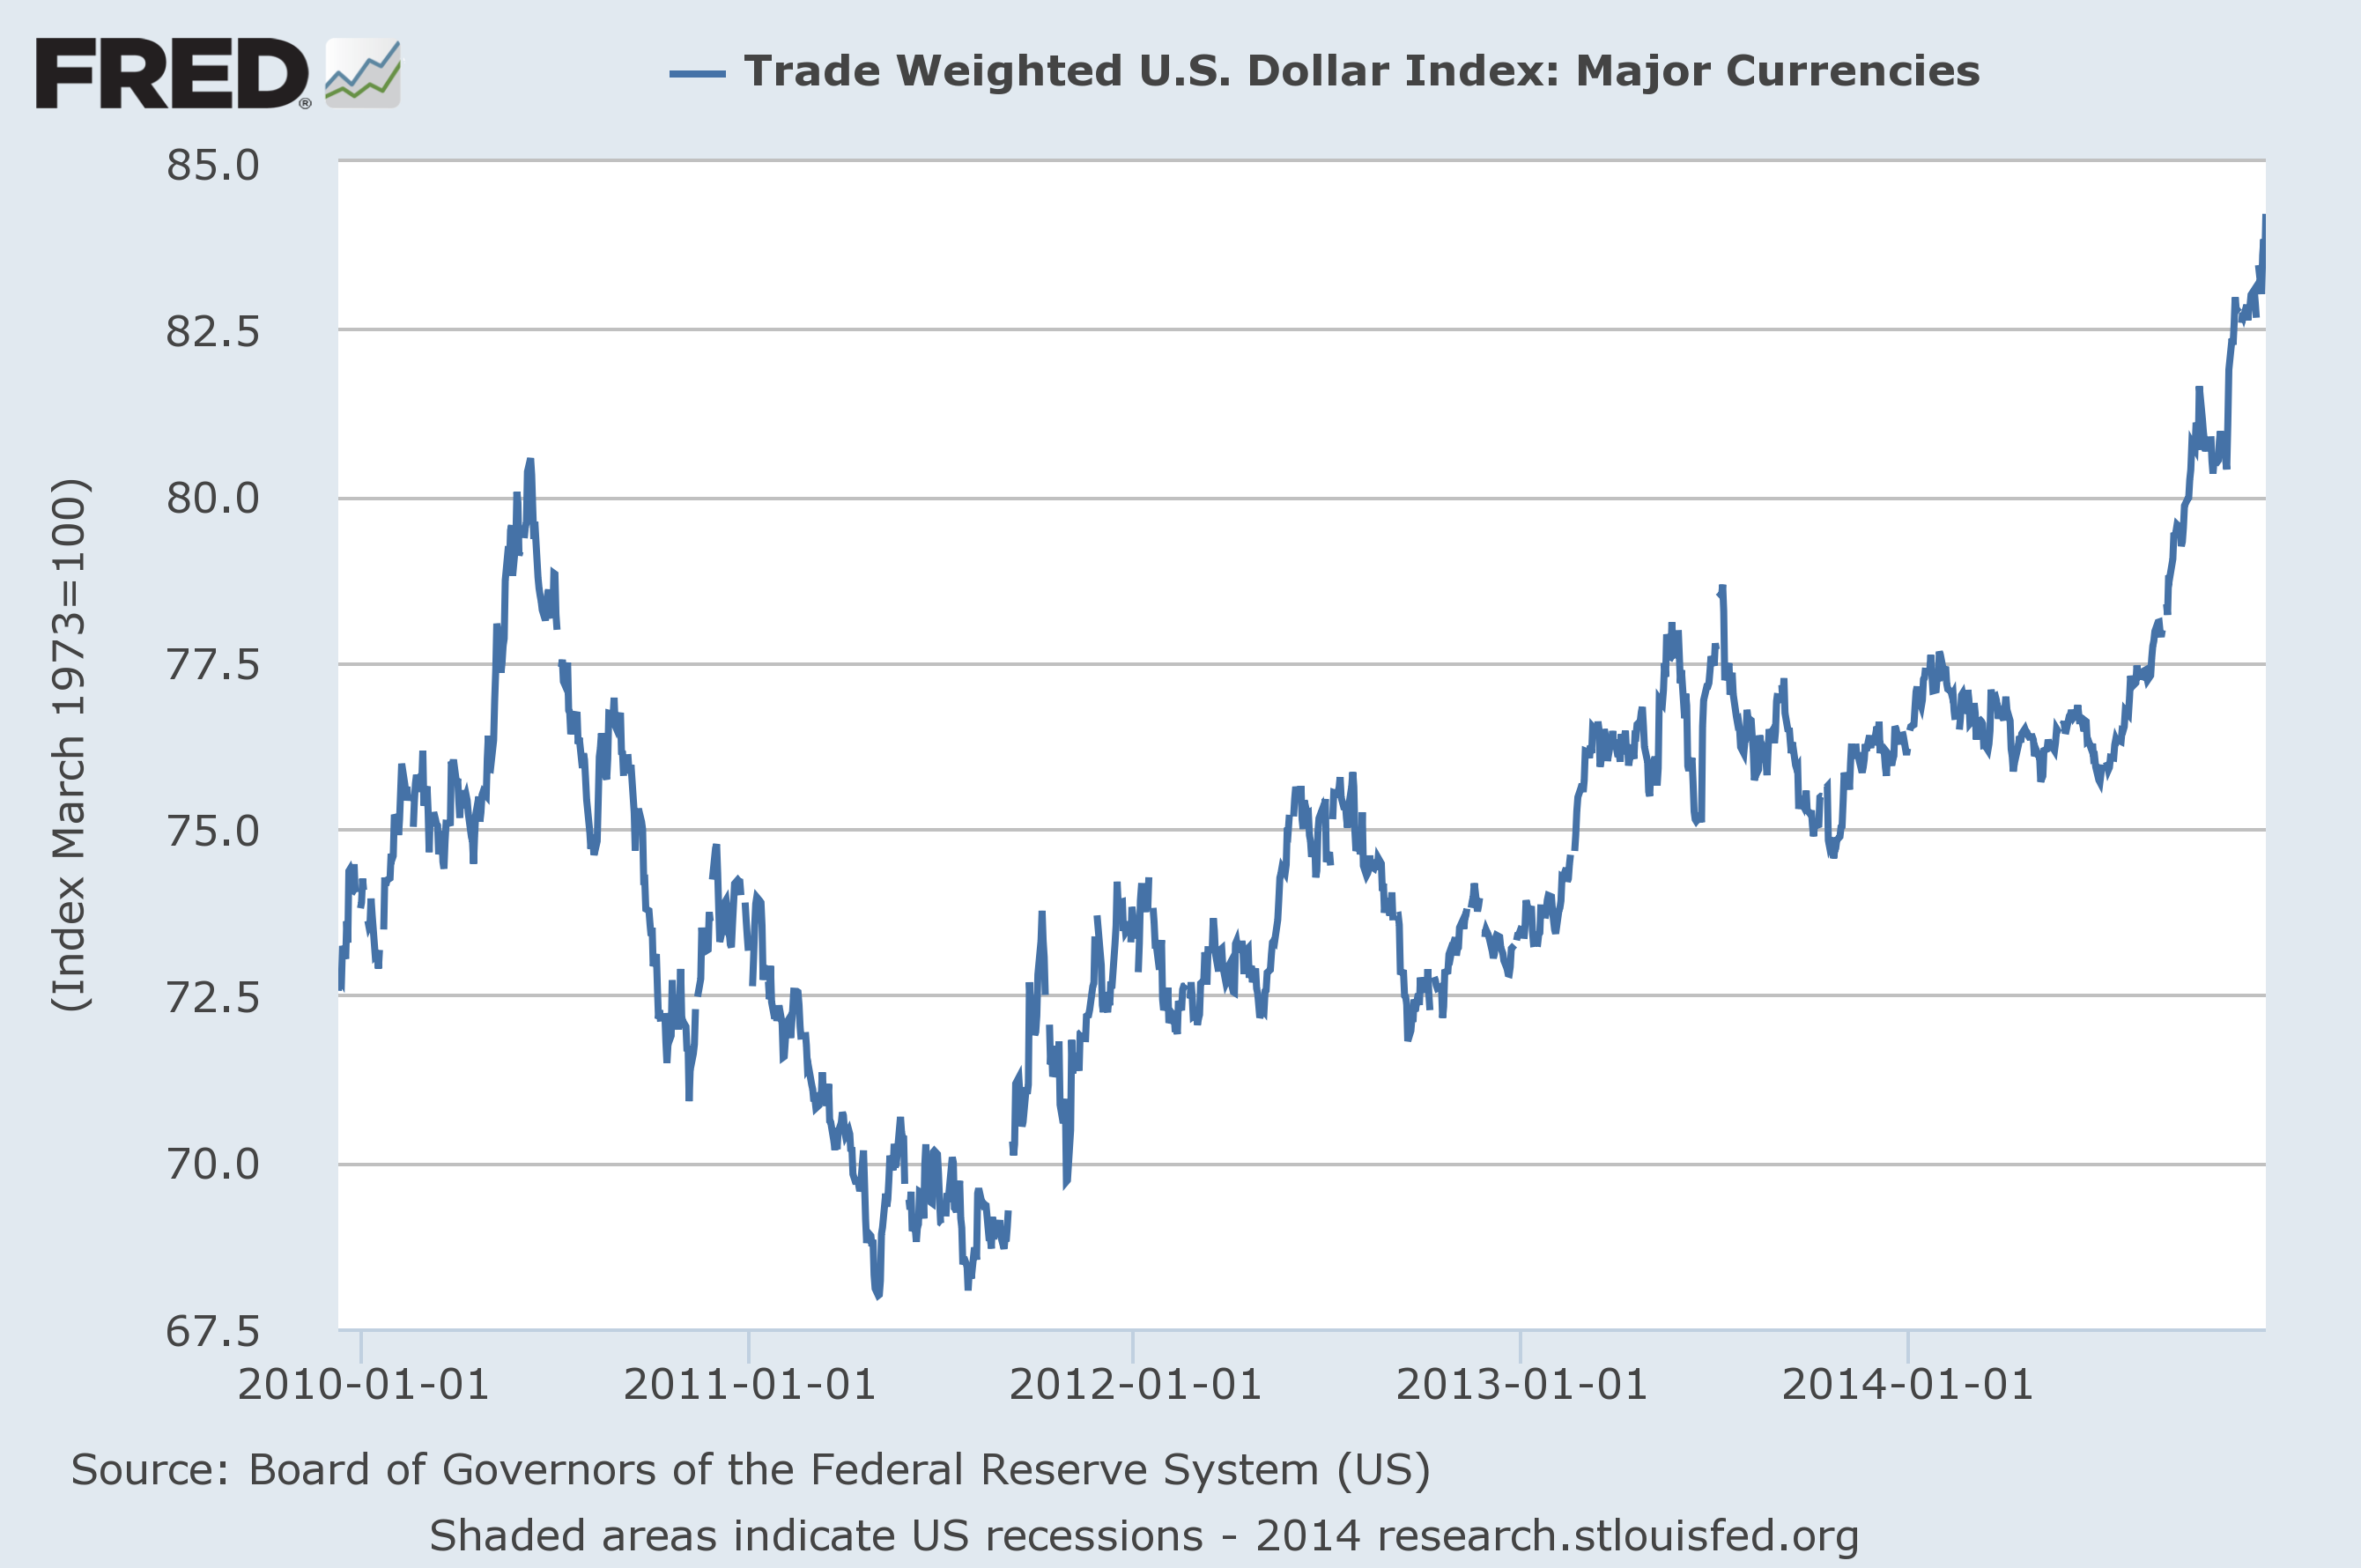
Trade-weighted index of the U.S. dollar. Source: FRED.
To get an impression of the quantitative importance of these developments, I regressed the weekly change in the natural logarithm of the crude oil price (here’s why I use logarithms for this) on the change in the 10-year yield and the change in the logs of the copper price and the value of the dollar using data from April 2007 to June 2014. Here are the results of that regression, with t-statistics in parentheses as calculated using a Newey-West adjustment with 5 lags:

I then used the coefficients from that historical relation to see how much of the drop in oil prices since this summer we would have expected to observe, given the observed drop in copper prices and the 10-year yield and the rise in the value of the dollar. Those predicted values are plotted as the dashed line in the figure below, with the actual price of oil in solid black. Even if we knew nothing on the production side of the oil market, we would have anticipated the price of oil to have fallen from $105/barrel in June to $85 dollars today on the basis of these other three potential indicators of world economic activity.
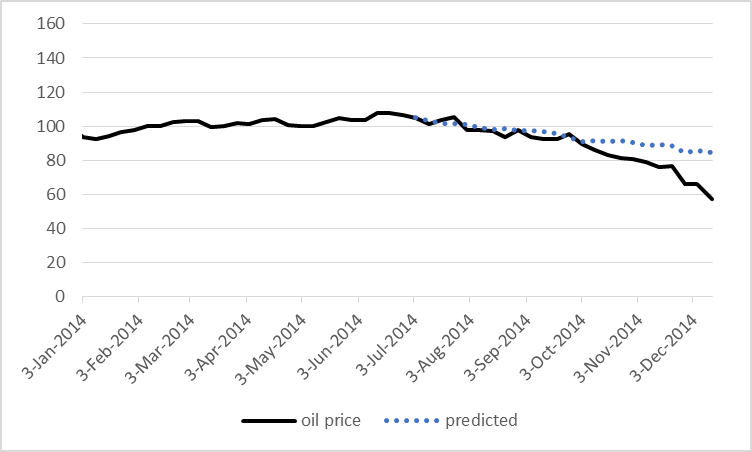
Actual price of West Texas Intermediate (in black) and value predicted on the basis of the above regression (dashed blue).
In other words, of the observed 45% decline in the price of oil, 19 percentage points– more than 2/5– might be reflecting new indications of weakness in the global economy.


